
Abstract
Bipolar Depression (BD) characterised by changes in mood and activity levels is a leading cause of disability worldwide. Current treatments show limited efficacy. Transcranial direct current stimulation (tDCS) is a non-invasive brain stimulation method that is a potential treatment for bipolar depression. We sought to investigate the application of deep learning methods to electroencephalogram (EEG) signals to predict clinical remission. Resting-state EEG data were acquired in 21 BD participants (mean age 51.38 + 10.59 years) at baseline, using a portable 4 electrode EEG device (AF7, AF8, TP9, TP10). Treatment was 6 weeks of home-based tDCS sessions, consisting of 5 sessions per week for 3 weeks and 3 sessions per week for 3 weeks. tDCS was provided in bifrontal montage, anode over left dorsolateral prefrontal cortex (DLPFC) and cathode over right DLPFC, 2 mA, 30 minutes per session. Remission was defined as Montgomery-Åsberg Depression Rating Scale score of less than 8. Power spectral density was derived from EEG signals. Deep learning methods: 1D convolutional neural networks (1DCNNs), long short-term memory (LSTM), gated recurrent units (GRU) and their hybrid models, were investigated for prediction of remission and non-remission status following treatment. Hybrid 1DCNN and GRU model using a combination of delta, theta, and gamma band PSD from AF7 and TP10 electrodes achieved a treatment remission prediction accuracy of 79.55% (sensitivity 76.95%, specificity 83.02%). Compelling prediction accuracy for prediction of treatment remission to a course of tDCS in bipolar depression is achieved from deep learning analysis of resting-state EEG at baseline.
1. Introduction
Bipolar disorder (BP) is a leading cause of disability worldwide which characterized by episodes of elevated mood states as well as depressive and mixed mood states associated with changes in sleep and appetite, energy levels, and psychomotor activity [1, 2]. BD is a recurrent condition, presenting formidable challenges in both diagnosis and treatment. BD intertwines with neurocognitive dysfunction and medical complexities [3, 4]. Pharmacological agents are the primary treatment modality [5], but they are limited in effectiveness and have adverse effects. Transcranial direct current stimulation (tDCS) is a non-invasive neuromodulation technique that is a potential novel treatment for bipolar depression [6,7]. tDCS involves administering a low-amplitude direct current through surface scalp electrodes, which alters cortical excitability by adjusting the resting potential of neural membranes, in which the modulatory effects can persist beyond the duration of the electrical stimulation [8, 9].
Predicting treatment outcomes are crucial for optimizing patient care and improving overall quality of life. By identifying factors that influence individual responses to interventions, clinicians can tailor treatments more precisely, reducing the trial-and-error approach and enhancing the likelihood of successful outcomes, ultimately contributing to more effective and personalized care [10]. Features which have been examined as potential predictors include clinical data, such as demographics, clinical diagnoses, symptom rating scales and treatment history using logistic regression [12], as well as clinical data to predict relapse using machine learning algorithms, namely Support Vector Machines, Random Forests, Naïve Bayes and Multilayer Perceptron [13].
Electroencephalogram (EEG), recognized for its portability, high temporal resolution, and cost-effectiveness, have been applied as potential predictor of treatment response in unipolar depression [17], in bipolar disorder, examining response to lithium or quetiapine treatment based on elastic net regularization machine learning analysis [11], as well as as predictor of response to tDCS treatment in unipolar depression, which provided higher sensitivity and specificity than clinical measures [15].
In the present study, we sought to examine EEG predictors of response to tDCS treatment in bipolar depression. Participants took part in a course of home-based tDCS treatment for bipolar depression, which has demonstrated efficacy in unipolar depression [16]. EEG signals were acquired using a portable wireless 4 electrode EEG device (electrode positions FP7, FP8, TP9, TP10) during resting state. In resting state EEG signals, it is unlikely to see any event related potentials and hence we examined the frequency domain, using power spectral density. The main contributions of this work are: novelty of home-based tDCS treatment for bipolar depression and application of deep learning to EEG power spectral density to predict the treatment remission.
2. Materials and Methods
2.1 Participant Recruitment and EEG Data Collection
All participants provided written informed consent for participation. Ethical approval was provided by London - Fulham Research Ethics Committee. EEG data had been acquired in a sub-sample of 21 BD participants (14 women), mean age 51.38 + 10.59 years. Diagnosis was made based on Diagnostic Statistical Manual of Mental Disorders, Fifth Edition (DSM-5) criteria [1], conducted in structured Mini-International Neuropsychiatric Interview (MINI; Version 7.0.2) [18]. Participants were in a current depressive episode of at least a moderate severity as defined by a minimum score of 18 in the Montgomery-Åsberg Depression Rating Scale (MADRS) (mean score 24.47+2.76). Participants were taking a stable dosage of mood stabilising medication for a minimum of two weeks or not taking any medications for a minimum of two weeks. Exclusion criteria included any concurrent psychiatric disorder, having a significant risk of suicide, or history of epilepsy. Full information about participants and study are available in reference [19].
tDCS treatment was 6-week home-based course of active tDCS, consisting of 5 sessions per week for the first 3 weeks followed by 2 sessions per week for 3 weeks, for a total of 21 sessions. Duration of each session was 30 minutes. tDCS was provided in bifrontal montage: anode at left dorsolateral prefrontal cortex (DLPFC) and cathode at right DLPFC (EEG positions F3 and F4, respectively). Stimulation was 2 mA, and electrode area 35-centimeter square. During each session, the participant was seated comfortably with their eyes open, and research assistant provided a discreet presence without interacting with the participant by video conference. Each participant received real-time guidance by videoconference by trained research team members. Treatment remission was defined as MADRS score of 9 or less at 6-week end of treatment.
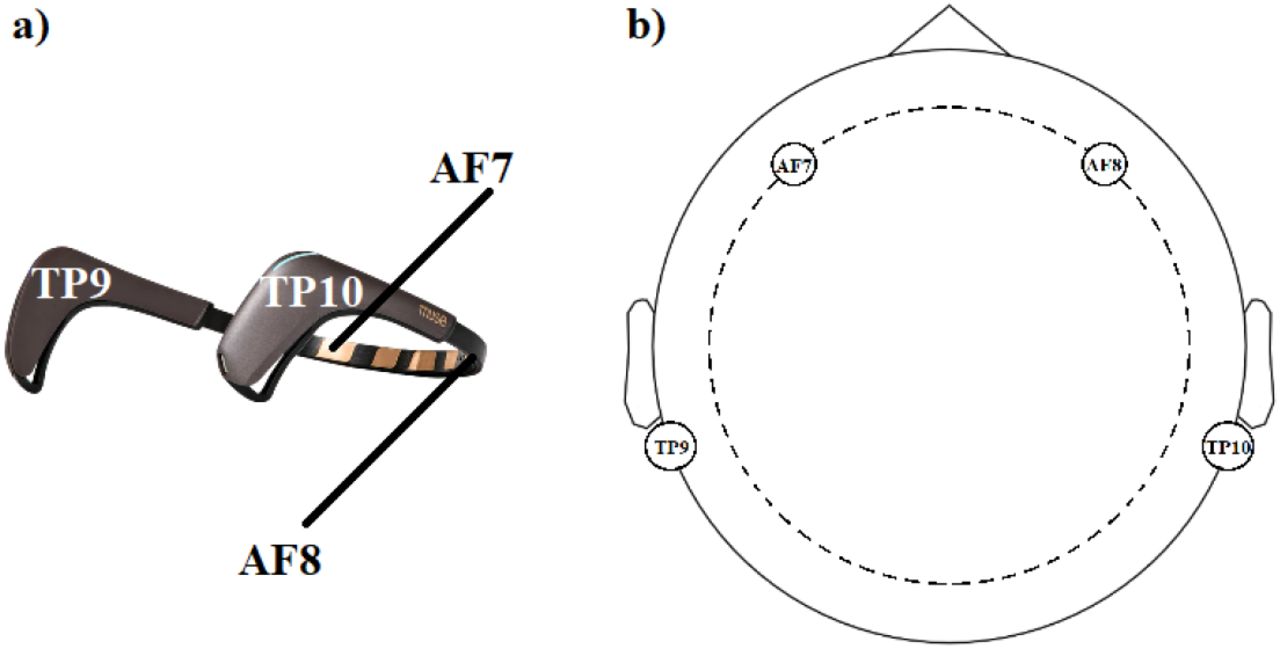
Four 5-minute pre-treatment EEG recordings were acquired for each participant at their home. During EEG recording, participants were instructed to sit relaxed without making any body movements. Two recordings were performed with eyes closed and two with eyes open. EEG recordings were made using 4-electrode MUSE device with a sampling frequency of 256 Hz (Figure 1). Frontal electrode positions were AF7 and AF8 and temporoparietal electrode positions were TP9 and TP10. EEG signals were referenced to FPz electrode. Recorded EEG signals were saved in CSV format, containing timestamps for each EEG sample, raw EEG signals from each electrode, and Horse Shoe Indicator (HSI) values for each electrode indicating the quality of electrode connectivity.

a) MUSE EEG recording device, b) EEG electrode locations on head
2.2. EEG Signal Pre-Processing and deep learning analysis
Eyes closed resting state EEG signals were divided into 60 non-overlapping EEG windows, each spanning 10 seconds. To further process the EEG windows, HSI values were averaged over samples, and windows with an average HSI below 2 were selected. Given the resting-state eyes closed paradigm during EEG data collection, where time-locked evoked potentials were not expected, we focused on extracting relevant information in frequency domain rather than time domain. Power spectral density (PSD) was calculated from selected EEG windows. Each windowed EEG segment was transformed into its corresponding PSD vectors using Welch’s periodogram method [20]. The 10-second EEG windows were divided into 3-second sub-windows with a 2-second overlap. DC component, representing the 0 Hz frequency component in the PSD, is constrained to zero to eliminate the impact of baseline shifts in the EEG signals. For deep learning analysis, PSD values associated with different frequency bands were selected. We have considered full band (0.5 -60 Hz) contains all the bands PSD values, delta band (0.5-4 Hz), theta band (4-8 Hz), alpha band (8-12 Hz), beta band (12-30 Hz), and gamma band (30-60 Hz). Each selected EEG frequency band PSD vector inputs were individually standardised to have zero mean and unit variance before inputting into deep learning model.
For deep learning training, PSD vectors were divided into two groups: remission and non-remission. Following deep learning models were examined: one-dimensional Convolutional Neural Networks (1DCNNs) [21], Long Short-Term Memory (LSTM) networks [22], Gated Recurrent Units (GRU) networks [23] and hybrid model combining CNN and LSTM/GRU architectures. Hyperparameters of the deep learning models were adjusted based on input vector dimension. For four electrode EEG, full band PSD vector had a dimension of 183 x4. In this case, we utilized 244 filters with a kernel size of 3 for 1DCNN models. For individual bands, we employed 16 convolutional filters with a kernel size of 3 spanning full samples of input vector. For LSTM/GRU architectures with alpha band PSD with dimension 12×4, we employed 4 LSTM/GRU units for modelling the network. For LSTM/GRU model, the first two layers used were LSTM/GRU layers. The final two layers of all the models were the same. The second last layer was a fully connected dense layer with 64 neurons and the output layer was a single neuron output layer. For 1DCNN network, one convolution layer is used and for the hybrid models, one 1DCNN layer and one LSTM/GRU layer is used prior to last layers. Other than these layers, maxpooling layer is used along with 1DCNN layer, flatten layer is used prior to first dense layer, and dropout layers were used avoid overfitting.
Leave-one-subject-out (LOSO) testing method was applied. In each group of 21 participants, one was excluded for testing. From remaining 20 participants, 4 (two from each class) were used for validation, leaving data of 16 participants for training. Deep learning model training was performed for 50 epochs, and model with highest validation accuracy was selected for testing. This process was repeated for each participant, and their corresponding average testing accuracies were reported.
3. Results
For full band PSD inputs, deep learning model achieved a superior classification accuracy, ranging from 69-77%, compared to individual EEG bands (Table 1). Classification accuracies for the CNN, LSTM, GRU, hybrid CNN-GRU architecture, and hybrid CNN-LSTM architecture were 73.80, 73.38, 69.59, 73.25, and 76.43%, respectively. When considering individual EEG bands, gamma band yielded the highest classification accuracy. CNN, LSTM, GRU, hybrid CNN-GRU architecture, and hybrid CNN-LSTM architecture achieved classification accuracies of 68.36, 67.45, 69.14, 71, and 70.44%, respectively. We conducted a systematic exploration of various EEG band combinations by concatenating PSD values of different bands., involving all combinations of 2, 3, and 4 EEG bands derived from the four electrodes. We noted an uptick in classification accuracy when PSDs from diverse frequency bands were combined.
Classification accuracies obtained for different classical EEG frequency bands using different deep learning architectures.
We analysed the individual contribution of each electrode and the combination of electrodes. The highest classification accuracies were obtained when concatenation of delta, theta, and gamma bands PSDs from AF7 and TP10 electrodes were used as inputs (Figure 2). The highest classification accuracy of 79.55% was obtained for the hybrid CNN, GRU model (sensitivity 76.95%, specificity 83.02%).

Classification accuracies obtained for different deep learning architectures for the combined delta, theta and gamma PSD vectors from AF7 and TP10 electrodes.
4. Discussion
The present study explored the use of EEG-based predictors to assess the response to home-based tDCS treatment in patients with bipolar depression. The PSD, computed from pre-treatment EEG signals, served as the input for deep learning models to forecast treatment outcomes. The PSD features encapsulate the power distribution across the entire frequency spectrum of the signal, with the resolution solely constrained by the sampling frequency. The incorporation of PSD as an input enables the model to extract features that can be localized within a frequency band or pertain to the structural power distribution within or across frequency bands. This approach enhances the predictive accuracy of the model in determining treatment remission.
Our results indicated that deep learning models, when applied to full-band PSD inputs, achieved superior classification accuracy compared to models using individual EEG bands. Specifically, hybrid models such as CNN-GRU and CNN-LSTM demonstrated notable performance, with accuracies of 73.25% and 76.43%, respectively, highlighting the potential of combining different EEG bands for improved treatment remission prediction.
Among individual EEG bands, the gamma band yielded the highest classification accuracy. This finding aligns with previous research indicating the association of gamma oscillations in cognitive and emotional processing [24, 25], which is disrupted in the left frontal region in bipolar depression during cognitive task [26]. However, the marginally lower accuracy compared to full-band inputs suggests that while the gamma band is informative, the integration of multiple frequency bands provides a more comprehensive understanding of the neural activity associated with treatment response.
The systematic exploration of EEG frequency band combinations revealed that combining PSD values from multiple bands enhances classification accuracy. This outcome underscores the importance of capturing distinct neural oscillatory activities, which likely contribute synergistically to the prediction of treatment outcomes. Notably, the highest classification accuracies were achieved when PSDs from delta, theta, and gamma bands from the AF7 and TP10 electrodes were used as inputs. This specific combination achieved an impressive accuracy of 79.55% with the hybrid CNN-GRU model, demonstrating high sensitivity (76.95%) and specificity (83.02%). These findings suggest that the AF7 and TP10 electrode positions are particularly informative for predicting tDCS treatment response. The delta and theta bands are often associated with deeper stages of sleep and relaxation [27], while the gamma band is linked to higher-order cognitive functions [28]. The effective combination of these bands from AF7 and TP10 may reflect a balance between general brain arousal and specific cognitive processes relevant to mood regulation and treatment responsiveness.
The success of hybrid deep learning models indicated that leveraging the strengths of different architectures can yield better performance. CNNs are proficient in spatial feature extraction and can capture the features within the frequency band while LSTMs and GRUs excel in capturing dependencies between the frequency bands, like distribution of power in multiple frequency bands making their combination particularly powerful for EEG analysis.
Limitations include the sample size and spatial resolution of the EEG data. Increasing the number of electrodes would improve the spatial resolution and may allow for the inclusion of more relevant EEG features in the input. Incorporation of additional variables, such as clinical features, could potentially enhance the deep learning model’s ability to generalize, resulting in improved performance.
6. Conclusion
In conclusion, our study demonstrated the potential of using deep learning models with baseline resting-state EEG power spectral density to predict treatment remission of home-based tDCS treatment in bipolar depression. The novelty of home-based tDCS treatment, combined with advanced analytical methods, provides valuable insights for developing targeted treatment decision-making approaches. Further validation with larger datasets is essential to establish the reliability and generalizability of the proposed method for real-world clinical applications. Additionally, investigating the neurobiological underpinnings of the identified EEG markers could provide deeper insights into the mechanisms of tDCS treatment and its effect on bipolar depression.
Data Availability
All data produced in the present study are available upon reasonable request to the authors
References


