
Abstract
Alzheimer’s disease (AD) is the leading cause of dementia in aging individuals. However pathophysiological processes involved in the brain are still poorly understood. Among numerous strategies, a comprehensive overview of gene expression alterations in the diseased brain has been proposed to help for a better understanding of the disease processes. In this work, we probed the differential expression of genes in different brain regions of healthy and AD adult subjects using data from three large studies: MAYO Clinic; Mount Sinai Brain Bank (MSBB) and ROSMAP. Using a combination of differential expression of gene (DEG) and isoform switch analyses we provide a detailed landscape of gene expression alterations in the temporal and frontal lobes, harboring brain areas affected at early and late stages of the AD pathology, respectively. Next, we took advantage of an indirect approach to assign the complex gene expression changes revealed in bulk RNAseq to individual cell types of the adult brain. This strategy allowed us to identify cell type/subtype specific isoform switches in AD brains previously overlooked. This was the case, for example, for the AD causal gene APP and the risk gene BIN1, which presented isoform switches with potential functional consequences in neuronal cells. Altogether, our work proposes a novel integrative strategy to analyze RNAseq data in AD based on both gene/transcript expression and regional/cell-type specificities.
Introduction
Changes in gene expression characterize a multitude of human diseases and have been successfully used to predict molecular and cellular mechanisms associated with pathological processes (Masters et al., 2015). Alzheimer’s disease (AD) is the most prevalent type of dementia and causes a progressive cognitive decline, for which there is no effective treatment or cure. Although expression analyses in brain diseases are generally limited by tissue availability, RNA sequencing (RNAseq) data have been generated from postmortem brain samples of healthy and AD individuals (Allen et al., 2016; De Jager et al., 2018; Wang et al., 2018). However, a comprehensive description of the gene expression alterations in the AD brain remains elusive.
Recent work has begun to address this important gap in the study of AD pathology using bulk brain tissue RNA sequencing (RNAseq) (T. Raj et al., 2018) or single-cells RNA sequencing (scRNAseq) (Grubman et al., 2019; Mathys et al., 2019). However, these studies have focused on samples obtained from different brain regions, namely the dorsolateral prefrontal (Mathys et al., 2019; T. Raj et al., 2018) and entorhinal cortices (Grubman et al., 2019), which could lead to important discrepancies in the results. Indeed, the AD pathology shows a progressive impact on different brain regions, characterized at early stages by the presence of TAU protein inclusions in the locus coeruleus, the transentorhinal and entorhinal regions (stages I and II). This is followed by the presence of tau inclusions in the hippocampal formation and some parts of the neocortex (stages III and IV), followed by large parts of the neocortex (stages V and VI) (Braak & Braak, 1991). Accordingly, a recent study has shown that changes in protein expression are much more prominent in areas affected at early and intermediate stages, such as the hippocampus, entorhinal cortex and cingulate cortex in the temporal lobe, compared to other brain regions affected at later stages of AD pathology, such as sensory cortex, motor cortex and cerebellum (Xu et al., 2019).
Another important aspect to consider is the descriptive relevance of gene expression analysis based solely on the identification of differentially expressed genes (DEG), which fails to detect dynamics in the expression of multiple related transcripts (Yi et al., 2018). Recently, new approaches using transcripts-level analysis, so called differential transcript usage (DTU), enables identification of alternative splicing and isoform switches with prediction of functional consequences (Anders et al., 2012; Vitting-Seerup & Sandelin, 2019). Therefore, important gene expression modifications in the AD brain could occur at the transcript level and be overlooked in classical DEG analyses.
Here, we took advantage of three available RNAseq datasets, generated using samples from different brain regions, to systematically probe gene expression changes (DEG and DTU) in AD. In the Mayo’s clinic study, both the temporal cortex and cerebellum were used to obtain bulk RNAseq (Allen et al., 2016). In the Religious Orders Study (ROS) and Memory and Aging Project (MAP), henceforth called ROSMAP, the dorsolateral prefrontal cortex was used (De Jager et al., 2018). Finally, in the Mount Sinai/JJ Peters VA Medical Center Brain Bank (MSBB), 4 different Brodmann areas of the brain were studied: areas 22 and 36 from the temporal lobe, areas 10 and 44 in the frontal lobe (Wang et al., 2018). We also added another level of complexity using an indirect approach to assign DEGs and gDTUs to unique cell types in order to identify AD gene expression signatures for neural cells, microglia and endothelial cells. Finally, we linked these alterations with AD causal and risk genes, identifying novel isoform switches in BIN1 and APP genes of potential functional consequences for pathology progression.
Results
Regional gene expression alterations in the AD brain correlates with pathological progression
Several consortia have generated RNAseq data from brains of individuals with a clinical and/or pathological diagnostic of AD (Allen et al, 2016; Wang et al, 2018; De Jager et al, 2018). Considering the regional progression of AD pathology (Braak and Braak, 1991), we set out to identify and compare differentially expressed genes (DEG) in the temporal lobe (TL), encompassing brain regions affect at early stages of the AD such as the hippocampus and entorhinal cortex, and in the frontal lobe (FL), affect at more advanced stages of the pathology (Figure 1).

Datasets obtained from 3 consortia (Mayo, MSBB and ROSMAP) were grouped according to the brain region sampled in frontal lobe (FL) or temporal lobe (TL). Next, RNAseq data was pseudo-aligned using Kallisto and analyzed using the packages from R (version 3.6) DESeq2, IsoformSwitchAnalyzeR (ISAR) and gene-set enrichment analysis (GSEA). Assignment of differentially expressed genes or isoform switches to specific cell types was performed indirectly using scRNAseq signatures obtained from the Allen Brain Atlas transcriptomic data.
We found 3,348 (1244 down- and 2104 up-regulated genes) and 2,172 (1170 down and 999 up-regulated genes in BM22 and BM36; 3 genes regulated in opposite directions in these two areas) DEGs in the TL of AD individuals compared to their respective controls in the MSBB_TL and Mayo datasets, respectively (Figure 2A-B; Supplementary table 1). Of those DEGs, 734 genes (145 down and 520 up) were commonly regulated in both Mayo and MSBB_TL (88.4% of genes altered in the same direction; 15,33% of overlap; p= 8.56 × 10−59, hypergeometric test). In contrast, only 327 (113 down and 214 up) and 209 (97 down and 112 up) DEGs were detected in the MSBB_FL and ROSMAP, respectively. Of those, 31 genes (18 down and 13 up) were found in both datasets (7,34% of overlap; p = 1.67 × 10⁻¹⁴, hypergeometric test) (Figure 2A-B; Supplementary table 1). These differences in the number of DEGs detected in the FL and TL cannot be attributed to lack of statistical power, since the number of samples in the FL is larger than in the TL groups (Figure 1). Notably, 62.5% of the DEGs detected in the FL are also detected in the TL (Figure 2B), suggesting that gene expression changes in the FL could recapitulate initial alterations in the TL.

A) Volcano plots showing differentially expressed genes (DEG, red dots; FC > 1.3 and FDR < 0.01) in the frontal lobe (ROSMAP and MSBB FL - BM10 and BM44) and temporal lobe (MAYO and MSBB TL - BM22 and BM36). B) Venn diagram showing the number of DEGs identified in the different datasets. C) Gene ontology terms enriched for DEGs identified in the TL or FL intersections (TLI and FLI, respectively).
Next, we performed gene set enrichment analyses (GSEA) for genes with expression altered in similar brain regions of the AD brains compared to controls, and identified in at least two independent datasets. For that, we selected only DEGs in the intersection MAYO/MSBB TL (temporal lobe intersection - TLI) or ROSMAP/MSBB FL (frontal lobe intersection - FLI). We found that DEGs in the temporal lobe are enriched for terms (GO:BP, GO:CC and KEGG) associated with generic biological processes, such as cell-signaling pathways and cell-cell signaling, whereas the small number of DEGs in the FLI were not significantly enriched for any term (Figure 2C; see also Supplementary table 2 for detailed information and GSEA using alternative sources). Together, these data indicate that changes in gene expression are much more significant in the TL as compared to the FL. Importantly, this is true even in tissues obtained from the same donors, as it is the case for the MSBB_TL and MSBB_FL samples, ruling out some potential biases due to tissue processing.
Differential transcript usage analyses reveal novel genes associated with AD pathology
Gene-level expression analysis lacks the sensitivity to detect possible changes at the transcript-level caused, for example, by alterations in alternative splicing (Vitting-Seerup & Sandelin, 2017; Yi et al., 2018). To overcome this limitation, we used differential transcript usage (DTU) analysis to identify additional alterations of gene expression in the AD brains compared to controls. We observed 2,509 and 1,843 genes with differential transcript usage (gDTU) in the temporal lobe of AD brains studied in the Mayo and MSBB datasets, respectively (Figure 3A-B; Supplementary table 1). Similar to what we observed for DEGs, a much smaller number of gDTUs were detected in the frontal lobe, both in ROSMAP and MSBB studies (59 and 855 genes with transcripts altered, respectively). We found 435 gDTUS in TLI (11,1% of overlap; p= 6.16 × 10⁻²⁵, hypergeometric test) and 13 gDTUs in FLI (1,47% of overlap; p= 2.56 × 10⁻³, hypergeometric test). In TLI, most gDTUs did not overlap with DEGs (TL - 34 gDTUs that are DEGs out of 435 gDTUs), whereas in FLI, we found no overlap at all. Interestingly, GSEA revealed that gDTUs in the TLI were significantly enriched for vesicle-mediated transport and other synapse-related terms that were not observed while inputting only DEGs (Figure 3C; Supplementary table 2). Among the gDTUs in synapse-related terms that were not detected in DEG analysis, we observed several genes previously associated with AD and/or cognitive impairment, such as APP, CALB1, GABRA1, KCNA2, NTRK2 and RAB5B (Choi et al., 2013; Devi & Ohno, 2015; Limon et al., 2012; Masnada et al., 2017; Odero et al., 2010). In contrast, the enrichment for cell-signaling terms observed for DEGs was not observed for gDTUs alone (Figure 3D). Altogether, these observations suggest that the use of DTU is complementary to DEG analysis, allowing the detection of gene expression signatures relevant associated with key hallmarks of the AD pathology.

A) Volcano plots showing genes with differential transcript usage (gDTU, yellow dots; Differential isoform fraction (dIF) > 0.05 and FDR < 0.05) in the frontal lobe (ROSMAP and MSBB_FL - BM10 and BM44) and temporal lobe (MAYO and MSBB_TL - BM22 and BM36). B) Venn diagram showing the number of gDTUs identified in the different datasets. C) Synapse-related terms enriched for gDTUs in the TLI are not observed in the FLI. D) Comparison of GO and KEGG terms enriched for DEG, gDTU or DEG+gDTU identified in the TLI.
Differential expression of genes involved in alternative splicing correlates with isoform switch
To evaluate whether gDTUs could be associated with AD hallmarks, we measured gDTUs observed at different disease stages in the MSBB dataset using the Braak classification (Figure 4; Supplementary Table 3). For this purpose, we subdivided AD and control samples in three groups: low Braak (0, 1 and 2) - 196 samples (clinical diagnosis: 15 AD and 181 controls); mid Braak (3 and 4) - 133 samples (clinical diagnosis: 58 AD and 75 controls); and high Braak (5 and 6) - 308 samples (clinical diagnosis: 305 AD and 3 controls). Next, we evaluate the number of gDTUs when comparing individuals at these different stages (Figure 4). We observed that most gDTUs were detected only at high Braak stages (Figure 4A-D) both in the FL (BM10 and BM44) and TL (BM22 and BM36), indicating that gene isoform switch is associated with AD hallmark progression.

A-D) Total number of gDTUs identified following comparison of different Braak stages (Low vs. High, Low vs. Mid and Mid vs. High) in the 4 brain regions sampled in the MSBB study. E-F) Differential expression of genes associated with splicing/spliceosome after comparison of different Braak stages (E) or AD vs Controls in different datasets (F). Red and blue squares indicate, respectively, up and downregulated genes. Gene symbols highlighted in red indicate genes belonging to the neuronal splicing machinery.
Next, we set out to evaluate possible alterations in the expression of genes encoding for proteins associated with the splicing machinery. We found that among 441 genes related to ‘splicing’ or ‘spliceosome’ terms, 79 were DEGs at high Braak stage compared to low or mid Braak stages (Figure 4E). In contrast, we could not detect any DEG in the comparison of mid vs low Braak stages. Noteworthy, we found that several genes associated with the neuronal splicing regulatory network (B. Raj & Blencowe, 2015) were differentially expressed at high Braak stages (Figure 4E, highlighted in red). Among them, RBFOX1, RBFOX2 and ELAVL2 were downregulated both in the FL and TL, whereas MBNL3 and PTBP1 were upregulated in the TL (BM36) and NOVA2 was upregulated in the FL (BM10). A similar pattern was observed when we evaluated the differential expression of the same 441 genes in all AD vs control subjects in different datasets (Figure 4F). Of note, we could still observe that DEGs were more prominent in the TL than in the FL (even if the number of DEGs was smaller, likely due to the effects of combining low, mid and high Braak stages in the AD group). Altogether, these data suggest that changes in the expression of splice regulator proteins are more frequent in areas with high stage of pathology and could help to explain the predominant gene isoform switch observed in the TL of AD brains.
Differential gene expression in separate cell types of the human brain
To further refine our analysis, considering the cellular diversity in the brain, we took an indirect approach to sort DEGs and gDTUs according to cell types. To that, we used scRNAseq data (Allen Brain) obtained from the adult human brain to identify cell types expressing the genes altered in our DEG/gDTU analysis (Figure 4A; supplementary figure 3). We found that, out of the 1135 genes with altered expression, i.e. gDTU + DEG, in the intersections of temporal lobe (Figures 2 and 3), 839 were found in at least one cell-type (scTLI) using as cut-off the expression in more than 10% of cells assigned for a specific cell-type (Supplementary table 4). From these, 239 were identified in unique cell-types/subtypes, 396 in multiple (2-4 cell-types) and 211 in all cell-types analyzed (Figure 5A; Supplementary Figures 3 and 4; Supplementary table 4). Confirming our strategy, GO analyses using cell-type specific genes revealed that DEGs/gDTUs in the TLI of AD patients were significantly enriched for biological processes associated with inflammation in microglial cells, whereas those associated with cell adhesion were enriched in endothelial cells (Figure 5B; Supplementary table 5). Similarly, DEGs/gDTUs identified in neuronal cells were enriched for GO terms such as synaptic signaling, synaptic plasticity and synapse vesicle cycle (Figure 5C). Notably, these enrichments were more significant in GABAergic neurons, which could suggest a more pronounced pathological burden on these cells compared to glutamatergic neurons (Figure 5C). Also of note, comparison of the cell-type gene expression signatures identified in our work with previous studies using scRNAseq in AD (Mathys et al., 2019; Grubman et al., 2019) showed a similar degree of overlap (Supplementary Figures 1 and 2; Supplementary table 6). Altogether, these data support the notion that our indirect approach to assign gene expression alterations to unique cell types is valid and allow us to detect cell-type specific isoform switches associated with AD pathology.

A) Schematic representation showing our strategy to assign DEGs and gDTUs identified in the TLI to specific cell-types of the adult human brain (see also Supplementary Figure 3). Out of 839 single-cell TLI genes (scTLI), 281 were expressed in a unique cell-type, 249 in 2 to 4 cell-types and 77 in all cell-types/subtypes analyzed. B) Gene ontology terms enriched for scTLI DEGs, gDTUs or both per cell type. C) Selected GO terms associated with synaptic transmission.
DEG/gDTU analyses identify cell-type specific alterations in AD risk/causal genes
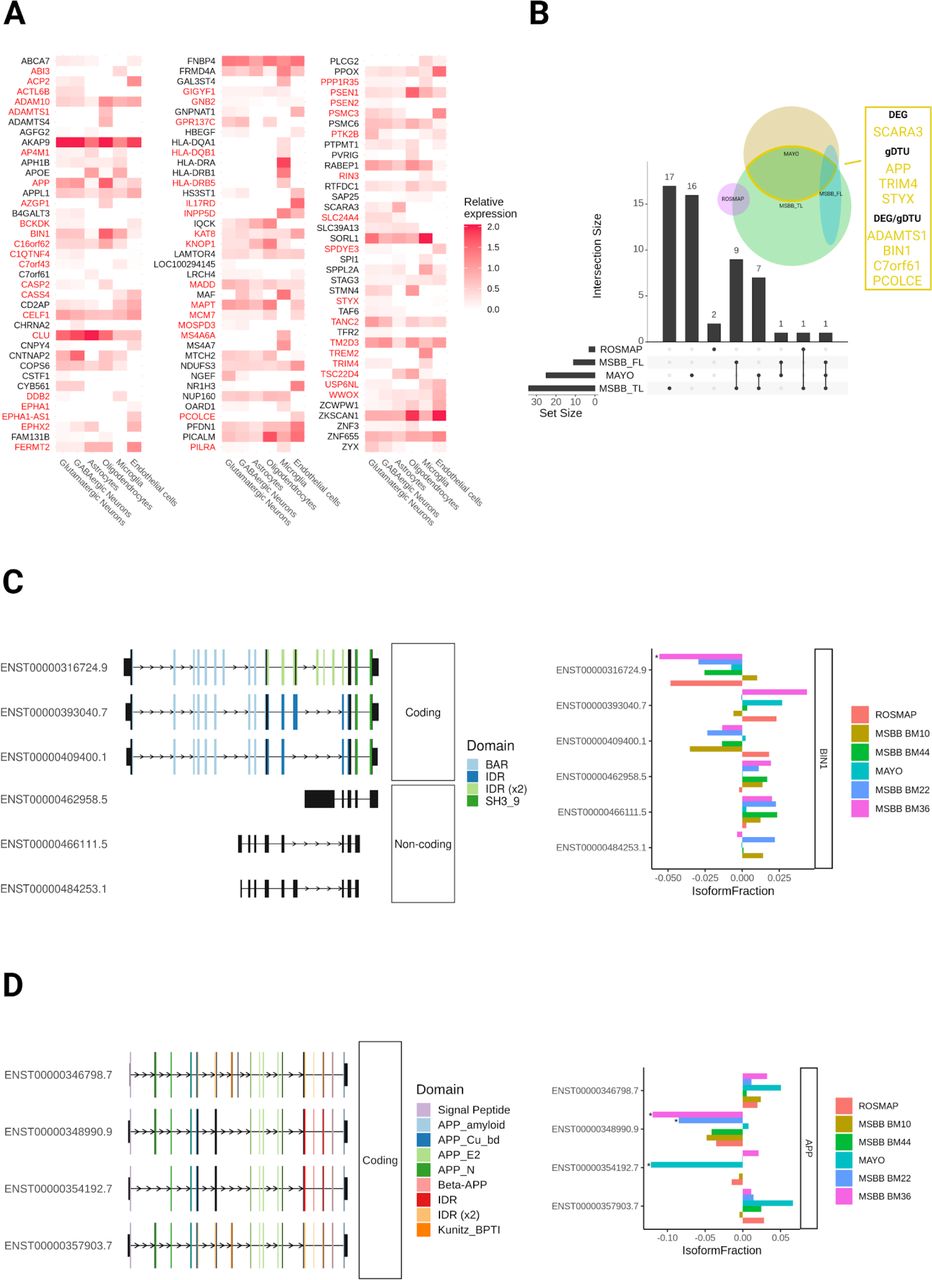
Genomic association studies have revealed about 45 loci containing variants related to an increased or decreased probability of developing AD (Kunkle et al., 2019; Lambert et al., 2013). However, the functional variants and their target genes remain mostly elusive (Dourlen et al., 2019). To contribute with the identification of target genes, we first evaluate the expression of 176 genes located within the 45 loci associated with AD odds (Dourlen et al., 2019) and 3 causal AD genes – PSEN1, PSEN2 and APP (Supplementary table 7) in individual cell types of the adult human brain. We found that 116 out of the 179 AD risk/causal genes were expressed by at least one of the major cell types identified in the brain (Figure 6A). Subsets of these genes were exclusively expressed either in microglial cells (14 out of 116), neurons (12), astrocytes (2), oligodendrocytes (6) or endothelial cells (6), suggesting cell-type specific roles for these AD risk/causal genes.

A) Heatmap showing the expression of predicted AD risk/causal genes in different cell types of the adult human brain. DEGs and gDTUs in at least one dataset are highlighted in red. B) Venn diagram showing the number of AD risk/causal DEGs or gDTUs identified in the different datasets analyzed. The intersection between MAYO and MSBB TL is highlighted in yellow and genes identified are shown in the yellow box. C) Representation of the 6 most significant BIN1 isoforms altered (left) and quantification of the differential isoform fraction (dIF) in AD brains compared to controls (right). Main protein domains are indicated with different colors. D) Similar representation for APP. * dIF > 0.05 and FDR > 0.01.
Next, we set out to evaluate the differential expression or transcript usage for these genes. We observed that 54 DEGs/gDTUs among all three bulk RNAseq datasets out of 116 AD risk/causal genes expressed by brain cell types (Figure 6). Among those genes, only 2 were exclusively identified in the FL (Figure 6B). We, therefore, decided to focus on the AD risk/causal genes identified in the temporal lobe for further analyses. In this region, we identified 27 and 17 DEGs/gDTUs in the MSBB_TL and Mayo datasets, respectively, including some well-characterized AD risk genes, such as ADAM10, BIN1, CLU and TREM2, and the causal AD genes APP, PSEN1 and PSEN2 (Figure 6A-B). Eight genes were altered in both datasets (Figure 6B, yellow box; 15,38% of overlap) and were selected for further analysis of isoform switch. Using ISAR to identify the isoforms altered in the AD brains compared to controls, we observed some patterns of isoform switch that could have important functional relevance (Figure 6C and D). For instance, while BIN1 transcripts ENST00000316724.9 (NP_647593.1 - isoform 1) and ENST00000409400.1 (NP_647600.1 - isoform 9) were downregulated, transcripts ENST00000393040.7 (NP_647598.1 - isoform 6) and ENST00000462958.5, ENST0000046611.5 and ENST00000484253.1 (Retained introns) were upregulated (Figure 6C). This pattern could lead to a decrease of the neuronal specific BIN1 isoform 1 expression (Zhou et al., 2014), given that retained introns are non-coding sequences. Using western blotting analysis, we confirmed this decrease of BIN1 isoform 1 protein in the frontal cortex and hippocampus of AD brain samples compared to controls (Supplementary Figure 5).
We also observed isoform switches in the AD causal gene APP with possible functional consequences in neuronal cells. While two APP isoforms were downregulated (ENST00000348990 and ENST00000354192), the isoforms ENST00000346798 and ENST00000357903 were upregulated in Mayo and MSBB datasets (Figure 6D). Noteworthy, significantly downregulated APP isoforms lack exon 7, which contains the Kunitz protease inhibitor (KPI) domain (Figure 6). KPI is one of the main serine protease inhibitors and increased KPI(+)APP mRNA and protein expression levels have been described in AD brains and are associated with increased amyloid beta deposition (Tanzi et al., 1989; Johnson et al., 1989; Kitaguchi al., 1988). At the exception of ENST00000354192, the other transcripts are mostly expressed in neurons (Marques-Coelho and Costa, unpublished data), indicating that these cells may have a selective increase in the expression of KPI(+)APP and, consequently, enhanced production of Aβ1-42.
Discussion
A comprehensive knowledge of gene expression alterations associated with the onset and progression of human diseases is a key step towards the understanding of their cellular and molecular mechanisms (T. I. Lee & Young, 2013). In this work, we provide a novel framework to identify cell-type specific gene expression alterations in AD using patient-derived bulk RNAseq. Comparing RNA-sequencing data obtained from distinct brain regions of control and AD patients, we show that changes in gene expression are more significant in the temporal than frontal lobe. We also show that a large number of genes present isoform switches without changes in the global expression levels. As a consequence, these genes are overlooked in classical differential expression analysis, but can be detected through differential transcript usage analysis. Gene isoform switches are mostly evident at late stages of the pathology and are likely associated with altered expression of genes encoding for splicing-related proteins. Using an indirect approach to assign genes to unique cell types, we are also able to map DEGs/gDTUs to unique cell populations of the adult brain, and our results are comparable to previously published scRNAseq data (Grubman et al, 2019; Mathys et al, 2019). Finally, we show that a subset of AD causal/risk factors such as APP or BIN1 are differentially expressed in the AD brain. Altogether, our work provides a comprehensive description of regional and cell-type specific gene expression changes in the AD brain and suggests that alternative splicing could be an important mechanism for pathological progression.
Despite the availability of RNAseq datasets generated from healthy subjects and AD patients (Allen et al, 2016; Wang et al, 2018; De Jager et al, 2018), a systematic evaluation of the gene expression changes in the AD brain, as well as comparisons of these changes in distinct brain region, had not yet been performed. To the best of our knowledge, only one study aimed at comparing gene expression levels in different AD brain regions (Haroutunian et al., 2009), but this work was based on microarray data which has a limited gene coverage. We here show, using bulk tissue RNAseq data, that alterations in gene expression are highly prominent in biological samples obtained from the temporal lobe, which harbors the first brain regions affected in the AD pathogenesis (Braak and Braak, 1991). Conversely, few changes are present in biological samples derived from the frontal lobe, whose cells are affected only at advanced stages of the AD. These observations are in line with recent data showing that changes in protein expression levels in AD brains are much more prominent in the temporal lobe (hippocampus, entorhinal cortex and cingulate gyrus) than in the frontal lobe (motor cortex) (Xu et al., 2019). They can also help to explain the low number of DEGs identified in scRNAseq data obtained from the frontal lobe compared to a similar study in the entorhinal cortex (Figures S1 and S2; Mathys et al., 2019; Grubman et al., 2019). Although we cannot formally rule out that a stage-dependent increase in the number of DEGs and gDTUs could be due to the loss of neuronal cells in brain regions affected by the pathology, several lines of evidence indicate that this is not the most parsimonious explanation for the data described here. Firstly, we observe that the percentage of up and down regulated genes in GABAergic and glutamatergic neurons are close to 50%, ruling out the possibility that changes in cell numbers could explain these changes. Secondly, previous scRNAseq studies in AD observed a consistent fraction of cell types isolated across control and AD individuals (Mathys et al., 2019; Grubman et al., 2019), ruling out significant changes in cellular composition of AD brains. Lastly, the large number of genes with total expression levels unchanged, but presenting isoform switches in the AD brains may likely presuppose a steady cellular composition of the tissue.
These latter findings also support the notion that a substantial source of gene expression changes in the AD brain might be due to alternative splicing (T. Raj et al., 2018). Classical DEG analysis using DESeq or edgeR, which rank all gene transcripts, including non-coding sequences (Costa-Silva et al., 2017), are insensitive to the dynamics of gene expression that could, for example, lead to isoform switches with important functional consequences (Vitting-Seerup and Sandelin, 2017). Accordingly, we show that a large set of genes in the AD brain, especially in the temporal lobe, have isoform switches but are not detected by DEG analysis. In other words, comparisons of the total expression of these genes in AD vs control subjects does not show statistical significance, whereas the dynamics individual transcripts/isoforms of the same genes may be profoundly altered, leading to statistically significant differences in transcript usage.
By using DTU analysis, alone or in combination with DEG analysis, we are able to identify gene sets associated with key biological processes associated with AD pathogenesis, such as synaptic communication, immune response, inflammation, endocytosis and cell-signaling (Canter et al., 2016). Notably, a significant proportion of gDTUs, but not DEGs, are associated with synapse GO terms. This limitation in the detection of altered gene expression associated with synapse-related terms is partly overcome by analyzing separate cell populations in scRNAseq data (Mathys et al., 2018; Grubman et al., 2018). However, technical aspects hamper the analysis of these data to detect isoform switches (Arzalluz-Luqueángeles & Conesa, 2018). We here used an indirect approach to assign DEGs and gDTUs to unique cell types and provide evidence that such strategy is comparable to previous scRNAseq studies (Mathys et al., 2019; Grubman et al., 2019). Our results suggest a more pronounced pathological burden on GABAergic than glutamatergic neurons. Interestingly, it has been suggested that early parvalbumin-expressing GABAergic neuron dysfunction critically contributes to abnormalities in oscillatory rhythms, network synchrony, and memory in hAPP mice and possibly in AD (Verret et al., 2012). It is tempting to speculate that early dysfunction of GABAergic neurons could lead to increased neuronal activity and synapse downscaling (Dörrbaum et al., 2020).
Gene isoform switches can be partly explained by alternative splicing (Arzalluz-Luqueángeles & Conesa, 2018). Accordingly, we provide evidence for alterations in the splicing machinery at mid to late stages of the disease that could help to explain the high number of gDTUs observed at later stages. Again, these alterations are more abundant in the TL than in the FL, which could help to explain the low number of gDTUs in the latter brain region identified in our work and in previous study using a different strategy to detect isoform switch (Raj et al., 2018). Also, in accordance with our results, it has been shown that APP-695 transcript is reduced in the hippocampus, but not cerebellum, of AD patients (Johnson et al., 1989). Thus, there is a regional susceptibility to isoform switch correlated with changes in the expression of genes encoding for proteins of the splicing machinery in the AD brain.
Particularly interesting, genes involved in the control of alternative splicing in neurons are highly affected in the temporal lobe. Decreased expression of RBFOX1 and 2, for example, could lead to an increased rate of exon inclusion (Alam et al., 2014; B. Raj & Blencowe, 2015) as observed for the APP gene in our study. Indeed, reduced expression of RBFOX1 has been associated with an increased inclusion of exon 7 in the APP gene, leading to an enhanced expression of APP isoforms 770 and 751 containing the KPI domain (Alam et al., 2014). A similar switch in the APP isoforms has also been associated with somatic gene recombination in AD (M. H. Lee et al., 2018), further indicating that increased ratios of APP isoforms containing the KPI domain could be detrimental to neurons. Considering these findings and the well-established associations between APP-KPI expression levels, amyloid plaque deposition and AD pathology progression (Tanzi et al., 1988, Johnson et al. 1990; Kitaguchi et al., 1988), it is tempting to speculate that controlling APP isoform switches by manipulating RBFOX family proteins could be a potential therapeutic strategy to hamper disease progression.
Another interesting isoform switch detected in our study is for the AD risk gene BIN1, which is a major risk factor for AD (Lambert et al., 2013; Kunkle et al., 2019). BIN1 comprises a N-BAR domain involved in membrane curvature sensing, an SH3 domain that binds to proline-rich motifs, and a clathrin-binding domain (CLAP) specific of the neuronal isoform 1 (Zhou et al., 2014). We show that the transcript encoding for this latter isoform is significantly reduced in the temporal lobe, suggesting that expression of BIN1 isoform 1 in neurons is reduced. This observation is in line with decreased BIN1 isoform 1 protein expression in the AD brain compared with controls (our own results; Glennon et al., 2013). This would be also in agreement with the observation that an overexpression of the BIN1 isoform 1 may be protective in a model of Tauopathy (Sartori et al., 2019).
Altogether, our work indicates that isoform switch is an important mechanism for gene expression alteration in AD and that genes associated with the splicing machinery in neurons could be interesting therapeutic targets to be exploited.
Data Availability
All data referred to in the manuscript is publicly available
Code availability
Gene expression summaries, alternative splicing summaries, and protein domains: https://diegomscoelho.github.io/AD-IsoformSwitch/
Financial support
This work was co-funded by the European Union under the European Regional Development Fund (ERDF) and by the Hauts de France Regional Council (contrat n°18006176), the MEL (contract_2016_ESR_05), and the French State (contract n°2018-3-CTRL_IPL_Phase2) to MRC. This work was also funded by the Lille Métropole Communauté Urbaine and the French government’s LABEX DISTALZ program (Development of innovative strategies for a transdisciplinary approach to Alzheimer’s disease) to JCL. DMC and LICC are supported by Coordenação de Aperfeiçoamento de Pessoal de Nível Superior (CAPES) scholarships.
Materials and Methods
Bulk RNAseq data from human control and disease banks
RNAseq datasets obtained from different brain regions were used (Mayo: Allen et al, 2016; MSBB: Wang et al, 2018; ROSMAP: De Jager et al, 2018). Metadata obtained from each study was used to classify patients into Control and Alzheimer’s disease groups. Datasets were downloaded from AMP-AD Knowledge Portal (https://www.synapse.org) following all terms and conditions to use the data. The brain area analyzed and the number of individuals per condition were the following: Mayo - Temporal cortex, which neuroanatomically subdivides into the inferior, middle, and superior temporal gyri (STG), and cytoarchitectonically can be subdivided into Brodmann areas (BM, instead of BA) 20/21/22/41/42 (Strotzer, 2009), N=160 subjects (82 AD and 78 controls); MSBB - BM22, which is part of the Wernicke’s area in the STG, N=159 subjects (98 AD and 61 controls); MSBB BM36, corresponding to the lateral perirhinal cortex, N=154 subjects (88 AD and 64 controls); MSBB BM10, corresponding to the anterior prefrontal cortex, N=176 subjects (105 AD and 71 controls); MSBB BM44, corresponding to the inferior frontal gyrus, N=153 subjects (90 AD and 63 controls); and ROSMAP - Dorsolateral prefrontal cortex (DLPFC), containing BM46 and part of BM9, N=423 subjects (222 AD and 201 controls). Unless stated otherwise, data obtained from different analyses were grouped in “temporal lobe” (TL) - Mayo, MSBB BM22 and MSBB BM26; or “frontal lobe” (FL) - ROSMAP, MSBB BM10 and MSBB BM44.
For single-cell RNA sequencing (scRNAseq) analyses, we used processed data obtained from the middle temporal gyrus (MTG), available at the Allen Brain Atlas consortium (https://celltypes.brain-map.org/rnaseq).
Realignment of human reads into single pseudo aligner pipeline
Using human GRCh38 cDNA release 94 (ftp://ftp.ensembl.org/pub/release-94) as reference, we built an index to align all our fastq files. Next, we used pseudoaligner Kallisto (Bray et al., 2016); version 0.43.1) with our pre-built index to align fastq files.
Differential gene expression analyses
Differentially expressed genes (DEGs) were identified using differential gene expression at transcript-level using DESeq2 R library (Love et al., 2014, 2019). To facilitate kallisto output import, transcript-level estimated counts, length and abundance was extracted using tximport function (Soneson et al., 2016). As described by Michael Love group, transcript-level differential gene expression enhances analysis resolution (Love et al., 2019). Using DESeqDataSetFromTximport, a DESeq2 object was created and filtered using rows with sum of all counts bigger than 10. Next, DESeq function was used with default values. Using the results function, we selected all genes with False Discovery Rate (FDR) < 0.01 and Fold Change (FC) > 1.3.
Differential Transcript Usage (DTU) analysis was performed using the R library IsoformSwitchAnalyzeR (Vitting-Seerup & Sandelin, 2019). Following pipeline instructions, kallisto abundance tables were imported using importIsoformExpression and importRdata functions to create a switchAnalyzeRlist object. Same cDNA release used in kallisto alignment and correspondent annotation (ftp://ftp.ensembl.org/pub/release-94/gtf/homo_sapiens/Homo_sapiens.GRCh38.94.chr_patch_hapl_scaff.gtf.gz) were applied as input. We filtered data using a gene expression cut off = 10, isoform expression cut off = 3, differential isoform fraction (dIF) cut off = 0.05 and removed single isoform genes. Although DEXSeq is recommended to test differential isoform usage, it does not work efficiently for large datasets (more than 100 samples; (Anders et al., 2012)). For that reason, we chose isoformSwitchAnalysisPart1 function using DRIMSeq (Soneson et al., 2016) to test differential transcript usage. Using part1 fasta files, all external analysis was performed and used as input to isoformSwitchAnalysisPart2 function. We used CPC2, Pfam, SignalIP and Netsurfp2 as indicated in the pipeline. Next, we performed a confirmation stage using stageR (Van den Berge et al., 2017) to generate isoforms overall false discovery rate (OFDR). We selected all isoforms with OFDR < 0.01 and dIF > 0.05.
To evaluate if intersections among different datasets were statistically relevant, we calculated the significance of overlap between every two sets using the hypergeometric test (phyper). Our universe set consists in genes with FDR < 0.1 within each dataset.
Single-cell RNAseq
Using R library seurat, we created a seurat object (CreateSeuratObject), normalized data (NormalizeData), found variable genes (FindVariableFeatures) and rescaled data using a linear model (ScaleData, use.umi = F). After that, we generated 50 PC’s (RunPCA) but only used 35 of them based on the PC’s visualization distribution (ElbowPlot). Since Allen data was already annotated, we only used tSNE (RunTSNE) to facilitate visualization. A group classified as “None” by Allen metadata were removed from our analysis. This strategy generated 7 main different cell types: Astrocytes, Endothelial cells, Glutamatergic Neurons, GABAergic Neurons, Microglia, Oligodendrocytes and oligodendrocyte precursor cells (OPCs). To assign genes to specific cell-types, we used the AverageExpression function. Using pct.exp bigger than 0.1, we created a list of genes that were expressed by each cell type.
Gene-set enrichment analysis (GSEA)
For gene ontology analysis, R library gprofiler2 was used. Using gost function, correction_method=“fdr’’ and significant=TRUE. To minimize the enrichment of gene ontologies based on small set of genes, we used three conditions for significance assessment: false discovery rate (FDR)<0.01; intersection size (intersection between gene set vs. number of genes in a term)>3; and precision (intersection size divided by gene set)>0.03. We used Gene Ontology (GO or by branch GO:MF, GO:BP, GO:CC), Kyoto Encyclopedia of Genes and Genomes (KEGG), Reactome (REAC), WikiPathways (WP), TRANSFAC (TF), miRTarBase (MIRNA), Human Protein Atlas (HPA), CORUM (CORUM), Human phenotype ontology (HP) as sources. For improved visualization, we plotted results only for GO:BP, GO:CC and KEGG and show only FDR for terms reaching all criteria of significance.
Selection of splicing-associated genes
To select splicing related genes, we searched for terms containing the words “splicing” or “spliceosome” in gProfiler bank (https://biit.cs.ut.ee/gprofiler/gost). Taking only GO and WP datasets, 25 terms and 441 genes related to those terms were selected (Supplementary table 8).
Selection of AD risk/causal genes
Late-onset AD risk genes were curated by Dourlen et al. (2019). Briefly, AD-associated loci were selected from genetic studies, mainly GWAS and WES [1–5, 7–25]. Genes in these loci were either indicated in the publications or determined based on the regional association plots provided in the publications assuming that the functional risk variants are located in the vicinity of the SNP producing the top signal and taking into account the linkage disequilibrium patterns and the recombination peaks within the loci of interest. Early-onset AD causal genes were APP, PSEN1 and PSEN2. The complete list of genes is described in the Supplementary Table 9.
Western blotting
Brain samples obtained from the frontal cortex (FCx) and hippocampus (Hip) of 3 non-pathology (two samples Braak II and one sample Braak IV) and 6 AD patients (all samples Braak VI) were lysed with RIPA buffer and sonicated at 100% during 10 seconds before use for the Western blotting analyses. The controls for BIN1 isoforms 1 (Iso1) and 9 (Iso9) were obtained using HEK cells transiently transfected with 1µg/ml DNA solution containing plasmids encoding for BIN1 isoforms mixed with the transfection reagent FuGENE HD (Promega) at the ratio 1:3. Cells were lysed using RIPA buffer 48h after transfection and frozen for further analyses.
Protein quantification was performed using the BCA protein assay (Thermo Scientific). 10– 20 μg of total protein from extracts were separated in SDS–polyacrylamide gels 4-12% (NuPAGE Bis-Tris, Thermo Scientific) and transferred to nitrocellulose membranes (Bio-Rad). Next, membranes were incubated in milk (5% in Tris-buffered saline with 0.1% Tween-20, TTBS; 1 h at RT) to block non-specific binding sites during 30min at RT, followed by several washes with TTBS. Immunoblotting was carried out with primary antibodies anti-BIN1 (Abcam, ab182562) and Anti-β-ACTIN (SIgma-Aldrich, A1978) for 1 h at RT on 20 RPM. The membranes were washed 3 times in TTBS, followed by incubation with HRP-conjugated secondary antibodies (Jackson, anti-Mouse 115-035-003; anti-Rabbit 111-035-003) overnight at 4°C on 20 RPM agitation. Immunoreactivity was revealed using the ECL chemiluminescence system (SuperSignal, Thermo Scientific) and imaged using the Amersham Imager 600 (GE Life Sciences). Optical densities of bands were quantified using “Gel Analyzer” plugin in Fiji (Schindelin et al., 2012).
Supplementary Figures

A,C,E) UpsetR and Venn Diagram illustrate intersection among different studies. B,D,F) Gene-set enrichment analysis (GSEA) with cell-type signatures. As a threshold for GSEA, FDR < 0.01, intersection size > 3 and precision > 0.03. Analyses were performed for glutamatergic neurons (A-B), GABAergic neurons (C-D) and astrocytes (E-F).

A,C,E) UpsetR and Venn Diagram illustrate intersection among different studies. B,D,F) Gene-set enrichment analysis (GSEA) with cell-type signatures. As a threshold for GSEA, FDR < 0.01, intersection size > 3 and precision > 0.03. Analyses were done for oligodendrocytes (A-B), endothelial cells (C-D) and microglia (E-F).

A) tSNE representation showing distribution of single cells in two dimensions; B) Donut plot indicating the percentage of cell types/subtypes among all groups with absolute number of cells. C) Dot plot showing the expression of some known cell type/subtype markers. D) Boxplot showing the average expression of the same genes. E) UpsetR showing the number of genes expressed in each cell type /subtype.

Graphic showing the percentage of genes UP (blue) and DOWN (yellow) regulated in both TL datasets (Mayo and MSBB_TL), as well as genes altered in discordant directions in these two datasets (grey). Observe that neurons have about half of the genes altered in each direction, whereas astrocytes, oligodendrocytes, microglia and endothelial cells have a predominance of up regulated genes.

A) Western blot for BIN1 and ACTIN in brain lysates obtained from the frontal cortex (FCx) and hippocampus (Hip) of non-pathology (n=3) and AD (n=6) individuals. Bands corresponding to isoforms 1 and 9 are indicated (Iso1 and Iso9, respectively). B-C) Quantification of total BIN1 normalized per ACTIN (B) and BIN1 isoform 1 normalized by the total BIN1 (C). ANOVA F(3,14)= 3.36 and p=0.0494 (B); F(3,14)= 16.24 and p<0.0001 (C); Tukey’s multiple comparisons test * Padj<0.05 and *** Padj<0.001. D) Western blot for BIN1 in brain lysates from one non-pathology subject (Hip and FCx) and HEK cells transfected with lentiviral vector carrying plasmids encoding for BIN1 isoforms 1 (Iso1) and 9 (Iso9). Observe the correspondence between the first and third band in the brain (lanes 1 and 2) with isoform 1 (lane 3) and 9 (lane 4), respectively.
Description of supplementary tables
Supplementary table 1. Summary statistics for DEG and DTU analyses
Supplementary table 2. GSEA for DEGs and gDTUs in the temporal lobe intersection (TLI)
Supplementary table 3. Summary statistics for DTU analysis in MSBB using Braak stages
Supplementary table 4. Expression of genes identified in DEGs and DTU analyses in different cell types/subtypes
Supplementary table 5. GSEA for DEGs and gDTUs in the TLI per cell type
Supplementary table 6. GSEA for DEGs identified in different cell types in previous single-cell RNAseq studies
Supplementary table 7. Expression of AD risk/causal factors in different cell types/subtypes
Supplementary table 8. List of splicing related genes used in this study and their corresponding ontology terms
Supplementary table 9. List of AD risk genes used in this study
Acknowledgments
We thank Charles Duyckaerts (Neuroceb, GIE Neuro-CEB BB-0033-00011) for providing the brain samples. We would also like to thank Dr. Tarciso Velho, Pierre Dourlen and Fabien Delahaye for reading and suggestions on the manuscript.
The results published here are in whole or in part based on data obtained from the AMP-AD Knowledge Portal (https://adknowledgeportal.synapse.org/). Study data were provided by the following sources: The Mayo Clinic Alzheimer’s Disease Genetic Studies, led by Dr. Nilufer Taner and Dr. Steven G. Younkin, Mayo Clinic, Jacksonville, FL using samples from the Mayo Clinic Study of Aging, the Mayo Clinic Alzheimer’s Disease Research Center, and the Mayo Clinic Brain Bank. Data collection was supported through funding by NIA grants P50 AG016574, R01 AG032990, U01 AG046139, R01 AG018023, U01 AG006576, U01 AG006786, R01 AG025711, R01 AG017216, R01 AG003949, NINDS grant R01 NS080820, CurePSP Foundation, and support from Mayo Foundation. Study data includes samples collected through the Sun Health Research Institute Brain and Body Donation Program of Sun City, Arizona. The Brain and Body Donation Program is supported by the National Institute of Neurological Disorders and Stroke (U24 NS072026 National Brain and Tissue Resource for Parkinson’s Disease and Related Disorders), the National Institute on Aging (P30 AG19610 Arizona Alzheimer’s Disease Core Center), the Arizona Department of Health Services (contract 211002, Arizona Alzheimer’s Research Center), the Arizona Biomedical Research Commission (contracts 4001, 0011, 05-901 and 1001 to the Arizona Parkinson’s Disease Consortium) and the Michael J. Fox Foundation for Parkinson’s Research. Study data were also provided by the Rush Alzheimer’s Disease Center, Rush University Medical Center, Chicago. Data collection was supported through funding by NIA grants P30AG10161 (ROS), R01AG15819 (ROSMAP; genomics and RNAseq), R01AG17917 (MAP), the Illinois Department of Public Health (ROSMAP), and the Translational Genomics Research Institute (genomic). For ROSMAP, additional phenotypic data can be requested at www.radc.rush.edu. And part based on data generated from postmortem brain tissue collected through the Mount Sinai VA Medical Center Brain Bank and were provided by Dr. Eric Schadt from Mount Sinai School of Medicine.
References


