
Abstract
Background The novel coronavirus (SARS-CoV-2) has rapidly evolved into a global epidemic. To control its spread, countries have implemented non-pharmaceutical interventions (NPIs), such as school or border closures, while others have even enforced a complete lockdown. Here we study the effectiveness of NPIs in reducing documented cases of COVID-19.
Methods We empirically estimate the impact of NPIs on documented COVID-19 cases in a cross-country analysis. A Bayesian hierarchical model with a time-delayed effect for each NPI allows us to quantify the relative reduction in the number of new cases attributed to each NPI. Based on this model, a cross-country analysis is performed using documented cases through April 11, 2020 from n = 20 countries (i.e., the United States, EU-15 countries, Norway, Switzerland, Canada, and Australia). Documented case numbers are selected because they are essential for decision-makers in the area of health-policy when monitoring and evaluating current control mechanisms.
Findings Based on our model, we compare the effectiveness of NPIs in the early stages of the outbreak. The closure of venues is associated with a reduction in the number of new cases by 33 % (95% credible interval [CrI] 16–47 %). The reduction is lower for work bans on non-essential business activities (28 %; 95% CrI 10–42 %) and border closures (26 %; 95% CrI 13–37 %). School closures yield a reduction of only 11 % (95% CrI 0–27 %) and its relative impact is one of the lowest among the various policy measures considered in this analysis.
Interpretation This cross-country analysis provides early estimates regarding the effectiveness of different NPIs for controlling the COVID-19 epidemic. These findings are relevant for evaluating current health-policies and will be refined as more data become available.
Funding Swiss National Science Foundation
Evidence before this study To control the current COVID-19 epidemic, several countries have implemented health-policy measures, i.e., non-pharmaceutical interventions (NPIs). Their intended effect is to steer people towards increased social distancing that will eventually reduce person-to-person transmission rates. Several studies have demonstrated the effect of NPIs through computational simulations. To obtain empirical evidence concerning the effectiveness of such measures, we searched PubMed and medRxiv using “coronavirus”, “COVID-19”, and similar terms through April 14, 2020. We identified several studies with observational data correlating health-policy measures and SARS-CoV-2 infection rates. These studies focus primarily on the novel coronavirus outbreak in China. However, none of the identified studies has provided empirical estimates regarding the effectiveness of NPIs on reducing new COVID-19 cases in a cross-country analysis. Hence, comparisons estimating the relative effectiveness have been lacking.
Added value of this study We estimate empirically the effect of NPIs on documented cases of COVID-19. For this purpose, we perform a cross-country analysis in order to identify which health-policy measures are (most) effective.
Implications of all the available evidence Not all health-policy measures are equally effective. This needs to be considered when authorities respond to the COVID-19 outbreak or when health-policy measures are lifted. Authorities should carefully evaluate the effectiveness based on empirical evidence, as several interventions come with substantial costs for society.
1. Introduction
The novel coronavirus that emerged at the end of 2019 (SARS-CoV-2) has evolved into a global epidemic 1. The coronavirus was first identified in Wuhan, China 2–10, but quickly spread across China and the rest of the world 11–14. As of April 8, 2020, the total number of confirmed cases of COVID-19, the disease caused by the coronavirus, exceeds more than 1.3 million worldwide and is following a path of exponential growth 1.
Efforts to control the spread of SARS-CoV-2 focus on non-pharmaceutical interventions (NPIs). These represent public health-policy measures that are intended to diminish transmission rates and, to this end, aim at reducing person-to-person contacts via so-called social distancing 15. Examples include school closures 16, bans on (mass) gatherings 17, travel restrictions 18,19, and even complete lockdowns (e.g., as in the case of France, Spain, and Italy). The impact of NPIs has been primarily studied through theoretical simulations 18–26. Inferences from observational data are primarily of a descriptive nature 14, focus on single country (i.e., China 27,28), or model death rates due to COVID-19 before and after the implementation of NPIs 29. In contrast, the impact of NPIs in reducing the new COVID-19 cases is unknown. Documented COVID-19 cases, however, are essential for decision-makers in health-policy when monitoring and evaluating the effectiveness of NPIs (e.g., controlling the outbreak in a way that surge capacities are not exceeded).
We estimate how NPIs are associated with changes in documented COVID-19 cases through April 11, 2020 across n = 20 countries (i.e., the United States, EU-15 countries, Norway, Switzerland, Canada, and Australia). This amounts to 1.4 million documented COVID-19 cases. Our estimation model allows us to quantify the relative reduction in the number of new cases attributable to each NPI, accounting for a time lag in the effect of each measure, and potential effects from day-of-the-week differences between countries.
2. Methods
2.1. Data on documented COVID-19 cases
We perform a cross-country analysis for n = 20 countries. The sample comprises the United States, EU-15 (Austria, Belgium, Denmark, Finland, France, Germany, Greece, Ireland, Italy, Luxembourg, the Netherlands, Portugal, Spain, Sweden, and the United Kingdom), Norway, Switzerland, Canada, and Australia. Our selection of countries defines a sample that follows a similar and comparable overall strategy in controlling the COVID-19 outbreak and shares a common cultural background. In particular, we exclude Asian countries despite the availability of excellent data, as these countries have often responded quite differently based on their experience with previous pandemics such as the 2013 SARS-CoV-1 outbreak. Nevertheless, the sample entails considerable variation across countries, as some countries have been affected severely, while others responded early as part of their mitigation strategy. Overall, the sample covers a population of ∼0.8 billion people.
SARS-CoV-2 infection figures for each country have been obtained from the Johns Hopkins Coronavirus Resource Center, which was developed to “track reported cases of coronavirus disease 2019 (COVID-19) in real time” 30 and directly aggregates cases recorded by local authorities in order to overcome time delays from alternative reporting bodies. Hence, these numbers are supposed to account for all COVID-19 cases identified on a specific day. Case numbers are collected through April 11, 2020. In total, our sample comprises approx. 1.4 million cases.
2.2. Data on health-policy measures
NPIs are systematically obtained from government resources and news outlets before being classified into seven categories (see Tbl. 1): (1) school closures, (2) border closures, (3) public event bans, (4) gathering bans, (5) venue closures (e.g., shops, bars, restaurants, and other recreational activities), (6) lockdowns prohibiting public movements without valid reason, and (7) work bans on non-essential business activities. Note that “border closures” represents a measure that is fairly severe in restricting international travel. The timing is encoded such that it refers to the first day a measure goes into effect. We only consider measures that have been implemented throughout a country or in at least 2/3 of the regions.
List of non-pharmaceutical interventions (NPIs), their definitions, and the number of countries that have implemented the respective NPI.
Overall, the measures vary across countries, especially in their order and the time lag between successive measures. Within the period of our analysis, school closures were implemented by 18 out of the n = 20 countries, lockdowns by 11 and work bans by 6 (Fig. 1). Details of NPIs are listed in the supplements.

(A) Heatmap showing the cumulative number of documented COVID-19 cases for each country until a non-pharmaceutical intervention is implemented. By reporting the cumulative number of cases, the heatmap highlights the ordering of health-policy measures within countries. If an NPI is not implemented by a country, it is colored gray. (B) Temporal development of cumulative cases for Italy, starting from 100 cases, with additional vertical lines referring to the points at which non-pharmaceutical interventions are enforced. The temporal development of cumulative cases for the other countries in the data is indicated by gray lines.
2.3. Overview of statistical analysis
We aim at investigating the effectiveness of different NPIs. The outcome of interest is the number of new COVID-19 cases per day. This choice reflects that the true number of new cases is unknown and, therefore, the documented numbers serve as the basis on which NPIs are monitored and evaluated by decision-makers in health-policy. In particular, case numbers must be controlled to an extent, so that surge capacities in critical care are not exceeded at the peak of the epidemic 24.
We assume the number of new cases of COVID-19 to be affected by which NPIs are implemented. We assume that NPIs can only influence new case numbers with a delay of t0 = 7 days. This is informed by prior research on SARS-CoV-2 transmissions, which indicate an incubation period of around 7 days 3,31 and, hence, we expect policy measures to affect the number of new cases with the same time delay. The impact of this assumption on the results is later studied as part of a sensitivity analysis.
The introduced model links the number of the new cases to the number of the existing cases. The estimated coefficient for each NPI quantifies the relative reduction in new cases. We report posterior means and, in the figures, depict the posterior distribution that refers to the 80 % and 95 % credible intervals (CrI). The model takes into account day-of-the-week effects as the frequency of testing may depend on the day of the week and reporting may be delayed to a higher degree during weekends. The model allows the constant rate of new cases to vary across countries as this rate depends on the (unknown) age composition of the true cases, the population density, and other country-specific factors. We exclude the very early phase up to 100 documented cases as we have to expect that each country had to establish its documentation practice in the early phase (however, we vary the cases at start as part of the sensitivity analysis). The model assumes the effect of each NPI to be equal in each country. The model further assumes implicitly that any change in the rate of new cases is due to one of the NPIs considered. To weaken this assumption, we also consider a variant whereby we allow for a decrease of the effectiveness over time, for instance, due to other unknown measures or an increasing general awareness of social distancing.
2.4. Model specification
Let Cr,d denote the number of documented cases in country r at day d. Then Nr,d = Cr,d+1 − Cr,d refers to the number of new cases in country r from day d to the next day. We model the number of new cases to follow a negative binomial distribution (NB), i.e.,
 with mean µr,d, variance
  , and an over-dispersion parameter φ. The mean is related to the actual number of cases of day d and the log of the rate of new cases,
  , via
, via

The log-rate is related to the policy measures, the day of the week, and the country via
Here αr is a country-specific effect reflecting the growth in cases for country r in the absence of any NPI, γw(d) are dummies for each day of the week,  is a time-delayed response function, and
  is the number of days since policy measure m took effect in country r. We model the time-delayed response function via a step function
 so that policy measures can only influence new cases with a delay of t0. We set t0 = 7 days, as detailed above. Additional variables are added as part of the robustness checks.
The model parameters are estimated by a fully Bayesian approach with weakly informative priors, except for restricting the effect parameters θm a priori to non-positive values (i.e., NPIs can only reduce the number of new cases). Details, including the computational approach, are given in supplements. We report for each measure m the posterior distribution of 1 − exp(θm), that is, the relative reduction in new cases.
2.5. Additional sensitivity analyses
Several sensitivity analyses are reported as part of the supplementary materials. (1) The preprocessing is changed such that we start our analysis from a cumulative case number of 10. (2) We vary the influence with which NPIs can affect the rate of new cases. Here we repeat the analysis with a delay (i.e., a lag) of t0 = 5 days and t0 = 9 days. We also consider the case whereby NPIs only become effective gradually. Specifically, we assume that NPIs have a linearly increasing effect between t0 and t1, and a constant effect after t1. (3) We consider the case of a general decrease in the rate of new infections on top of the effect of the individual NPIs. For this, the days since the start of the analysis (d) is included as an additional linear adjustment that can be common (i.e., a term β × d) or country-specific (i.e., a term βr × d). (4) The sensitivity of the coefficients to data from individual countries is assessed. For this, we performed leave-one out cross-validation, where the model is re-estimated without the left-out country.
Most sensitivity analyses indicate a small influence on the effect estimation. The only exception is adding the term β × d or βr × d. This is not surprising, as the joint effect of all measures is similar to an overall, gradual change over time; hence, we have to expect the observed diminishing of effects. The essential point here is that we still can see an effect of those NPIs with the largest impact.
3. Results
Using the data from the early stages of the outbreak until April 11, 2020, we compare different NPIs (Fig. 2). Our model estimates closing venues as being associated with the highest reduction in the number of new cases (33 %; 95% CrI 16–47 %). In terms of relative reduction, this is followed by work bans on non-essential business activity and border closures. These measures amount to a reduction of 28 % (95% CrI 10–42 %) and 26 % (95% CrI 13–37 %), respectively. With a small number of observations, it is difficult to obtain precise estimates for work bans. A similar behavior is observed for border closures, as documented by wide credible intervals. The similarities between the prohibition of public events and gatherings become evident in their estimates, amount to a reduction by 24 % (95% CrI 10–37 %) and 27 % (95% CrI 13–39 %), respectively. In comparison, school closures are linked to a reduction of only 11 % (95% CrI 0–27 %).

Shown is the estimated reduction (mean as circle) in the number of new cases (in %) for each non-pharmaceutical intervention (NPI). The 80% and 95% credible intervals are indicated by thick and thin lines, respectively.
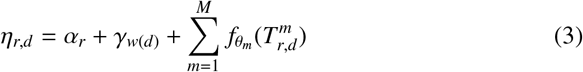
We illustrate the estimated impact of different interventions on new COVID-19 cases. For this purpose, we take the mean estimate of the corresponding NPI and predict the number of new cases if the NPI would not have been imposed, then comparing it to the observed number (Fig. 3). In this hypothetical setting, the number of new cases is subject to considerable growth. In contrast, the actual case count remains well below the hypothetical prediction. Taking the United Kingdom as an example, the case count predicted under no interventions quickly exceeds 20,000 new cases, while the observed number ranges below 10,000. NPIs with larger estimated effects result in higher number of new cases and, vice versa, NPIs with lower estimated effects result in lower number of new cases. Nevertheless, the impact of NPIs with lower estimated effects can be considerable when they are imposed early and their effect accumulates. Figures for all other countries are listed in the supplements.

Shown is the hypothetical effect of NPIs on the number of new cases. Specifically, it is illustrated how the mean estimated number of new cases would have changed if NPIs had not been imposed (stacked bars). The solid line refers to the actual and the dashed line to the estimated number of new cases based on the NPIs the corresponding country imposed. The NPIs are shown for the time period in which they were in force while considering that their effect is subject to a time delay of 7 days.
4. Discussion
4.1. Relevance for health-policy
NPIs have a substantial impact on society and entail immense economic costs. Hence, there is an urgent need to better understand the relative effectiveness of NPIs. A remedy is provided by our regression analysis. It attributes to what extent the rate of new cases is reduced due to the implementation of specific NPIs (or potentially a combination thereof). This is an attempt to obtain early insights, while further effort is necessary in order to arrive at definite answers.
Our analysis is designed so as to be of direct relevance for health-policy. To this end, a focus is placed on documented COVID-19 cases. Documented case figures are readily available and serve as the basis for decision-making in health-policy, specifically in order to control the epidemic so that the surge capacity in critical care is not exceeded. Thereby, we ensure that our estimates are directly transferable to health-policy design and evaluation. By providing empirical evidence regarding how new cases are influenced by different NPIs, our findings can serve as a blueprint for designing policies that are cost-effective. Other metrics (e.g., the effective reproduction rate or the serial interval) serve a different purpose, as they are primarily used to study epidemiological characteristics of how infectious diseases spread. Nevertheless, NPIs aim at reducing the infection rates and, hence, corresponding models can be an alternative means of understanding the impact of NPIs. Such models draw upon the true number of cases, yet which is unknown. Hence, following such approaches requires one to link these unknown numbers to observable measures by additional assumptions on the model specification, as done, for example, by Flaxman et al. 29. By directly modeling the impact on the observed number of new cases, we avoid this step. Still, domain knowledge from the realm of infection epidemiology informs our modeling in the form of prior knowledge concerning the incubation time of COVID-19.
4.2. Summary of results
In the estimation, data from n = 20 countries is used, out of which only 6 countries responded to the epidemic by enforcing work bans on all non-essential business activities. This explains the size of credible intervals in our estimation, especially for the NPIs with few observations. However, our objective is to provide early estimates that could inform health-policies. As more data become available, the estimates should also become more precise.
School closures restrict access to education with unwanted implications for members of society who are already underprivileged. As determined by our model, the mean effect size for school closures is among the lowest across the policy measures considered in this study. This finding is in line with prior literature in which the transmissibility of SARS-CoV-2 among children is regarded as comparatively small 16,26. The preceding argument also provides a possible explanation for why our model attributes only a small reduction of cases to this NPI. In contrast, the relative effect of closing venues is ranked among the top. This is an interesting addition to prior literature, in which this NPI has received rather little attention and thus deserves further investigation. Work bans are among the strictest measures and are attributed the second highest effect estimate. In contrast, our model suggests that lockdowns have only a small added value; however, lockdowns also entail a ban on public events and gatherings. When computing the combined effect of a lockdown with the latter two policy measures, the overall estimate is substantially larger.
For border closings, the posterior distribution is distinctly above zero. Theoretical simulations confirm that a rapid dissemination of SARS-CoV-2 was associated with large numbers of undocumented infections 11, especially if not prevented by travel restrictions 19. However, this measure should be interpreted with caution. It primarily targets international transmissions, which might be more pronounced in early stages of an outbreak as studied in this analysis. In the later stages of an epidemic, the effect might be substantially smaller, with this measure primarily steering international travelers or cross-border commuters towards increased social distancing.
4.3. Limitations
Our analysis is limited by the type of data utilized and by the need to make modeling assumptions. Using the number of documented cases implies that documentation practices may have an impact on the results. In particular, definitions and documentation practices may differ between countries and over time. However, as we are investigating the rate of new cases, many deviations from an optimal documentation practice will affect both the number of new cases and the number of existing cases in a similar manner and may thus cancel out. Short-term fluctuations are considered by including day-of-the-week effects and allowing for overdispersion. Moreover, we must assume that each country had to establish its documentation practice in the early phase of the outbreak, which is taken into account by excluding the very early phase up to 100 documented cases. However, there may still remain an undue influence of country-specific changes in documentation practice over time.
A further limitation arises from the lack of reliable information on the number of recovered cases, as it would facilitate in relating the number of new cases to the number of non-recovered cases. However, the focus of our study is the effect of NPIs in the early stages of the COVID-19 outbreak. During this period, the number of recovered patients is comparatively low relative to the overall population and, hence, we might be justified in neglecting this issue when analyzing the early stages of the outbreak. With respect to the true infection rate, theoretical simulations 24 suggest a stationary rate in the absence of NPIs for this early phase and, hence, independence from natural attrition phenomena.
Our modeling assumptions do not account for any interaction between countries and the effect of NPIs. The simplifying assumption of a common effect reflects our aim to estimate an “average” effect and the lack of power to investigate cross-country variation. The most crucial assumption seems to be the absence or presence of an additional change in the rate of new cases over time due to additional measures or general awareness. This is corroborated by the sensitivity analyses. However, even when allowing for such a change (see supplementary materials), we can still see some effect for the NPIs with the largest impact.
4.4. Outlook
Our findings draw upon data from the early stages of the COVID-19 outbreak. For instance, border closures might prevent SARS-CoV-19 infections from being imported 11,19, while their effectiveness is likely to change when domestic transmissions start to drive epidemic growth. Therefore, it is not clear to what extent NPIs are effective in the later stages of the epidemic. Several countries, which are still in the early stages of the epidemic, are faced with the prospect of implementing health-policies including transmission control measures. Other countries, especially in the developed part of the world, are on a path towards progressively relaxing existing measures. Future research could explore how transmission rates develop when NPIs are sustained for longer periods of time or when NPIs are lifted. Here the effect could point in different directions. On the one hand, people might have integrated social distancing into their daily routines and thus stick to them even after policy measures are lifted. On the other hand, people have postponed several activities with social interactions (e.g., visits to general physicians or shopping activities), which would take place after lifting. In addition, our sample is based on Western countries as their behavioral responses to NPIs should be fairly homogeneous, yet further research is needed in order to analyze to what extent the findings can be generalized to other countries.
Our objective is to provide timely estimates that could inform health-policies. With more data becoming available, we may be able to refine our estimates. However, as many countries have implemented most measures already several weeks ago, increasing the observation period is of little informativeness. Additional information may arise from taking the federal structure of some countries into account (e.g., the United States and Germany), from more detailed case data (e.g., recovery status or age), or from rescinding NPIs. It would be of great interest to use this additional information to also study inter-country variation of NPI impact (i.e., modeling country-specific effects of the NPIs) and to explain this variation through the lens of country characteristics. This would allow us to develop country-specific recommendations.
Data Availability
We collected data from publicly available data sources (Johns Hopkins Coronavirus Resource Center for epidemiological data; news reports and government resources for policy measures). All the public health information that we used is documented in the main text, the extended data and supplementary tables. A preprocessed data file is available with the codes.
Funding
NB, EvW and SF acknowledge funding from the Swiss National Science Foundation (SNSF) as part of the Eccellenza grant 186932 on “Data-driven health management”.
Competing interests
SF reports further grants from the Swiss National Science Foundation outside of the submitted work. JPS declares part-time employment at Luciole Medical outside of the submitted work. All other authors declare no competing interests.
Data availability
We collected data from publicly available data sources (Johns Hopkins Coronavirus Resource Center for epidemiological data; news reports and government resources for policy measures). All the public health information that we used is documented in the main text, the extended data and supplementary tables. A preprocessed data file is available with the codes.
Code availability
With publication, codes that support the findings of this study are available from https://github.com/mis-research/covid19_npi_effectiveness.
Contributions
NB contributed to conceptualization, data collection, data analysis, results interpretation and manuscript writing. EvW contributed to data collection, data analysis and manuscript writing. AS contributed to data analysis and manuscript writing. BK, AC, PB, and JPS contributed to data collection. DT contributed to results interpretation. WV contributed to conceptualization, data analysis, results interpretation and manuscript writing. SF contributed to conceptualization, results interpretation and manuscript writing.
Acknowledgements
We acknowledge feedback from the ETH COVID-19 Task Force.


