
ABSTRACT
Background Clinical data suggest that BMI and gestational weight gain (GWG) are strongly interconnected phenotypes, however the genetic basis of the latter is rather unclear. Here we aim to find genes and genetic variants which influence BMI and/or GWG.
Methods We have genotyped 316 type 1 diabetics using Illumina Infinium Omni Express Exome-8 v1.4 arrays. The GIANT, ARIC and T2D-GENES summary statistics were used for TWAS (performed with PrediXcan) in adipose tissue. Next, the analysis of association of imputed expression with BMI in the general and diabetic cohorts (Analysis 1 and 2) or GWG (Analysis 3 and 4) was performed, followed by variant association analysis (1Mb around identified loci) with the mentioned phenotypes.
Results In Analysis 1 we have found 175 BMI associated genes and 19 variants (p<10−4) which influenced GWG, with the strongest association for rs11465293 in CCL24 (p=3.18E-06). Analysis 2, with diabetes included in the model, led to discovery of 1812 BMI associated loci and 207 variants (p<10−4) influencing GWG, with the strongest association for rs9690213 in PODXL (p=9.86E-07). In Analysis 3, among 648 GWG associated loci, 2091 variants were associated with BMI (FDR<0.05). In Analysis 4, 7 variants in GWG associated loci influenced BMI in the ARIC cohort.
Conclusions Here, we have shown that loci influencing BMI might have an impact on GWG and GWG associated loci might influence BMI, both in the general and T1DM cohorts. The results suggest that both phenotypes are related to insulin signaling, glucose homeostasis, mitochondrial metabolism, ubiquitinoylation and inflammatory responses.
INTRODUCTION
In the recent years, a significant attention was paid to transcriptomic-wide association studies (TWAS), which enable the prediction of gene-level associations between the ‘imputed expression based on genetic data’ and complex phenotypes (Gamazon et al., 2015). This is possible, since it was shown that a proportion of GWAS risk variants co-localize with genetic variants, which regulate gene expression (i.e. expression quantitative trait loci, eQTL) (Hormozdiari et al., 2016). The prediction of gene expression based on genotype removes the noise created by environmental factors as well as the potential reverse causation (when the trait affects gene expression), therefore the TWAS analysis not only increases the statistical power, but also enables to focus on regions for which finding a functional interpretation of the associations is often easier (B. Li et al., 2018; Mancuso et al., 2017).
Gestational weight gain (GWG) has been extensively studied over the last several years as it was suggested that it’s inadequacy may lead to adverse both maternal (preeclampsia, hypertension, obesity later in life, cesarean section) and neonatal (preterm birth, stillbirth, inadequate neonatal weight – small or large for gestational age, obesity later in life) outcomes (Influ. Pregnancy Weight Matern. Child Heal., 2007; Kominiarek & Peaceman, 2017; Voerman et al., 2019). Simultaneously, clinicians tried to optimize pregnancy care for women with type 1 diabetes whose pregnancy outcomes (including developmental abnormalities, spontaneous abortions, neonatal hyperglycemia, neonatal hyperinsulinemia, maternal retinopathy, maternal nephropathy, preeclampsia) are far worse than in women from the general population (Celia et al., 2016). For a long time it was believed that it stemmed from maternal hyperglycemia, however, even though glycemic goals for these women have been achieved (HbA1c < 6.0%) still large for gestational age (LGA) or macrosomic neonates are born more frequent than in general population (Bashir, Naem, Taha, Konje, & Abou-Samra, 2019; Dori-Dayan et al., 2020; Scifres, Feghali, Althouse, Caritis, & Catov, 2014). Thus, there must be other potential contributors to adverse maternal and fetal outcomes (Mastella et al., 2018; Rys, Ludwig-Slomczynska, Cyganek, & Malecki, 2018; Secher et al., 2014). Among them are also those which affect the general population - maternal body lipids, pre-pregnancy BMI and GWG (McWhorter et al., 2018).
Even though GWG can have an impact on the health of future generations, to date, most of the performed studies are retrospective or observational and their main goal was to assess the relationship between GWG and environmental factors (Nunnery, Ammerman, & Dharod, 2018; Siega-Riz, Bodnar, Stotland, & Stang, 2020), while the genetic risks for inadequate GWG have been scarcely analyzed. In a recent paper, the authors show that 43% and 26% of the variation in GWG can be explained by genetic factors in the first pregnancy and second pregnancy, respectively (Andersson et al., 2015). The first GWAS study on GWG in the general, multiethnic cohort was performed in 2018. The study has shown that 20% of the variability in GWG can be explained by maternal genetic variants. Unfortunately, it did not find significant associations of GWG with any genomic loci (Warrington et al., 2018).
Since, both environmental and genetic data show that there is a correlation between pre-pregnancy BMI and GWG (Luecke et al., 2018) we took the TWAS approach to study the genetic correlation between BMI and GWG - in particular, to find loci and variants which are associated with GWG and BMI, or (on the contrary) only with GWG. We find this particularly important, as the reports on the overlap of genes and/or variants which influence both phenotypes appear to be conflicting (Kawai, Nwosu, Kurnik, Harrell, & Stein, 2019; Lawlor et al., 2011).
In this study, we aimed to investigate the genetic factors associated with GWG from the perspective of the genetics of obesity. To this aim, we performed TWAS analyses on the GIANT cohort representing the general population and two diabetic cohorts - T2D-GENES and ARIC to find genes associated with BMI. The ARIC and T2D-GENES cohorts were used since diabetes mellitus itself might influence BMI and creates a special metabolic context, while no cohort with patients with type 1 diabetes was available. Only regions which were associated with BMI in these cohorts were subjected to the analysis of association with GWG in T1DM patients. Secondly, we also searched for reverse associations and checked whether genes in TWAS associated with GWG in T1DM cohort might affect BMI in ARIC or GIANT cohorts. If so, we decided to search for genes which imputed expression correlated with BMI in order to restrict the analysis of genetic association with GWG to these genes only and conversely, to check whether the genes which correlate with GWG (at the imputed expression level) do influence BMI. Thus, this work comprises 4 different analyses, as presented in Figure 1.

The scheme of the workflow. TWAS analyses to find genes associated with BMI in the general cohort (GIANT) and two diabetic cohorts (T2D-GENES, ARIC) as well as with GWG in T1DM cohort, followed by variant associations between the two phenotypes.
METHODS
Patients
Patients were recruited either in Department of Metabolic Diseases University Hospital in Krakow or in Division of Reproduction Department of Obstetrics, Gynecology and Gynecological Oncology, Poznan University of Medical Sciences. All patients enrolled in the study were women with type 1 diabetes (T1D) and treated with insulin. Pre-pregnancy weight was based either on women self-report or weight measurement (if the women were/was under antenatal care). Only singleton pregnancies were included. Pregnancies that resulted in a miscarriage or stillbirth were excluded. Total GWG was defined as the difference between last gestational weight before delivery and pre-pregnancy weight. Whole blood samples were drawn and stored at -80C. This study was approved by the Bioethical Committees of the Jagiellonian University and Poznan University of Medical Sciences and performed according to the Helsinki Declaration. Written informed consent was collected from all patients.
Genotyping
DNA was extracted from whole blood with the use of automated nucleic acid extraction system Maxwell (Promega). Five hundred twenty-seven samples were genotyped on Illumina Infinium Omni Express Exome-8 v1.4 arrays. Only in term life births with information regarding age, pre-pregnancy BMI, GWG, diabetes duration, treatment method and daily insulin dose available were included in the final analysis.
Data processing and imputation
The detailed protocol of the data processing, QC analysis and imputation is presented in (Ludwig-Slomczynska et al., 2018).
Genotype Data and the analysis of genetic variants
The GWAS analysis on the T1DM cohort was performed on a group of 316 females with complete data on: age, parity, insulin dose prior pregnancy, pre-pregnancy BMI and GWG. The mixed-effects model approach was used as implemented in the package GENESIS in R. The random effect was associated with the individual ID and the genetic relatedness matrix was estimated via the PCARelate method in package GENESIS in R. The ‘null’ mixed effects model was considered as:

where the OriginOfSample is an indicator of the sample being collected in Division of Reproduction Department of Obstetrics, Gynecology and Gynecological Oncology, Poznan University of Medical Sciences. To the aim of testing significance of the (additive) effect of the genotype the Wald’s test statistics was used.
The summary statistics for BMI tested in the GIANT Consortium cohort were downloaded from https://portals.broadinstitute.org/collaboration/giant/images/1/15/SNP_gwas_mc_merge_nogc.tbl.uniq.gz
The genotype and phenotype data for the ARIC cohort (GENEVA study) were accessed via dbGaP. As far as the genotype data is concerned, the imputed data for participants of European ancestry were used as deposited under the phg000248.v1 code. Per-chromosome genotype probability data were transformed to dosages. From these dosages, genotype relatedness matrices were estimated on a per-chromosome basis and merged with the aid of the SNPRelate package in R. For the GWAS analysis the GENESIS package was used. As far as the phenotype files are concerned, these were accessed under the phs000090.v3 study code. The ‘null’ mixed effects model was defined as:

As GENEVA is a longitudinal study, for diabetic participants, we used the BMI and age measurement at the first time when the status of the participant was ‘diabetic’, whereas for the non-diabetic participants we used the measurements at the study entry.
The T2Dgenes genotype files were accessed via dbGaP under the phg000573.v1 code. The raw vcf files were transformed to dosages prior analysis. The phenotype data were accessed from the phs000462.v2 study code. Similarly to the data analysis in the ARIC cohort, we recorder BMI and age at the first time when the diabetic status was positive or at the study entry, otherwise.
The TWAS analysis was performed via the PrediXcan and MetaXcan software with Adipose as the tissue of interest. For the GIANT Cohort data, the MetaXcan framework was implemented based on the GTEx.v7 models. For the ARIC, T2Dgenes and T1DM cohorts the PrediXcan software was used also with GTEx.v7 models. In the TWAS analyses in the ARIC and T1DM cohorts the same independent variables were used as with the GWAS models defined above – with the exception that the classical linear models were used as implemented in the limma package (with no random effects). For the T2Dgenes TWAS analysis, from the ‘predicted expression’ matrix the principal components were first estimated and the first component was added to the models as it did not correlate with any independent variable – and it differ between families (as tested with the Kruskal-wallis test). As before the target analysis in the T2Dgenes cohort was performed with the aid of linear models as implemented in the limma package.
The FUMA analysis was performed through the webserver at fuma.ctglab.nl
The COJO and fast-BAT software were used as implemented by in the GTCA framework. The LD structure was estimated via the 1000 genomes data.
GO enrichment analysis was performed as implemented in the topGO package in R.
RESULTS
Gestational weight gain analysis in T1DM cohort
Our analysis comprised 316 women with T1DM for whom full phenotype data were available. The basic characterization of patients included in the analysis is presented in Table 1.
The clinical characteristics of the T1DM cohort.
PrediXcan was used to impute gene expression in subcutaneous and visceral adipose tissue based on imputed genotype data and the gene-based search for associations with GWG and BMI was performed using a linear model approach. Due to small cohort size, genes nominally significantly associated with GWG (442 genes in subcutaneous and 328 in visceral adipose tissue) and BMI (416 genes in subcutaneous and 326 in visceral adipose tissue) were considered for further analysis. It is worth noting that only sixty genes overlapped between the two phenotypes (Table S1). We further explored this phenomenon by looking at the strength of the association between gene expression for these two traits. We found a negative correlation between logFCs of genes associated with GWG and BMI. This is consistent with clinical recommendations as patients with high pregestational BMI are advised to restrict their GWG, however, we believe that the genetic background might also play a role.
PrediXcan analysis on BMI in the general population (GIANT cohort) and variant associations with GWG in T1DM cohort - Analysis 1
Gene expression prediction in visceral and subcutaneous adipose tissue in the GIANT cohort (234069 patients, (Locke, Kahali, Berndt, Justice, & Pers, 2015)) as performed using PrediXcan software. One hundred seventy-five genes significantly associated (p < 1E-04) with BMI in the adipose (subcutaneous and visceral combined) tissue were found (Table S2). The Venn diagram of genes which affected BMI, GWG or both phenotypes is presented in Table S3. Only 15 genes influenced both phenotypes, 160 influenced only BMI, while 633 had an impact on GWG only (Figure 2).

Venn diagram of the association of imputed gene expression which influence BMI in the Giant cohort, GWG in T1DM cohort and both phenotypes.
We further analyzed the loci of interest and searched for variants (within the 1Mb window around the gene) which influence BMI and/or GWG. We first mapped variants in 175 BMI associated genes (+/-500000 bp) and applied these restricted variant panels to the analysis of the association with GWG in the T1DM cohort. We filtered the results by MAF < 5% and p-value < 1E-04 and found an association with GWG for 19 variants in the T1DM cohort (Table 2).
The list of variants localized to genes associated with BMI in the GIANT cohort which associate with GWG.
The FUMA GWAS method further prioritized the variants obtained in the analysis. Twelve leading SNPs were detected. Three of them (rs7564856, rs11465293 and rs7961894) were associated with several traits in GWAS Catalog, mainly blood parameters, but, none significantly with metabolic outcome. At the same time however, these were also associated at the level of significance p-value < 1E-03 with LDL cholesterol levels, nonalcoholic fatty liver disease, body mass index, mean arterial pressure or metabolite levels. These variants were eQTLs for 40 genes in several tissues, while rs9659938, rs11807240, rs2136682 (NEXN, NEXN-AS1), rs7564856 (SPEG), rs9352745 (SH3BGRL2), rs13340504 (CCL24), rs11465293 (CCL24), rs886131 (RPL29P25) influenced gene expression in both subcutaneous and visceral adipose. Thus, we conclude that there is a subset of genes which influence both BMI and GWG as well as genetic variants associated with GWG which co-localize to these loci.
Next, we tried to determine, whether the signals for the two traits in the genes of interest are correlated, thus we checked whether the genetic variants associated with BMI and GWG are in linkage disequilibrium or they belong to different haplotypes. We performed the analysis of LD for all genes with variants significantly associated with GWG, however, below we present only the most interesting examples. In the gene GPN3, we have found 2 bins of eQTLs which are not in LD either with BMI or GWG variants. Variants associated with BMI also create a cluster, which is separate from a small cluster of 2 variants associated with GWG. One of GWG associated variants (rs876373) is in moderate LD with the BMI cluster (Figure S1a). In another gene, PMS2P3, we found a cluster of 3 variants which are associated with GWG, all in LD with one eQTL (rs707395). At the same time, variants associated with BMI form a separate, bin which is in moderate LD with a subset of eQTLs for this gene. This cluster is not in LD with the GWG bin or rs707395 (Figure S1b). The third example is the STAG3L1 gene in which three clusters - GWG associated variants, BMI associated variants and eQTLs can be seen (r^2), however, in each, few members of any cluster are in LD with members of other clusters (D’) making them rather dependent on each other (Figure S1c).
PrediXcan analysis on BMI in the diabetic cohorts (ARIC and T2D-GENES) and variant associations with GWG in T1DM cohort - Analysis 2
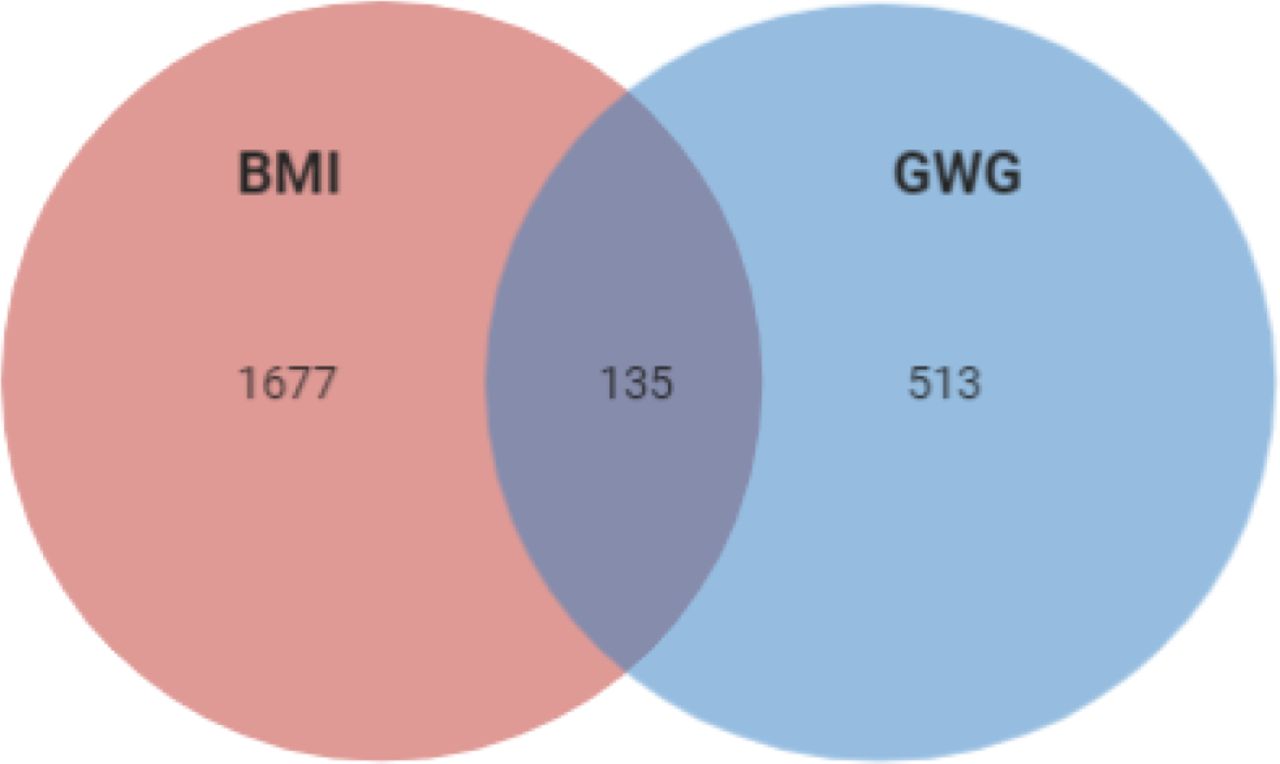
Since it is known that diabetes and its treatment might impact BMI, we searched for variants that might affect BMI in the context of diabetes status. Since no T1DM cohort was available, we used T2D patients’ cohorts – T2D-GENES (590 patients) and ARIC (8746 patients) (being aware that the two phenotypes obesity and diabetes are interconnected and T2D patients are predisposed to obesity, while T1DM patients not). After adjusting for diabetes, we found that 1812 genes were associated with BMI p < 0.05 (Table S4). Among them 135 influenced both phenotypes, 1677 influenced only BMI and 513 influenced GWG (Table S5, Figure 3).

Overlap of the correlation of imputed expression of genes which influence BMI in ARIC and T2D-GENES cohorts, GWG in T1DM cohort and both phenotypes.
Again, we mapped variants to 1812 BMI associated genes (+/-500000bp) and used this panel to look for associations with GWG in T1DM cohort. When filtered by MAF < 5% and p-value < 1E-04 the analysis has shown that GWG correlates with 207 variants (Table S6). Table 3 shows 20 variants which were significant at the level of p-value < 1E-05.
The list of variants localized to genes associated with BMI in T2D-GENES and ARIC cohorts which associate with GWG.
Most of the variants which influenced both GWG and BMI (p-value < 1E-05) were eQTLs associated with the expression of 13 genes (LRRFIP2, MLH1, GOLGA4, CCL26, RHBDD2, AC004980, POR, CCL26, GTF2IRD2, UPK3B, ART2P, LINC00974, KTP15, KRT17) in 14 tissues (Thyroid, Skeletal Muscle, Whole Blood, Artery, Cultured Fibroblasts, Tibial Nerve, Testis, Skin (Unexposed), Visceral Adipose Tissue, Minor Salivary Gland, Small Intestine, Colon, Brain (several regions).
FUMA analysis showed that among variants significant for association with GWG (p-value < 1E-04), 18 were listed for associations with multiple phenotypes in the GWAS Catalog. The KEGG analysis showed enrichment for autoimmunological disease systemic lupus erythematosus (adj. p-value = 3.32E-7) and taste transduction (adj. p-value = 2.18E-2). In the molecular functions GO enrichment analysis we found these variants to be responsible, among others, for carbohydrate binding (adj. p-value = 3.15E-8), bitter taste receptor activity (adj. p-value = 4.51E-5), trace amine receptor activity (adj. p-value = 9.69E-5) and taste receptor activity (adj. p-value = 9.04E-4) (FigureS2).
Finally, when comparing the lists of variants obtained in Analyses 1 and 2, we found a significant overlap, what supports our hypothesis that loci associated with BMI, both in the general population and diabetic cohorts may also associate with GWG. Several SNPs - rs7564856 (SPEG), rs1541725 (AC009502.4), rs9347707 (PCARG), rs4329088 (PCARG), rs1978202 (CCL26), rs13340504 (CCL24), rs11465293 (CCL24), rs11037234 (RP11-111A24.2), rs876373 (RPL29P25), rs886131 (RPL29P25), rs7961894 (WDR66), rs4808209 (ZNF101) were found to influence GWG in T1DM, ARIC, T2D-GENES and GIANT cohorts. We conclude, that despite the relatively large overlap between traits at the gene level, the genetic variants which localize with these loci most often are linked to a single phenotype only.
Next, we aimed to study the “reverse association” - i.e. we asked whether genes associated with GWG influence BMI as well.
PrediXcan analysis on GWG in T1DM cohort and variant associations with BMI in the general population (GIANT cohort) - Analysis 3
Variants were mapped to 648 GWG associated genes (+/-500000 bp) (Table S1) and a search for associations with BMI in the GIANT cohort was performed. Among 394149 variants analyzed, 2091 were significantly associated with BMI (at FDR < 0.05). These significant SNPs encompassed 0.53% of the whole list of variants analyzed. In comparison, the significant SNPs in the analysis of BMI in the GIANT cohort make up 0.41%, what means that genes which influence GWG are significantly enriched in the association test for BMI.
We used the FUMA tool to prioritize these 2091 variants. Twelve lead SNPs and 12 genomic risk loci were found. Not surprisingly, the GWAS Catalog analysis has shown a significant enrichment for genes associated with BMI, body fat distribution, attendance to gym or sport groups, sleep duration, height, lipoprotein levels, low HDL-level cholesterol etc. as presented in Figure 4 and Table S7.

The enrichment analysis of variants localized to genes associated with GWG among those associated with BMI in the GIANT cohort.
Thus, we find a significant enrichment of variants associated with BMI in the general population within loci associated with GWG.
PrediXcan analysis on GWG in T1DM cohort and variant associations with BMI in the diabetic cohort (ARIC) - Analysis 4
A GWAS analysis on BMI in the ARIC cohort was performed. Due to a large number of variants in the analysis we searched for lead SNPs using LD score regression. COJO analysis has returned 15 variants statistically significantly associated with the trait of interest (Table 4A).
The list of variants localized to genes associated with BMI (A) and GWG (B) in ARIC cohort.
Only 4 variants from this list were in GWG associated genes in PrediXcan, three of which overlapped with those associated with BMI (Table 4B). None of the variants were reported in GWAS Catalog or PheWas for the association with any trait. 6 variants were eQTLs - two for genes in which they were localized rs13359900 and rs73419031 for MCTP1 and SOX6, respectively; rs144768710 for ATP5G3, rs74036632 for ZFHX2-AS1, rs4131847 for HSPB8, while rs34427781 for several genes all localized 200000bp upstream or downstream from the variant.
Since the COJO analysis was performed on loci associated with GWG (+/-500000bp around the gene), it was possible that the most important variants influencing BMI were located outside those windows. Thus, we used a different tool, fastBAT, to find genes associated with BMI. The analysis revealed 8 genes which nominally associate with the trait of interest (Table 5).
The list of variants localized to genes associated with BMI in ARIC cohort and associated with GWG as shown by fast-BAT.
Again, none the of variants was previously mentioned to be significantly associated with any trait in GWAS Catalog or PheWas. Two were eQTLs - rs6563700 for LHFPL6, while rs12027661 for CAMK2N1.
DISCUSSION
In this work we performed TWAS as well as single variant associations to determine the loci related to GWG and/or BMI. About 15% of loci overlap between BMI and GWG at the TWAS level. In the general population (GIANT cohort) the pathway analysis has shown that loci which contribute to both phenotypes affect mainly energy metabolism. Among the enriched pathways are regulation of mitochondrion (GO:1903749, GO:1903747, GO:0010822, GO:0070585, GO:0010821, GO:0006839) and Golgi apparatus (GO:0051683, GO:0048313, GO:0051645). There are also few pathways which affect transcription, polyadenylation or methylation of RNA (GO:1903311, GO:0016071, GO:1900363, GO:0080009). The analysis of the loci which TWAS associates with GWG only leads to necrosis (GO:0070266, GO:0097300, GO:0070265), protein kinases signaling (GO:0046330, GO:0043507, GO:0032874, GO:0070304, GO:0043506, GO:0007256) and metabolism of sugars (GO:0034033, GO:0034030, GO:0033866,GO:0009226). The BMI associated loci enrich cell cycle progression pathways (GO:0010972,GO:1902750) host to pathogen signaling (GO:0043921, GO:0052312, GO:0052472) and macromolecule metabolism (GO:0010604, GO:0034641, GO:0006139, GO:0009308, GO:0046483) and insulin signaling (GO:0046626, GO:1900076). The results of the GO enrichment analysis are presented in Supplementary Table S8 and Figures S3a, b.
The analysis of the overlap between BMI and GWG associated loci in the ARIC cohort and T1DM cohort respectively showed enrichment in the TGFβ signaling pathway (GO:0071559, GO:0071560), regulation of stem cell differentiation (GO:1901532, GO:1902036, GO:0060218, GO:2000736) and polyol pathway (GO:0019751, GO:0046173). Pathways associated with GWG were similar to those enriched in general population, however the important contribution of genes which affect antigen presentation could be seen (GO:0002495, GO:0002504, GO:0019886). The pathways characteristic for BMI associated loci were very much involved into response to environmental stimuli i.e. temperature (GO:0009266, GO:0009408), oxygen levels (GO:0070482, GO:0001666, GO:0036293) and sensory perception (GO:0050954, GO:0007600). The results of the GO enrichment analysis are presented in Supplementary Table S9 and Figures S4a, b.
At the genetic variant level, we detected SNPs in BMI associated loci which are related to GWG, and variants associated with both GWG and BMI (Analysis 1). At the same time, we performed a similar analysis with diabetes adjusted BMI and GWG, which led us to congruent findings (Analysis 2). These results point us towards inflammatory response, TGFβ signaling, ER stress and glucose homeostasis. Subsequently, we investigated the association of SNPs in loci which influenced GWG (based on TWAS) with BMI and found 2091 variants in the GIANT cohort (Analysis 3). A parallel analysis was done on diabetes adjusted BMI (in the ARIC cohort) – resulting in 15 variants localized to GWG associated loci (Analysis 4). The results of these analyses show an impact of lipid biosynthesis, appetite regulation, Ca2+ homeostasis (and ER stress) and inflammatory response on obesity. Our results point to the source of the genetic correlation between GWG and BMI and confirms the interconnection of the phenotypes. We compared the results of our gene focused analysis with GWAS on GWG published in 2018 (Warrington et al., 2018); even though variants from the discovery cohort did not replicate, their potential functional roles overlap with those found in our study. TMEM163 is one of the best known genes associated with obesity, LCORL was shown to associate with height, UGDH with TGFβ signaling, HLA-C with autoimmune response, HSD17B3 with fatty acids, GLRX3 with oxidative stress, RBM19 with ribosomal biogenesis, SYT4 with Ca2+ binding and pancreatic functioning, PSG5 with pregnancy development, while NTS4 with neutrophilin signaling pathway. Our results are also congruent with those obtained in the computational search for functional annotation of 445 loci associated with obesity (Cheng et al., 2018). Therefore, we hypothesize that a further search for clinical phenotypes which affect GWG might allow identification of other loci that associate with it. Below we shed more light on the biological interpretation of our results and links between them (Fig. 5, 6).

The schematic representation of pathways(blue) affected by genes which variants associate with GWG (pink).

Genes which variants associate with GWG (pink) and that were reported to affect glucose levels or TGFβ signaling (blue).
In analyses 1 and 2, the strongest association with GWG was observed for SNPs in chemokine receptor ligands - rs1978202 – CCL26 and rs13340504, rs11465293 - CCL24. Apart from variants located in these genes we identified several other (rs4742339, rs4796675, rs11235519) which serve as eQTLs for them. Chemokines are chemoattractant with the proinflammatory role. Their receptor expression was shown to correlate with BMI (being higher in obese individuals) (Ignacio, Gibbs, Lee, & Son, 2016) and BMI changes (decreased after bariatric surgery) (Gentili et al., 2016). CCL26 is also involved in adipose tissue beiging in response to cold (Finlin et al., 2017). At the same time, we find three variants rs9659938, rs11807240, rs2136682 associated with GWG in the NEXN gene (or serving as eQTL for it) also involved in the inflammatory response. Of note, the augmentation of NEXN antisense RNA (NEXN-AS1) inhibits TLR4 oligomerization and NFκB activity and leads to suppression of proinflammatory response (Hu et al., 2019). NEXN is also known for its abundant expression in striated muscles (Zhu et al., 2018) and cardiomyocytes; its expression is higher under high glucose conditions (Barbati et al., 2017) (Figure 5).
Interestingly, we find GWG associated variants in genes involved in TGFβ signaling: SPEG, LINC000974, GIPC2. The GIPC2 gene (rs2136682 of which associates with GWG), belongs to the GIPC family known for regulating proliferation, cytokinesis or migration and involved in the trafficking of various transmembrane proteins. GIPC1 is necessary for cell-surface expression of transmembrane receptors, such as IGF1R and TGFβR3 (Katoh, 2013; Song et al., 2016). The inhibition of LINC000974 leads to TGFβ secretion and repression of phosphorylated SMAD2 expression (Fang et al., 2019; Tang et al., 2014). Both TGFβ and SMADs are involved in insulin expression and signaling; SMAD4 deficiency was shown to improve glucose tolerance and glucose induced insulin release (Lin et al., 2009). Of note, three GWG associated variants (rs9690213, rs9393623, rs1978202) are eQTLs for LINC000974 and four (rs8080053, rs1978202, rs4796675, rs8080053) are located in the gene itself (Figure 6).
The rs7564856, negatively associated with GWG is located in SPEG, and its expression is significantly greater in endurance than power athletes (Kusić et al., 2020). Also, at the protein level, SPEG differs between muscles of high-response vs low response rat trainers. The coimmunoprecipitation experiment with SPEG in the former showed a significant number of proteins involved in JNK and TGFβ signaling (Kusić et al., 2020), which, as said before, is known to influence insulin signaling and ER stress response (Z. Liu et al., 2019) (Figure 4, 5).
Two other variants - rs9347707 and rs4329088 - located in PACRG1 gene, known to be involved in the insulin pathway. In C. elegans PACRG mutants have reduced insulin signaling. Also, PCARG plays a key role in the regulation of mitophagy (Stephenson et al., 2018) and ubiquitynylation (Loucks et al., 2016), its knockout leads to defective NFκB signaling (Meschede et al., 2020) and CHOP upregulation (Han et al., 2017), which in adipose tissue result in increased proinflammatory macrophage polarization (M1) and insulin resistance (Suzuki et al., 2017). Thus, we note that PACRG is also involved in ER stress. The RHBDD2 gene is also involved in this biological process, with six eQTLs (rs4742339, rs11235519, rs1978202, rs13340504, rs4796675 and rs13340504) associated with GWG. It is worth noting that silencing of RHBDD2 leads to increased expression of ATF6, IRE1, PERK, CRT, BiP, ATF4 and CHOP (32) (Figure 4).
The association of rs72849841 (in RNF213) with GWG draws our particular attention. Namely, in Akita mice (which develop diabetes spontaneously) the knockout of RNF213 lowers glucose tolerance by 20% and leads to increased insulin contents in pancreases (by 150%) compared to wild type animals. This is obtained via the inhibition of ubiquitinoylation (RNF213 is a ubiquitin ligase) as shown by the 30% lower percentage of CHOP positive B-cells (Kobayashi et al., 2013). The depletion of RNF213 protects cells from lipotoxicity (Piccolis et al., 2019), reduces palmitate-induced cell death and modifies non-mitochondrial oxygen consumption rate. Moreover, RNF213 is targeted to lipid droplets, which are specialized for neutral lipid storage and increases their abundance and stability in cells through the elimination of adipose triglyceride lipase (ATGL) (Sugihara et al., 2019). It is interesting to note, that the latter is also negatively regulated by insulin (Kershaw et al., 2006). RNF213 variants in GWAS analyses suggestively associated (p-value ∼E-03) with diabetic polyneuropathy, portal hypertension, diabetic retinopathy and abnormal glucose (Figure 4). Its expression differed between cyclic and pregnant heifers (Forde et al., 2012).
We identified GWG associated loci involved in glucose homeostasis or pancreatic functioning (Figure 5) - e.g. rs11807240 in FUBP1, which upregulates the mRNA levels of the two hexokinase genes Hk1 and Hk2 - the rate limiting enzymes of glycolysis. A positive correlation between FUBP1 mRNA and both of hexokinases was found in several types of cancers (Kang, Lee, Kim, Lee, & Kim, 2019). Variants in LCA5 gene were shown to modify glucose response in a clinical trial of insulin and potassium (GIK) infusion in acute coronary syndromes (Ellis et al., 2015). The rs9352745 associated with GWG is an eQTL for SH3BRGL2, whose expression is associated with diabetes (type 1, type 2 and gestational) in a meta-analysis study. An interaction between SH3BRGL2 SNP and total fat intake was found to affect LDL-PPD (Rudkowska et al., 2015). We identified GWG associated SNP rs7609526 in KANK1 related to fasting proinsulin (Huyghe et al., 2013) and fasting plasma glucose (Hwang et al., 2015) in GWAS. CADPS (with GWG associated SNP rs1398095) plays a role in insulin secretion (Speidel et al., 2008). Cg14451730 located near CADPS is differentially methylated with HbA1c levels in the Taiwan Biobank cohort (Hsiung et al., 2019). The suggestive association with fasting plasma glucose of rs487321 in CADPS gene was found in Arabian population of T2D patients (Hebbar et al., 2020). We also found a variant correlating with GWG in RPL29P25 gene. The presence of anti-60S ribosomal protein L29 (RPL29) antibody in human serum was shown to inhibit the proliferation of pancreatic cancer cells in various cancers and it is believed to be a novel candidate for a prognostic marker for unresectable pancreatic cancer (Muro, Miyake, Kato, Tsutsumi, & Yamamoto, 2015). The knockdown of RPL29 leads to suppression of cell proliferation, induces cell arrest (at G0/G1phase), enhances cell apoptosis and decreases intracellular ROS generation (C. Li, Ge, Yin, Luo, & Chen, 2012). The rs4808209 (in ZNF1 gene) is an eQTL for LPAR2 - the receptor for a signaling lipid LPA. It is a part of the LPAR2/Gab1/PI3K/Akt pathway, which influences glucose uptake (Rodriguez-Araujo et al., 2013) and is differentially expressed in fatty vs normal liver in extreme obese cohort (DiStefano et al., 2014). Its expression correlates with the invasiveness of pancreatic cancers (Gong et al., 2012) as well as gynecological disorders (Fujii et al., 2019; Kowalczyk-Zieba et al., 2019; Wasniewski & Woclawek-Potocka, 2018; X. Yu, Zhang, & Chen, 2016).
In Analyses 3 and 4, we set to determine whether genes associated with GWG also impact BMI. Basing on the summary results from the GIANT cohort we show a number of such genes. Some of their SNPs were previously associated with BMI, body fat distribution, attendance to gym or sport groups, sleep duration, height, lipoprotein levels, low HDL-level cholesterol. At the same time, in a much smaller ARIC cohort we find 15 variants associated with diabetes adjusted BMI. None of them is listed in GWAS Catalog or PheWas, however other variants in these genes were already mentioned to be associated with BMI.
Our analysis shows association with rs12685009 in the SLC24A2 loci, which belongs to the family of K+ dependent Na+/Ca2+ exchanger (Schnetkamp, 2013). A member of the family, SLC4 influences MC4R dependent satiety and the loss of MC4R function leads to prolonged obesity and reduced energy expenditure, while mice lacking SLC4 display anorexia (X. F. Li & Lytton, 2014). Also, variants in SOX6, a transcription factor shown to be involved in the promotion of adipogenesis (Iguchi et al., 2005; Leow et al., 2016), were previously related to obesity (Correa-Rodríguez, Schmidt-RioValle, & Rueda-Medina, 2018; Y. Z. Liu et al., 2009). The rs77346003 in the ADIPOR1 loci - a receptor for adiponectin known to regulate glucose metabolism and fatty acid oxidation associates with BMI in our study. Its variants in GWAS are related to obesity (Beckers et al., 2013; Keustermans et al., 2017; Peters et al., 2013) as well as fetal weight (Fensterseifer, Austin, Ford, & Alexander, 2018; Muñoz-Muñoz, Krause, Uauy, & Casanello, 2018). ADIPOR1 expression correlates with improved insulin sensitivity and PGC-1A expression - a master regulator of mitochondrial gene expression (Za’don et al., 2019). Moreover, our analysis identifies eQTLs for mitochondria associated genes – ATP5G3 (rs144768710) and HSPB8 (rs4131847). ATP5G3 is involved in the proton pathway and acts as an energy-driving motor (He et al., 2017; Huang et al., 2013; Spataru, Le Duc, Zagrean, & Zagrean, 2019). HSPB8 is known to prevent oxidative tissue damage and its expression in serum is used as a biomarker for virus induced type 1 diabetes (Karthik, Ilavenil, Kaleeswaran, Sunil, & Ravikumar, 2012; X. C. Li et al., 2017; L. Yu et al., 2019). We also identified rs34427781 - an eQTL for several genes (CYP2D8P, NDUFA6-AS1, CYP2D6, CCDC134, CENPM, CHADL, FAM109B, NAGA, NDUFA6, OGFRP1, OLA1P1, SEPT3, SHISA8, SLC25A5P1, SMDT1, SREBF2, TNFRSF13C, WBP2NL) to be associated with BMI. It is worth noting that a subset of these genes is involved in lipid metabolism (NAGA, SREBP) or mitochondrial signaling (SLC25A5P1, NDUFA6, SMDT1). SREBP is a master regulator of lipid and sterol biosynthesis (Düvel et al., 2010); the gene-gene interactions between variants in the INSIG-SCAP-SREBP pathway are associated with risk of obesity in Chinese children (F. H. Liu et al., 2014). The SMDT1 gene builds the mitochondrial calcium uniporter subunit (mtCU) localized in the inner mitochondrial membrane and is responsible for the Ca2+ transport to the mitochondrial matrix (Pendin, Greotti, & Pozzan, 2014), while its expression was shown to associate with fetal development (Vishnyakova et al., 2019). SLC25 genes, members of SLC channels mentioned above, are known to be subunits of another complex essential for proper mitochondrial dynamics and energy production – ANC. ANC is responsible for mitochondrial/cytoplasmic ADP/ATP exchange (Clémençon, Babot, & Trézéguet, 2013) and its expression was shown to be consistently upregulated in obesity (Padilla et al., 2014). NDUFA6 is part of the first complex of the mitochondrial respiratory chain, which expression impacts oxidative stress and energy production efficacy (Fiedorczuk & Sazanov, 2018). Lastly, the TNFRSF13C (BAFF) gene regulates insulin sensitivity (Kawasaki et al., 2013) and is associated with autoimmune diseases (Moisini & Davidson, 2009).
The above results are congruent with the gene-based fBAT analysis, that points us towards genes which correlate with BMI (GATAD2, LHFPL6) and immune response/autoimmunity (HLA-DQB, HLA-DRB, HLA-B). GATAD2A is involved in embryonic development (Wang et al., 2017) and associates with obesity (Saxena et al., 2012). A copy number variation of LHFPL6 associates with average daily gain in cattle (Xu et al., 2019), while its rs4073643 with systemic lupus erythematosus in the Chinese population (Zhang et al., 2016). While the association between HLA variants and T1DM is very well known (Zhao et al., 2016), HLA loci are linked to other phenotypes (Karnes et al., 2017): type 2 diabetes (Ng et al., 2014), fatty liver disease (Doganay et al., 2014) as well as BMI (Shen et al., 2018) or waist-to-hip circumference (Wen et al., 2016). More importantly, these variants associate with trends in fetal birth weight (Capittini et al., 2009), level of inflammation in visceral adipose tissue in pregnant women (Eyerahi et al., 2018) and different mRNA levels in visceral omental adipose tissue of pregnant women with gestational diabetes (Deng et al., 2018). The HLA-DQA1, HLADQB1 are differentially methylated in siblings born before vs after maternal bariatric surgery (Berglind et al., 2016).
In this study we identified several loci which contribute to the genetic correlation between BMI and GWG. Variants identified in those loci are associated with genes linked to insulin signaling, glucose homeostasis, mitochondrial metabolism, ubiquitinylation and inflammatory responses and placenta functioning, not only in the diabetic cohorts, but also in the general population. The genetic contribution to GWG is clearly connected with BMI associated loci.
Data Availability
The data are available for reasearch use only. Ethics approval is reguired to access the data.
DECLARATIONS
Funding
The study was funded by the National Science Centre in Poland through the Sonata Grant “Search for genetic variants influencing gestational weight gain in type 1 diabetes patients by genome wide association method” to ALS (Nr 2013/11/D/NZ5/03219).
Conflict of interests
The authors declare they have no competing interests.
Ethics approval and consent to participate
This study was approved by the Bioethical Committees of the Jagiellonian University and Poznan University of Medical Sciences and performed according to the Helsinki Declaration.
Consent to participate
Informed consent was obtained from all individual participants included in the study.
Consent to publication
Not applicable
Availability of data and materials
Sequence data has been deposited at the European Genome-phenome Archive (EGA), which is hosted by the EBI and the CRG, under accession number EGAS00001004408. Further information about EGA can be found on https://ega-archive.org “The European Genome-phenome Archive of human data consented for biomedical research” (http://www.nature.com/ng/journal/v47/n7/full/ng.3312.html).
Authorship statement
All authors whose names appear on the submission made substantial contributions to the conception or design of the work; or the acquisition, analysis, or interpretation of data; or the creation of new software used in the work; drafted the work or revised it critically for important intellectual content; approved the version to be published; agree to be accountable for all aspects of the work in ensuring that questions related to the accuracy or integrity of any part of the work are appropriately investigated and resolved.
SUPPLEMENTARY INFORMATION LEGEND
Table S1a. The results of PrediXcan on BMI in T1D cohort in Subcutaneous Adipose Tissue.
Table S1b. The results of PrediXcan on BMI in T1D cohort in Visceral Adipose Tissue.
Table S1c. The results of PrediXcan on GWG in T1D cohort in Subcutaneous Adipose Tissue.
Table S1d. The results of PrediXcan on GWG in T1D cohort in Visceral Adipose Tissue.
Table S2. The overlap of PrediXcan results in Subcutaneous and Visceral Adipose Tissue in the Giant cohort.
Table 3a. The results of PrediXcan on Giant cohort on BMI only.
Table S3b. The results of PrediXcan on Giant cohort on BMI and GWG.
Table S3c. The results of PrediXcan on Giant cohort on GWG only.
Table S4a.The results of PrediXcan on BMI in T2D cohort in Subcutaneous Adipose Tissue.
Table S4b. The results of PrediXcan on BMI in T2D cohort in Visceral Adipose Tissue.
Table S4c. The results of PrediXcan on BMI in ARIC cohort in Subcutaneous Adipose Tissue.
Table S4d. The results of PrediXcan on BMI in ARIC cohort in Visceral Adipose Tissue.
Table S5a. The results of PrediXcan on T2D&ARIC cohorts on BMI only.
Table S5b. The results of PrediXcan on T2D&ARIC cohorts on BMI and GWG. Table S5c. The results of PrediXcan on T2D&ARIC cohorts on GWG only.
Table S6. The list of variants associated with GWG in BMI associated genes in T2D&ARIC cohorts.
Table S7. The FUMA analysis on BMI associated variants in GWG associated genes in T1DM cohort.
Table S8a. Go Enrichment analysis on the overlap between BMI and GWG genes in the Giant cohort.
Table S8b. Go Enrichment analysis on BMI only associated genes in the Giant cohort. Table S8c. Go Enrichment analysis on GWG only associated genes in the Giant cohort.
Table S9a. Go Enrichment analysis on the overlap between BMI and GWG genes in T2D and ARIC cohorts.
Table s9b. Go Enrichment analysis on BMI only associated genes in T2D and ARIC cohorts.
Table S9c. Go Enrichment analysis on GWG only associated genes in T2D and ARIC cohorts.
Figure S1a. The LD analysis for GPN3 gene. Figure S1b. The LD analysis for PMS2P3 gene.
Figure S1c. The LD analysis for STAG3L1 gene.
Figure S2. The KEGG analysis on GWG associated variants in BMI associated genes in T2D&ARIC cohorts.
Figure S3a. Go Enrichment analysis on GWG only associated genes in the Giant cohort.
Figure S3b. Go Enrichment analysis on the overlap between BMI and GWG genes in the Giant cohort.
Figure S4a. Go Enrichment analysis on GWG only associated genes in T2D and ARIC cohorts.
Figure S4b. Go Enrichment analysis on the overlap between BMI and GWG genes in T2D and ARIC cohorts.
ACKNOWLEDGEMENTS
The authors thank prof. Katarzyna Cypryk and dr Monika Żurawska-Kliś for their help in recruiting patients.
This research was supported in part by PLGrid Infrastructure. The bioinformatic analysis was performed using Prometheus (AGH, Krakow, Poland), Michigan Imputaton Server (Michigan, MI, USA) and The Ohio Supercomputer Center (Columbus, OH, USA).
For manuscripts with ARIC GWAS data (including HapMap and 1000G imputed data): The Atherosclerosis Risk in Communities study has been funded in whole or in part with Federal funds from the National Heart, Lung, and Blood Institute, National Institutes of Health, Department of Health and Human Services (contract numbers HHSN268201700001I, HHSN268 201700002I, HHSN268201700003I, HHSN268201700004I and HHSN268201700005I), R0 1HL087641, R01HL059367 and R01HL086694; National Human Genome Research Institute contract U01HG004402; and National Institutes of Health contract HHSN268200625226C. The authors thank the staff and participants of the ARIC study for their important contributions. Infrastructure was partly supported by Grant Number UL1RR025005, a component of the National Institutes of Health and NIH Roadmap for Medical Research.
The BioMe Biobank Program T2D-GENES Exome Sequencing Study was conducted by the BioMe Biobank Program T2D-GENES Exome Sequencing Study Investigators and supported by the National Institute of Diabetes and Digestive and Kidney Diseases (NIDDK). The data from the BioMe Biobank Program T2D-GENES Exome Sequencing Study reported here were supplied by the Broad Institute and Icahn School of Medicine at Mount Sinai. This manuscript was not prepared in collaboration with Investigators of the BioMe Biobank Program T2D-GENES Exome Sequencing study and does not necessarily reflect the opinions or views of the BioMe Biobank Program T2D-GENES Exome Sequencing study, or the NIDDK.


