
Abstract
Objectives To determine whether UVA exposure might be associated with COVID-19 deaths
Design Ecological model and meta-analysis
Setting 2,474 counties of the contiguous USA, 6,755 municipalities in Italy, 6,274 areas in England. Data were collected during their ‘Vitamin D winter’ (monthly mean UVvitd of under 165 KJ/m2) from Jan to April 2020.
Participants (instead of patients or subjects) The ‘at-risk’ population is the total county population, with measures to incorporate spatial infection into the model. The model is adjusted for: age, ethnicity, socioeconomic deprivation, long term PM2.5, and UV weighted by the vitamin D action spectrum.
Main outcome measures We derive UVA measures for each area and estimate their relationship with COVID-19 mortality with a random effect for States, in a multilevel zero-inflated negative binomial model. In the USA and England death certificates had to record COVID-19. In Italy excess deaths in 2020 over expected from 2015-19.
Data sources Satellite derived mean daily UVA dataset from Japan Aerospace Exploration Agency. Data on deaths compiled by Center for Disease Control (USA), Office for National Statistics (England) and Italian Institute of Statistics.
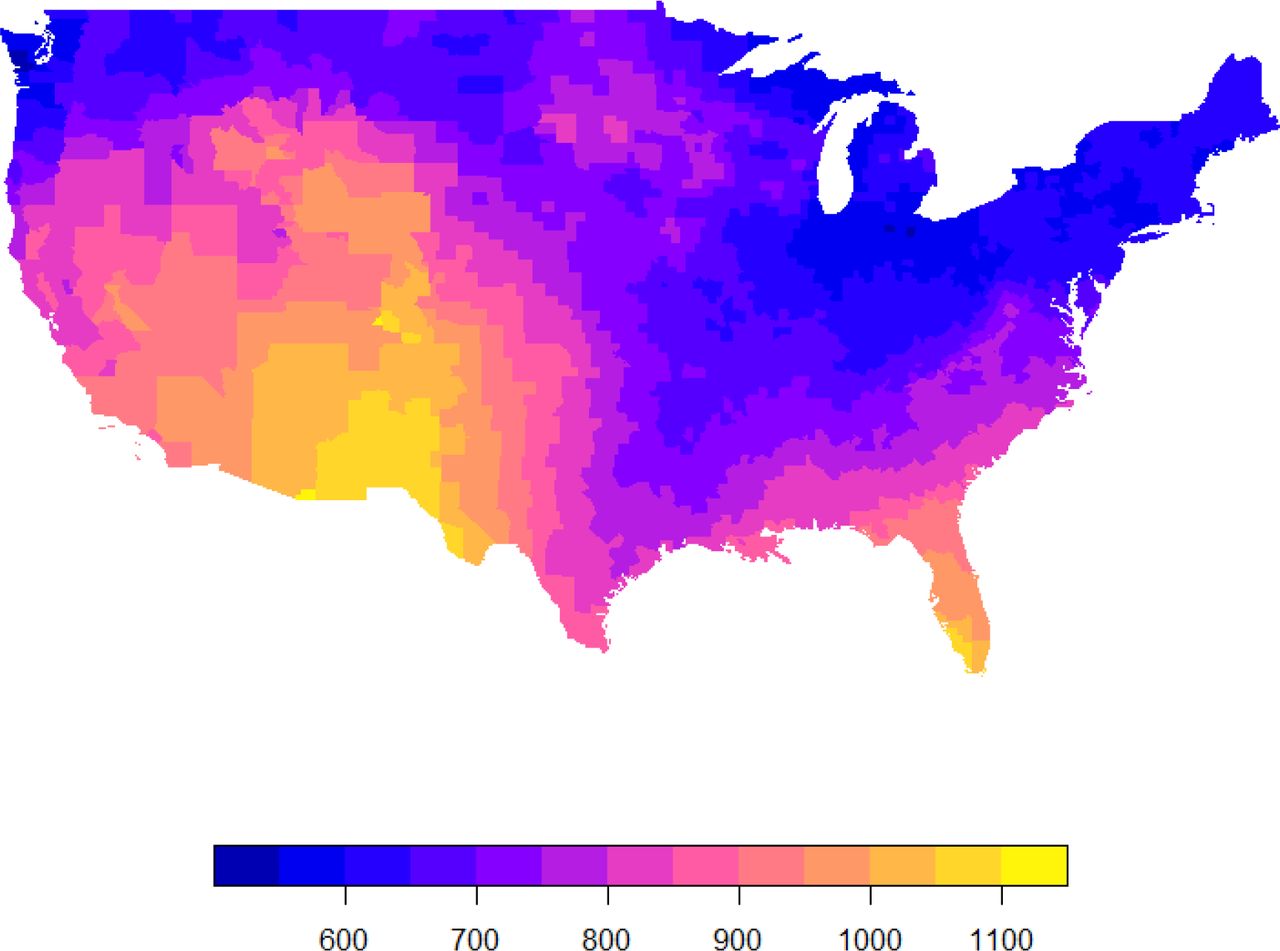
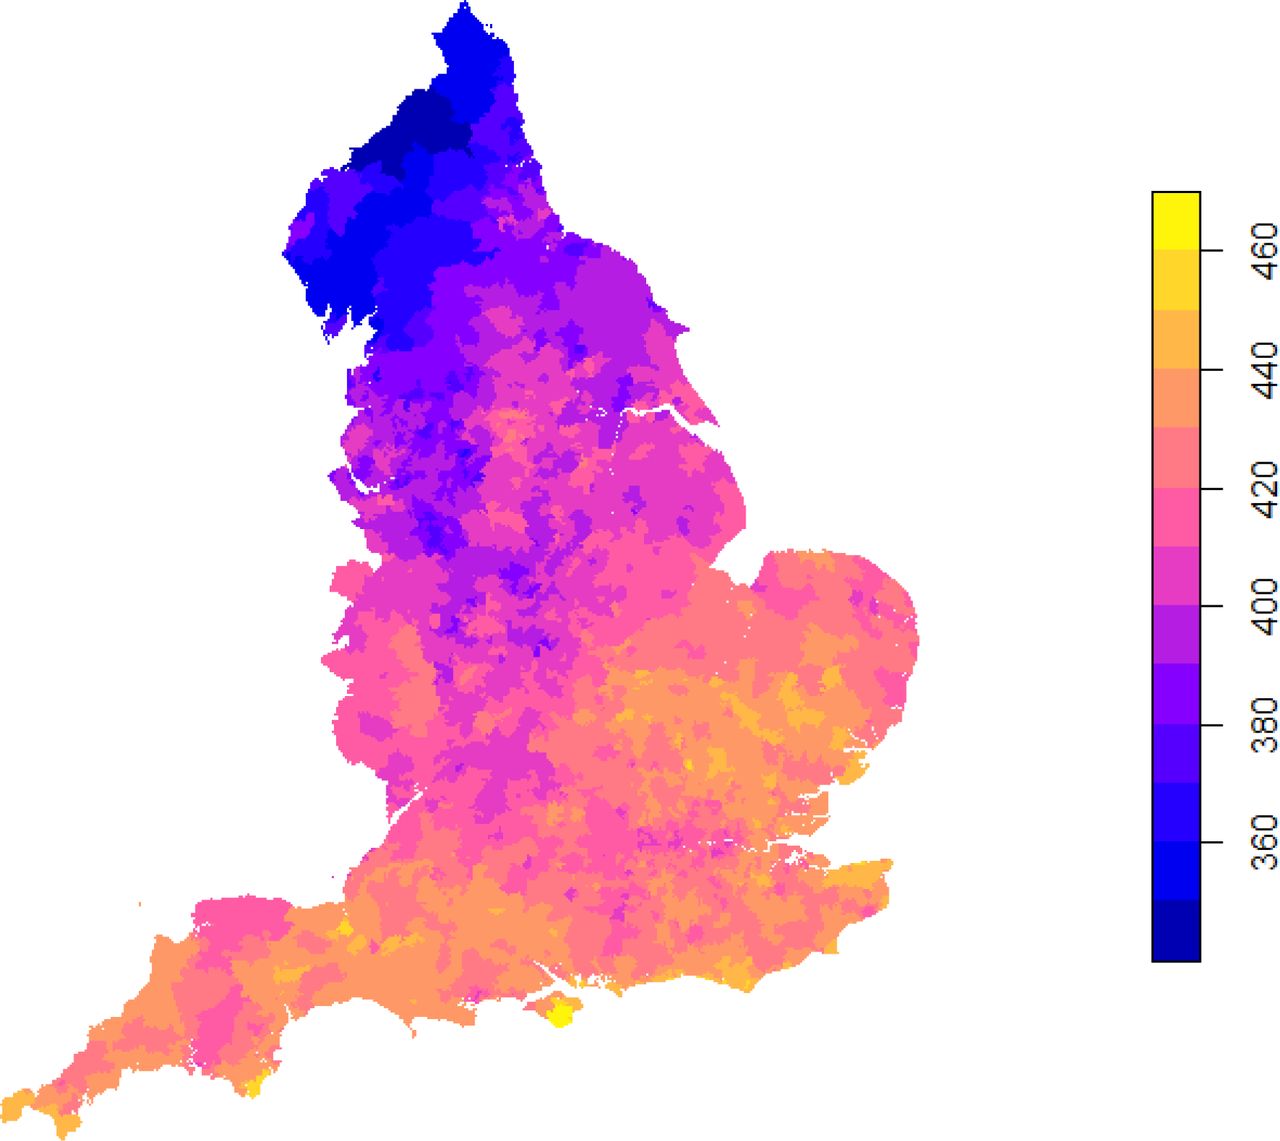
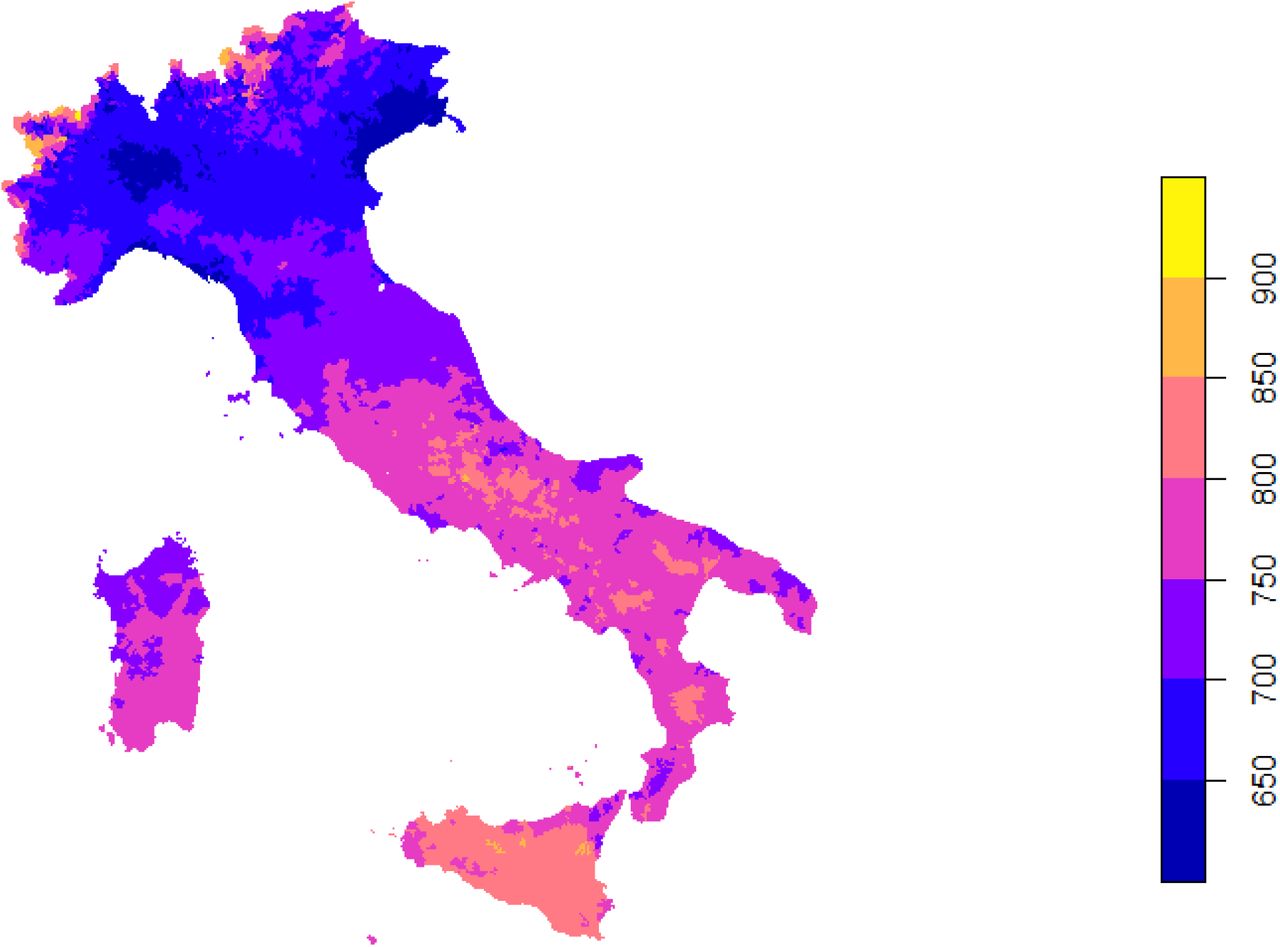
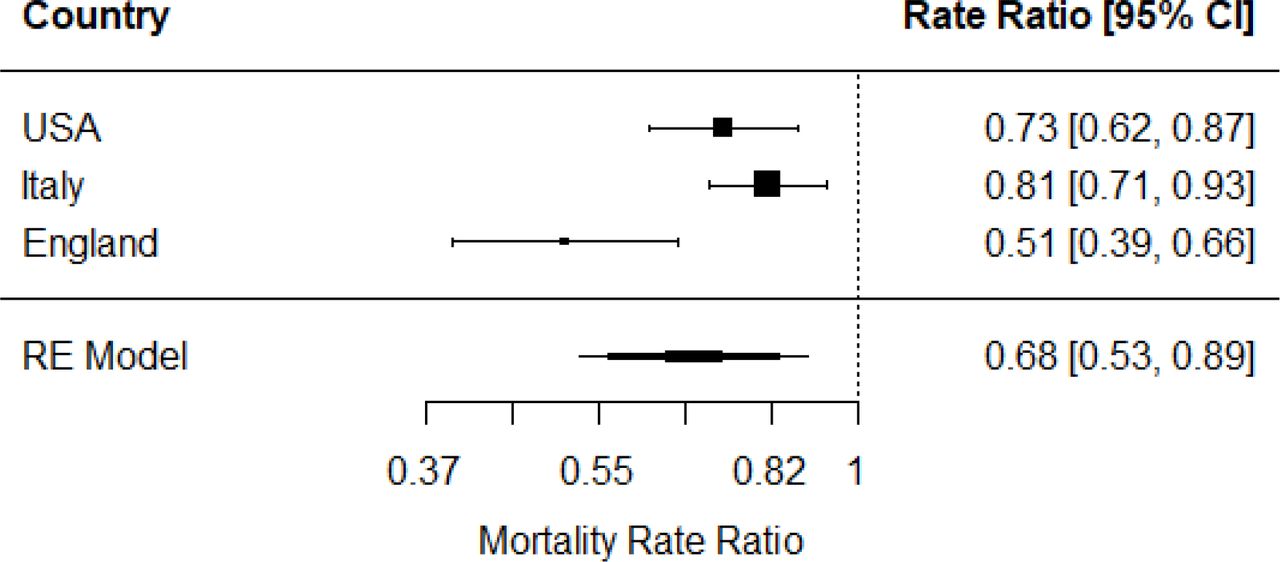
Results Daily mean UVA (January-April 2020) varied between 450 to 1,000 KJ/m2 across the three countries. Our fully adjusted model showed an inverse correlation between UVA and COVID-19 mortality with a Mortality Risk Ratio (MRR) of 0.73 (0.62 to 0.87)per 100KJ/m2 increase UVA in the USA, 0.81 (0.71 to 0.93) in Italy and 0.51 (0.39 to 0.66) in England. Pooled MRR was 0.68 (0.53 to 0.66).
Conclusions Our analysis, replicated in 3 independent national datasets, suggests ambient UVA exposure is associated with lower COVID-19 specific mortality. This effect is independent of vitamin D, as it occurred at irradiances below that likely to induce significant cutaneous vitamin D3 synthesis.
Causal interpretations must be made cautiously in observational studies. Nonetheless this study suggests strategies for reduction of COVID-19 mortality
Introduction
Seasonality1 and variation in temperature2, humidity3 and UV radiation4 are related to the incidence of several infectious diseases. COVID-19 arose less than 6 months ago, and it is thus not possible to describe seasonal variation. Nonetheless, spatial variation in levels of environmental UV in the early pandemic allows its relationship with COVID-19 mortality to be modelled. We have previously described a novel nitric oxide driven, vitamin D independent, mechanism5 by which sunlight can lower blood pressure, and at the population level we have shown that UV is associated with lower blood pressure6 and a reduced incidence of myocardial infarctions7. The same UV driven mechanism may also cause seasonal variation in development of diabetes and metabolic syndrome8. Given the apparent greater severity of illness and risk of death amongst those with these conditions9,10 and the importance of season, we explore whether ambient UVA exposure is associated with COVID-19 deaths across the USA and replicate this analysis in independent data sets from England and Italy.
Methods
Study Setting and Participants
We use an ecological model of COVID-19 deaths across USA counties (N=2,472), English Middle Layer Super Output Areas (MSOA’s) (N=6,724) and excess deaths in Italian municipalities (N=6,775). We only include counties that were experiencing levels of UV too low (monthly mean UVvitd of under 165 KJ/m2) to be inducing significant levels of cutaneous vitamin D3 synthesis during the study period (‘UV vitamin D winter’). USA COVID-19 deaths were drawn from data compiled by the Center for Systems Science and Engineering at Johns Hopkins University. Data were from the period up to the 30th of April. These data are derived from death certificates, with information on cause and circumstances of death recorded, collected by the Center for Disease Control and Prevention (CDC). A COVID-19 death represents a case where the practitioner suspected that COVID-19 played a role in the death, even if it was not directly attributable to the death. English COVID-19 deaths were drawn from data compiled by the Office for National Statistics (https://www.ons.gov.uk/peoplepopulationandcommunity/birthsdeathsandmarriages/deaths/bulletins/deathsinvolvingcovid19bylocalareasanddeprivation/deathsoccurringbetween1marchand17april). Data were from the period from 1st of March to the 17th of April. To be included in this dataset COVID-19 had to mentioned on the death certificate, with a delay of usually five days between occurrence and registration. Italian excess deaths were drawn from ISTAT (Italian Institute of Statistics) (https://www.istat.it/it/archivio/240401) for a sample of municipalities (7,270/7,904; 92%). Data were for the period 1st of March to 30th of April for 2015-2019 and 2020. These data included all deaths registered in an integrated database, consisting of the registry source (Anagrafe Nazionale della Popolazione Residente; ANPR, and municipalities) with the Tax Register. We classified excess deaths as the positive difference in deaths between 2020 and 2015-19, with negatives recorded as zero.
Ambient UV data
We derive mean daily UVA for each study – USA (1st of Jan – 30th of April); England (1st of Jan – 17th of April) and Italy (1st of Jan – 30th of April). The UVA dataset was produced by JAXA (Japan Aerospace Exploration Agency) using the MODerate resolution Imaging Spectroradiometer (MODIS) instrument on board NASA’s Aqua and Terra satellites11. Atmospheric absorption due to the ozone and water vapour (cloudiness) were accounted for by using a simplified planetary atmosphere (clear atmosphere positioned above a cloud layer). Downward irradiance values (i.e. combined direct and diffuse radiation on a horizontal plane) for UVA (315nm-400nm) were converted to daily values by using the diurnal cycle of solar zenith angle with instantaneous atmospheric conditions. These data are available to download at a 5km by 5km spatial resolution. UVA data were aggregated for USA counties, English MSOA’s and Italian municipalities and expressed as mean daily KJ/m2.
UVvitd data were aggregated for US counties and expressed in mean monthly KJ/m2. We used the highest quintile Figure 1 as the cut off for year round vitamin D synthesis, which corresponds to a monthly mean of over 165 KJ/m2. It also corresponds approximately to the 37°N parallel; Holick suggests that people living North of this latitude will not receive sufficient UV for vitamin D synthesis in the winter12.

Covariates
A number of demographic, socioeconomic deprivation, long term environment and infection susceptibility variables were used in the analysis.
Demographic
We used data on county percentage of older residents (≥ age 65), percentage of Hispanic residents and percentage of Black residents for the USA. We used data from ONS mid-year population estimates of 2018 on percentage of residents who were: aged 80 or over, aged 65-79, the 2011 census on living in care homes, Black, Indian, Pakistani/Bangladeshi and Chinese in England. We used data from ISTAT on number of foreign born residents and the percentage of residents: aged 65 and above and aged 85 and above, for Italy. Older age and BAME ethnicity are associated with higher risk of COVID-19 death, possibly due to higher prevalence of comorbidities, including hypertension, heart disease and respiratory diseases10.
Socioeconomic Deprivation
Socioeconomic deprivation was defined in the USA by the first principal component score from A Principle Component Analysis of the following county variables: percentage in poverty, median house value, median house income, percentage owner occupied and percent of population with less than a high school education. We reversed the direction of percentage in poverty and percent of population with less than a high school education so that higher score represented higher affluence. To capture socioeconomic deprivation in England we used percentage of residents who were under 21 did not enter higher education and the income deprivation score indicating of percentage of people who received benefit due to low income (https://www.gov.uk/government/statistics/english-indices-of-deprivation-2019). For our Italian study, we used the Italian Deprivation index, calculated by ISFOL (research Italian institute on work and social policies), which considers income, education, living conditions, unemployment and household composition. It is hypothesised that whilst affluent citizens were more likely to get COVID-19 in the early stages of the pandemic, poorer citizens are increasingly at higher risk of infection due to essential working and death due to pre-existing health conditions13.
Long term environment
Long term PM2.5 (2000-2016) data at a 0.01° by 0.01° resolution were modelled using satellite and monitored PM2.5 station data14. We used these data for both the USA and Italy. In England long term 2014-2018 PM2.5 at a 1km by 1km resolution was modelled using monitored PM2.5 station data (https://uk-air.defra.gov.uk/data/pcm-data). Higher PM2.5 is linked with a range of respiratory and cardiovascular disease and shown to increase COVID mortality rate in other analyses15. Long term mean monthly winter temperature (Dec-Feb) at a 4km by 4km resolution for 2000-2016, was modelled using satellite data16 for the USA. Long term mean monthly winter temperature (Dec-Feb) at a 1km by 1km resolution for 1981-2010 was modelled using interpolation of Met Office weather stations for England (http://data.ceda.ac.uk/badc/ukmo-hadobs/data/insitu/MOHC/HadOBS/HadUK-Grid/v1.0.1.0/1km/tas/mon-30y/v20190808). Long term median land surface temperature (Dec-Feb) daytime monthly median value at a 1km by 1km resolution for 2000-2017, was modelled using satellite data for Italy (https://developers.google.com/earth-engine/datasets/catalog/OpenLandMap_CLM_CLM_LST_MOD11A2-DAY_M_v01). Variation in temperature was recently associated with COVID-1917 mortality.
Infection Susceptibility
Infection susceptibility was defined by county population density, urban/rural status and state percentage of positive tests in the USA. We used population density from the 2018 mid-year population estimates of ONS, percentage of residents using different forms of transport (bus, train, tube) from the 2011 census and Upper Tier Local Authority (UTLA) number of days since a local authority had 10 confirmed cases. We used ISTAT population density from 2019, the municipality area, and total cases in province in Italy up to the 30th of April (https://github.com/pcm-dpc/COVID-19/tree/master/dati-province). In densely populated, urban or peri-urban areas, with high use of public transport COVID-19 transmission is faster and the prevalence of cases higher. Therefore the infections susceptibility measures adjust the models for the population ‘at-risk’.
Statistical Analysis
We estimate, in a multilevel zero-inflated negative binomial model (using the glmmTMB package), the relationship between ambient UVA and COVID-19 deaths (21st January-April 30th), with a state level (N=46) level random effect. The ‘at-risk’ population is the total county population, with the [1] state level random effect, [2] a measure of the proportion of population tested positive for COVID-19 at the state level and [3] measures of infection susceptibility (county population density and urban-rural status), used to incorporate viral spread into the model. The model is adjusted at the county level for: percentage of older residents (≥ age 65), Hispanic and Black residents; socioeconomic deprivation and long term modelled 2000-2016 PM2.5, long term mean winter temperature (Dec-Feb).
Our first replication of the USA model was to investigate the relationship between ambient UVA and COVID-19 deaths in England (1st of March to 17th of April), with UTLA (N=150) level random effect. The ‘at risk’ population is the total MSOA population, with the [1] UTLA level random effect, [2] number of days since a local authority had 10 confirmed cases UTLA level and [3] measures of infection susceptibility (MSOA population density, population using public transport – bus, train and tube). The model is adjusted at the MSOA level for: Long term PM2.5, long term winter temperature, Percentage of residents: aged 80+, aged 65-79, Black, Indian, Pakistani/Bangladeshi, Chinese, in care homes, in higher education and income deprivation score (Table 1).
Our second replication of the USA model was to investigate the relationship between ambient UVA and excess deaths in Italy (1st of March to 30th of April), with Province (N=104) level random effect. The ‘at risk’ population is the total municipality population, with the [1] province level random effect, [2] number of tests for COVID-19 cases at the Province level and [3] measures of infection susceptibility (municipality population density and area). The model is adjusted at the municipality level for: Long term PM2.5, long term winter temperature, Number of foreign born, Percentage of residents: aged 65+, aged 85+ and deprivation (Table 1).
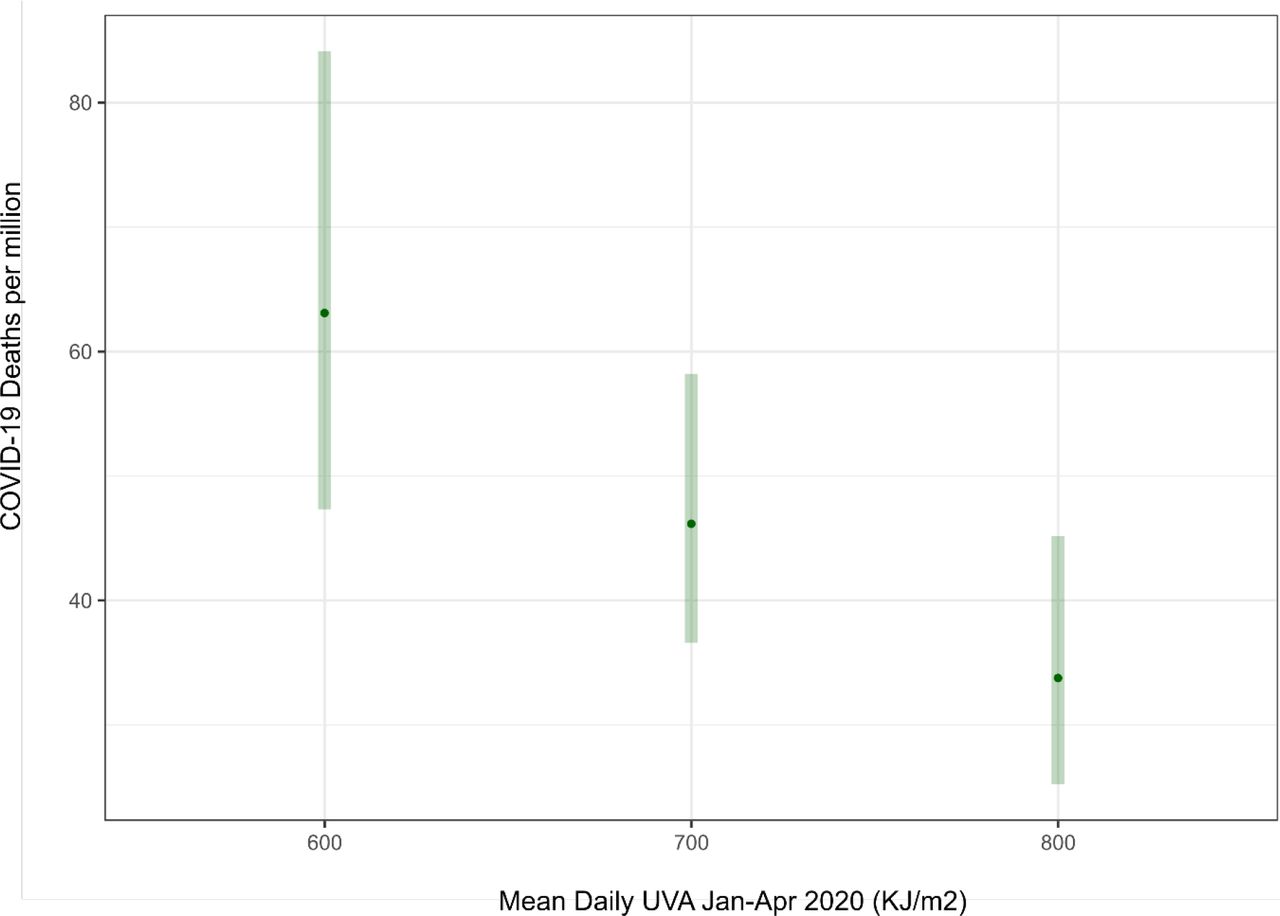
Effect estimates were presented as mortality rate ratios with 95% confidence intervals. We predicted the number of deaths per million population at suitable levels of UVA by calculating the marginal means in the ‘emmeans’ package. To understand the average true effect of UVA on COVID-19 related death in all similar countries to those included, we used a random effects model as part of the ‘metafor’ package. All analyses were undertaken in R 3.6.1.
Data Availability
The UVA estimates were developed by JAXA, with MODIS data provided by NASA GSFC, and available from ftp://apollo.eorc.jaxa.jp/pub/JASMES/Global_05km/. The long term UVvitd estimates were developed by NCAR and available from https://www2.acom.ucar.edu/modeling/tuv-download. The USA COVID-19 death and county level indicators of population, socioeconomic and environmental data (PM2.5 and temperature) were developed previously by Xiao Wu et al., and are available here: https://github.com/wxwx1993/PM_COVID.
Code Availability
The code and data to reproduce the current study is held at https://github.com/markocherrie/COVID19_UVA.
Results
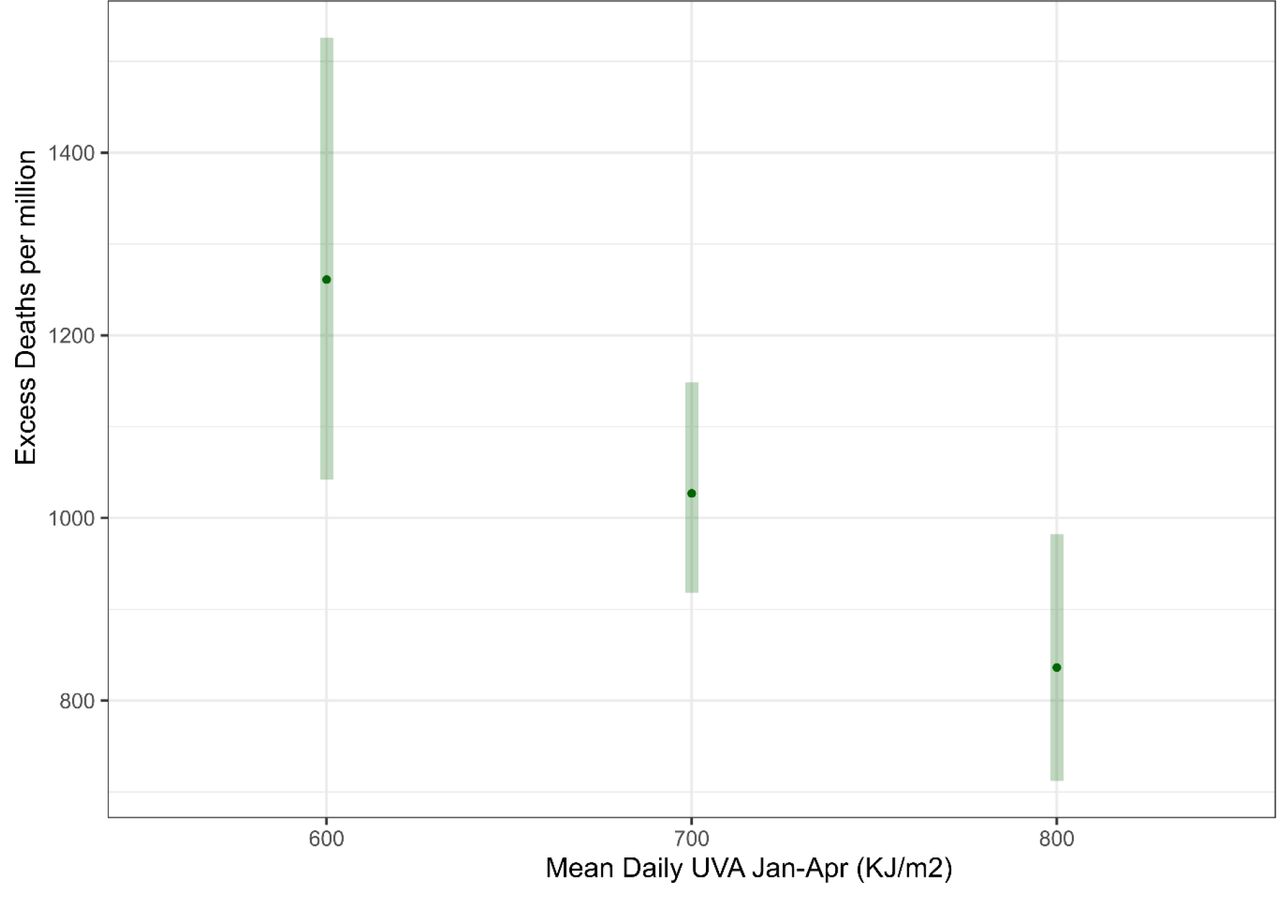
Daily mean UVA (January-April 2020) varied between 450-1,000 KJ/m2 across the three countries, with lower average levels experienced across England (Figure 2 a,b,c). Our fully adjusted model shows reductions in Mortality Risk Ratios (MRR) of 0.73 in the USA per 100 increase in UVA (KJ/m2) (Table). We found a similar size of effect in our two replication studies; an MRR in Italy of 0.81 and in England 0.49 with a pooled estimate of 0.68 (figure 3d). This represents a halving of the average risk of death across the lower and narrower range of UVA experienced across England and across the higher and wider range across Italy and the USA (Figure 3 a,b,c)


Discussion
Our analysis suggests that higher ambient UVA exposure is associated with lower COVID-19 specific mortality. This effect was independent of temperature and UV within the vitamin D action spectrum. Relatively higher UVA, across a country experiencing lower average levels of UVA during and immediately preceding the pandemic (England), is associated with greater falls in mortality risk compared to countries (Italy and the USA) with a higher average level suggesting an exposure tolerance effect.
There has been considerable debate around the possible role of Vitamin D supplementation for prevention of COVID-19, but to date the data do not support this intervention18. We have been able to show a possible benefit from UV at wavelengths that do not cause synthesis of vitamin D. This suggests that explanations for seasonal and geographic variations in COVID-19 prevalence19 need to consider mechanisms other than just vitamin D.
Seasonal variations in disease incidence can be caused by environmental, behavioural, and immunological factors with the relative importance of these varying by location and disease. UV may have a direct effect on the viability of SARS-COV2 virus in airborne droplets and on fomites, thus reducing both infection rates, and also the size of inoculum in those becoming infected, with correspondingly reduced disease severity20,21. UVA radiation photo-releases nitric oxide (NO) from stores in the skin whence it is mobilised to the systemic circulation, causing vasodilation and reduction in blood pressure5, offering cardiovascular and metabolic benefits from UV exposure5,8. As cardio-metabolic disease and possibly hypertension22 increase the risk of death from COVID-19, any UV driven improvements in these risk factors would be expected to reduce mortality23. Nitric oxide may also have a specific effect on COVID-19. It inhibits replication of SARS CoV24, probably by S-nitrosating the spike protein, thus preventing the post translational palmitoylation of the spike protein, required for fusion with its cognate angiotensin converting enzyme 2 receptor(ACE2R).25 The spike protein of SARS CoV is highly homologous to that of SARS CoV226,27 suggesting that NO may similarly limit binding to ACE2R by SARS CoV2 with reduction in disease transmission and severity. Endothelial damage, with reduced homeostatic endothelial NO synthase activity may underlie widespread organ involvement28. This would be mitigated by photochemical NO production.
There are several weaknesses in this study. UVA and covariates are measured at the small area level not as individual level exposures, there could be misclassification of deaths and infection was only estimated within the model and with indirect measures. However any resulting measurement errors seem unlikely to be correlated with spatial variation in UVA and therefore biasing. Importantly we replicate the finding across three countries with very different health systems and economic and social structures, pandemic situations and measure COVID-19 related deaths in two different ways.
The study was observational and therefore any causal interpretation needs to be taken with caution. However, if the relationship identified proves to be causal, it suggests that optimising sun exposure may be a possible public health intervention. Given that the effect appears independent of a vitamin D pathway, it suggests possible new COVID-19 therapies and in particular the importance of exploring the role of circulating NO.
Data Availability
Data Availability The UVA estimates were developed by JAXA, with MODIS data provided by NASA GSFC, and available from ftp://apollo.eorc.jaxa.jp/pub/JASMES/Global_05km/. The long term UVvitd estimates were developed by NCAR and available from https://www2.acom.ucar.edu/modeling/tuv-download. The USA COVID-19 death and county level indicators of population, socioeconomic and environmental data (PM2.5 and temperature) were developed previously by Xiao Wu et al., and are available here: https://github.com/wxwx1993/PM_COVID. Code Availability The code and data to reproduce the current study is held at https://github.com/markocherrie/COVID19_UVA.
ftp://apollo.eorc.jaxa.jp/pub/JASMES/Global_05km/
Ethics declaration
Competing interests
RW is a director of Relaxsol (company making sunscreen).
Acknowledgement
This work was supported by Health Data Research UK which receives its funding from HDR UK Ltd (HDR-5012) funded by the UK Medical Research Council, Engineering and Physical Sciences Research Council, Economic and Social Research Council, Department of Health and Social Care (England), Chief Scientist Office of the Scottish Government Health and Social Care Directorates, Health and Social Care Research and Development Division (Welsh Government), Public Health Agency (Northern Ireland), British Heart Foundation (BHF) and the Wellcome Trust


