
Abstract
Background Here, we characterize COVID-19 2nd waves, following a study presenting negative associations between 1st wave COVID-19 spread parameters and temperature;
Methods Visual examinations of daily increase in confirmed COVID-19 cases in 124 countries, determined 1st and 2ndwaves in 28 countries;
Results 1st wave spread rate increases with country mean elevation, temperature, time since wave onset, and median age. Spread rates decrease above 1000m, indicating high UV decrease spread rate. For 2nd waves, associations are opposite: viruses adapted to high temperature and to infect young populations. Earliest 2nd waves started April 5-7 at mutagenic high elevations (Armenia, Algeria). 2nd waves occurred also at warm-to-cold season transition (Argentina, Chile). Spread decreases in most (77%) countries. Death-to-total case ratios decrease during the 2ndwave, also when comparing with the same period for countries where the 1st wave is ongoing. In countries with late 1st wave onset, spread rates fit better 2nd than 1st wave-temperature patterns; In countries with ageing populations (examples: Japan, Sweden, Ukraine), 2nd waves only adapted to spread at higher temperatures, not to infect children.
Conclusions 1st wave viruses evolved towards lower spread and mortality. 2nd wave mutant COVID-19 strain(s) adapted to higher temperature, infecting children and replace (also in cold conditions) 1st wave COVID-19 strains. Counterintuitively, low spread strains replace high spread strains, rendering prognostics and extrapolations uncertain.
1. Introduction
Spread parameters of the Covid-19 pandemics decrease with temperature [1]. This could be a direct effect of temperature causing faster aerosol evaporation, limiting travel time and distance of airborn droplets with viral particles. Alternatively, high temperature due to insulation is a proxy for ultra-violet light (UV) exposure. UVs are highly mutagenic and might decrease viral “viability”.
2. Methods
We follow the same methodology as in [1] by using coefficients (slopes) from regression analyses, adjusting an exponential model y = a*exp(b*x) where y is the daily number of new confirmed COVID-19 cases, x is the number of days since wave onset, a is a constant and b is the slope. This corresponds to the log-transformed version ln y = ln a + b*x. Daily numbers of new cases and deaths per countries are from [2], data on mean elevation from [3], mean temperature from [4] and counts of mutations from [5, 6].
3. Results
3.1. Relationship between Covid-19 cases and mean elevation
Figure 1 plots slopes of exponential regressions on time of daily new cases (calculated as a function of days since first 100 confirmed cases) as a function of mean country elevation. Exponents increase with temperature up to 900-1000m, then drop above 1000m, especially for landlocked high elevation countries. This analysis potentially disentangles co-linearities between temperature and UV.

Slope of daily new confirmed Covid-19 cases as a function of mean country elevation. Circles: Countries contributing to the positive trend with elevation, up to 1400m, r = 0.469, two tailed P = 0.0015; X: Countries contributing to the negative trend with elevation, down to 110m, r = −0.298, two tailed P = 0.0417. Note that for countries above 1000m, landlocked and/or isolated countries tend to fit the negative trend (examples: Bolivia, Ethiopia, Armenia, Afghanistan) as opposed to countries with large coastal populations (examples: Chile, South Africa) and landlocked Nepal and Switzerland probably contaminated by tourists from low elevation countries. Peru has a low slope despite large coastal populations.
The trend below 1000m confirms previously described effects of temperature on spread parameters, as temperature decreases with elevation. The drop in exponents above 1000m elevation indicates direct UV effects, probably by increasing deleterious mutations. These observations are for exponents estimated for the 1st Covid-19 wave, for each country (Table 1).
Exponential slopes of 1st and 2nd Covid-19 waves in countries with two detected waves. Columns: 1. T, mean annual temperatures from [4], 2. E, mean elevation from [3], 3. D, densities from [7], 4. A, median age in that country from [8]. Start for 1st wave is the date when cumulated total confirmed cases reached 100, start for 2ndwave is visually estimated as in Figure 3. Slopes are the exponent b from the exponential regression y = a*exp(b*x), where y is the number of new daily cases and x the number of days since 100 cumulated cases for the 1st wave, or 2nd wave start. Total numbers of cases are given for 1st wave until 2nd wave, and for 2nd wave until 31/5 for countries with a 2nd wave up to 31/5, or before 15/4 included, and after 15/4 excluded until 31/5. %Dead: Percent dead among cases for the respective periods. 1st wave data were completed by data from [1] and countries with mean elevation >900m. In Kenya and Sri Lanka, erratic data prevent 1st wave slope estimation.
3.2. Covid-19 viruses evolve over time
Numbers of mutations in a country increase with time since 1st wave onset (r = 0.561, two-tailed P = 0.00084, Figure 2). Time since onset is indeed proportional to replicational cycles, and viral population evolution. No meaningful correlation was observed between mutation numbers and country mean temperature or elevation. Results remain qualitatively unchanged after excluding from analysis extreme datapoints (Nepal, UK).

3.3. Determination of 1st and 2nd waves
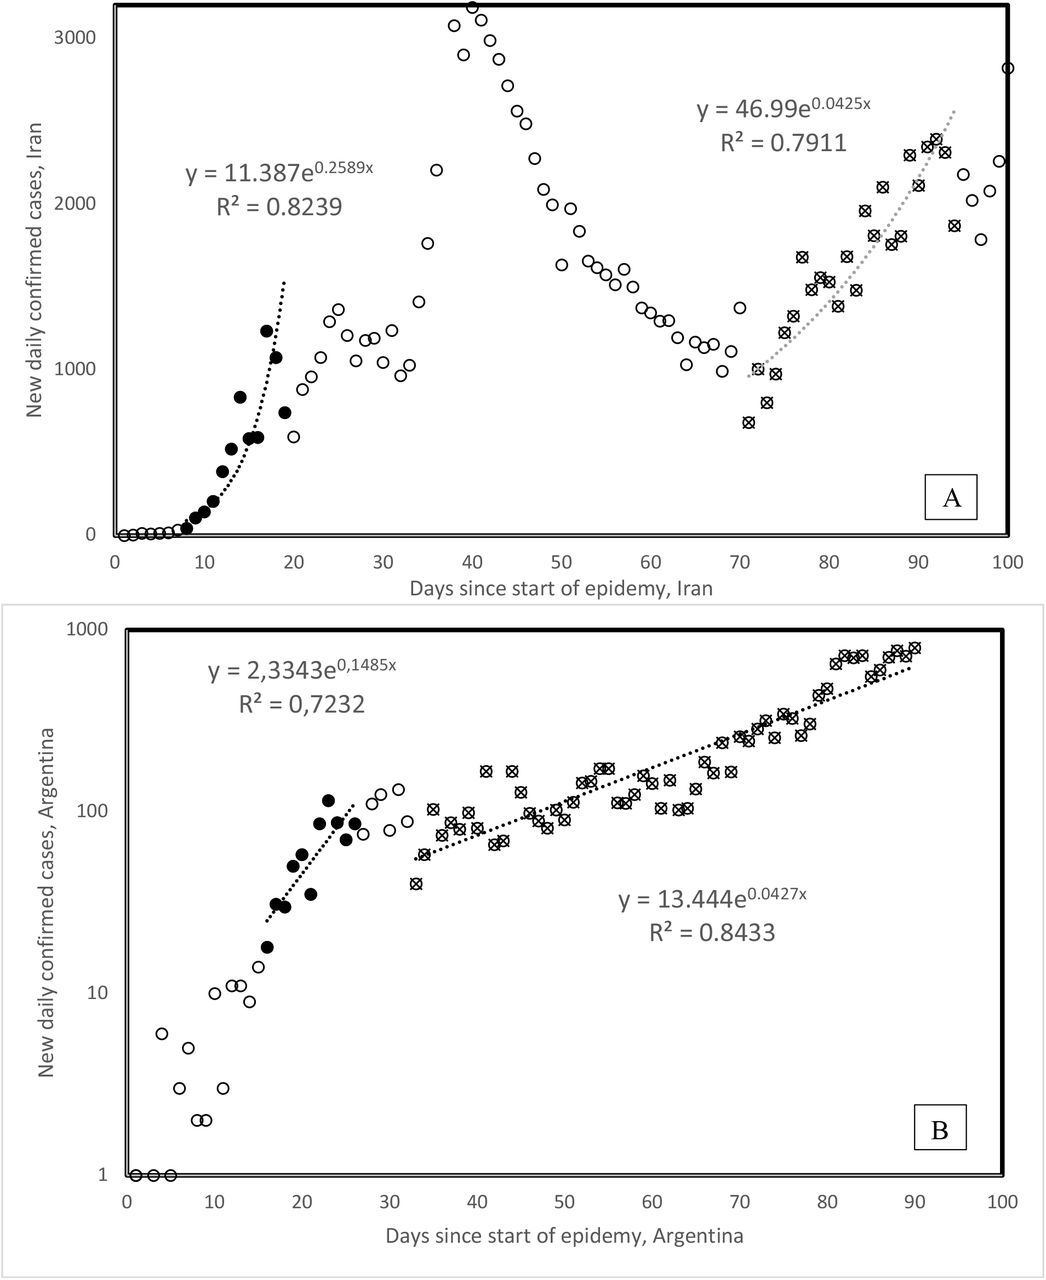
Here, we study exponents estimated for 2nd Covid-19 waves, derived from visually examining daily new cases in 123 countries. We explore temporal-, geographic-, demographic- and temperature-associated patterns of 2nd wave spread parameters. We examined graphs plotting daily numbers of new confirmed cases (as daily updated at https://www.worldometers.info/coronavirus/ [2]) for 123 countries. 2nd waves were visually determined, with examples in Figure 3 (Iran, Argentina). 2ndwaves occur in 26 countries, along patterns shown for Iran (broken 1st wave, 2nd wave starts from a low rates). The pattern shown for Argentina (new slope after inflection in 1st wave still in its growing phase) occurs also only in Chile. For Argentina and Chile, the new 2nd wave slope occurred during hot-to-cold season transitions, in early April, corresponding to early October northern hemisphere seasonal shifts.

1st and 2nd waves of Covid-19 epidemy in Iran (A) and Argentina (B). 1st wave onsets are defined from the day the cumulative total number of confirmed cases passes 100 cases. Onset of 2ndwaves is determined visually. All countries but Chile follow the general pattern as in the example for Iran, where the new wave follows a decrease, Chile follows the pattern of Argentina. Note the log scale for the Figure 2B y axis, visually enhancing slope change.
The lower 2nd vs 1st wave slopes in Figure 3 are not due to temperature increase as could be expected from negative correlations between 1st wave slopes and temperature [1]. This is because for Argentina and Chile (Table 1), lower slopes correspond to hot-to-cold season transition, not to cold-to-hot seasons. Table 1 compares 1st and 2nd wave slopes.
3.4. Geographical 2nd wave clusters
Visual data examinations such as in Figure 3 for 123 countries detect 2nd waves in 28 countries from four continents (Africa (2), America (North, 4; South, 2), Asia (12) and Europe (8)). For Kenya and Sri Lanka, 1st wave slopes could not be determined (Table 1). Earliest 2nd waves are from Armenia and Poland (April 5) and Algeria (April 7). 2nd waves are distributed into 4 geographic clusters (from earliest to latest): one spreading from the high elevation Eurasian plateau to surrounding countries (5/4 Armenia, 15/4 Iraq, 19/4 Lebanon, 25/4 Azerbaijan, Kyrgyzstan, 26/4 Uzbekistan, 1/5 Iran, 2/5 Oman, 8/5 Kazakhstan), a Central American cluster (21/4 El Salvador, 1/5 Guatemala, 17/5 Cuba, 19/5 Panama), a South American cluster (30/4 Chile, 5/5 Argentina), and a South-East Asian cluster (2/5 Singapore, 8/5 Sri Lanka, 12/5 Malaysia, 22/5 Philippines).
3.5. 2nd wave slopes and mortalities
2nd wave slopes are lower than 1st wave slopes for 20 among 26 countries (exceptions: Guatemala, Kazakhstan, Lithuania, Philippines, Portugal, Singapore), a statistically significant majority (two tailed sign test, P = 0.0047). Mean 2nd wave slope decrease as compared to 1st is by 43%.
Percentages of fatal cases among all confirmed cases are lower during 2nd waves than during 1stwaves in 17 among 28 countries (not a statistically significant majority). For countries where only the 1st wave occurred, mortality among confirmed cases increases in 20 among 29 countries during the 2nd wave period (16/4-31/5) as compared to the period up to 15/4. This is a statistically significant majority of countries (two tailed sign test, P = 0.031). The reasons for this increase are unknown and would suggest that at the end of epidemic waves, in this case the 1st wave, more lethal forms arise. Note that methods used here can not assess whether mixtures of 1st and 2nd wave virus strains occur in countries.
Differences between these two country groups are statistically significant (two-tailed Fisher exact test, P = 0.0343). Hence mortality rates seem to increase in 1st wave countries during the period the 2ndwave hits other countries, where mortality slightly decreases. Overall, 2nd waves are characterized by slower spread and perhaps lower mortality as compared to the same period for 1stwaves.
3.6. 2nd wave spread rates and temperature
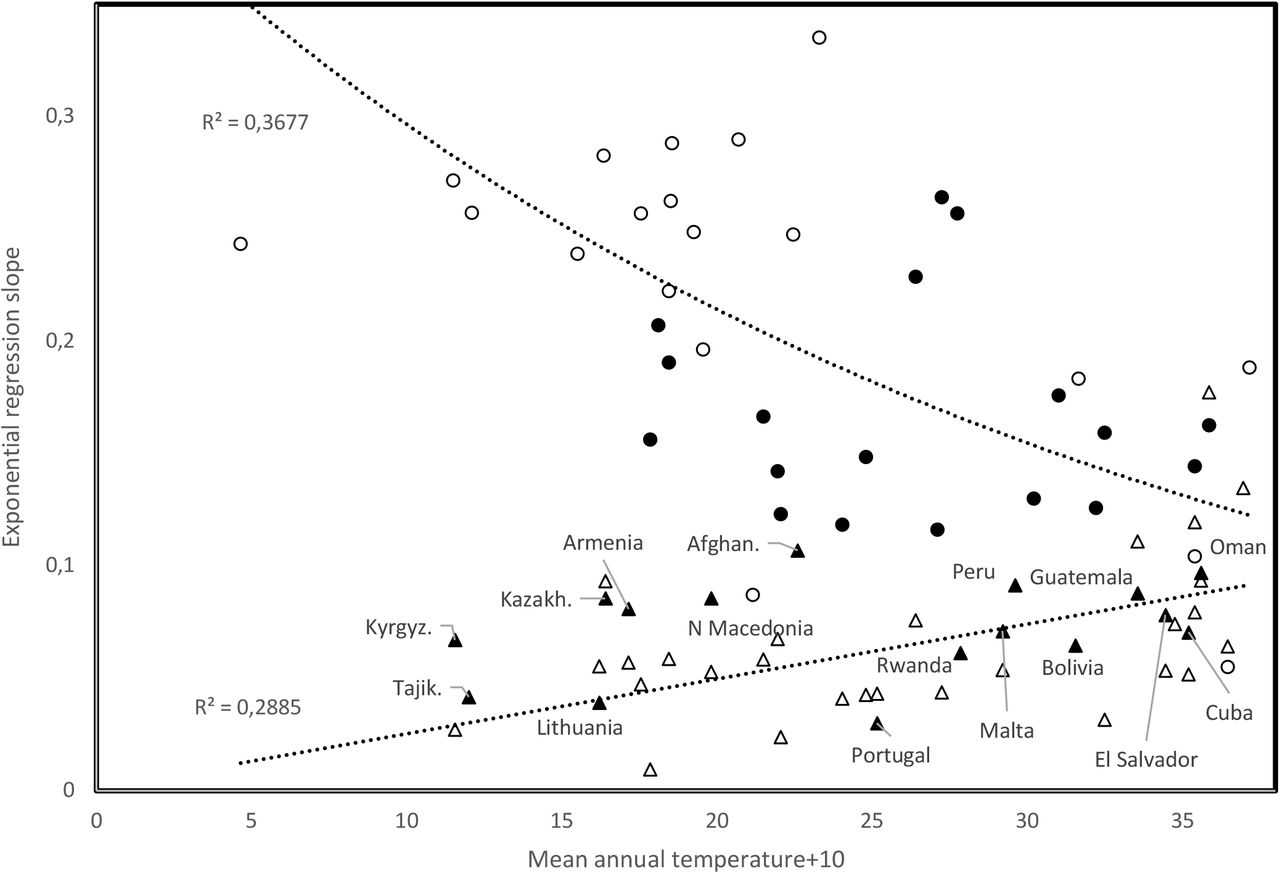
Figure 4 plots 1st and 2nd wave slopes as a function of mean annual temperature. Analyses for the 16 countries from [1] show a negative association between 1st wave slope and mean annual temperature (open circles in Figure 4), producing r = −0.606, two tailed P = 0.0128. The overall pattern for the 1st wave (37 countries added, filled circles and triangles) remains qualitatively as in [1] (r = −0.329, P = 0.00817, one tailed test, considering all 53 countries).

Slope of exponential regression of daily new cases vs time, as a function of mean annual temperature, comparing trends for 1st wave slopes (open circles from [1], filled circles and triangles are from this study), and 2nd wave slopes (open triangles).
2nd wave slopes (open triangles, Figure 4) increase with temperature (r = 0.537, two tailed P = 0.00321). Unknown mechanisms enable 2nd wave viral populations spread at high temperatures. Earliest 2nd wave occurrences at high elevations (Armenia, Algeria) might not be circumstantial: high UV regimes, increasing mutation rates, might occasionally favour selection of temperature-adapted viruses.
3.7. Time since start of 1st wave for low slopes
Filled triangles in Figure 4 are for countries whose 1st wave slope fits better the increasing 2ndwave trend than the decreasing 1st wave trend (2nd wave onset date before country): 9/3 Guatemala, 13/3 Portugal, 18/3 Armenia, 21/3 Lithuania, North Macedonia, 23/3 Malta, 25/3 Oman, 26/3 Afghanistan, Kazakhstan, 27/3 Cuba, 29/3 Peru, 30/3 Bolivia, Kyrgyzstan, 4/4 Rwanda, 10/4 El Salvador, 2/5 Tajikistan. On 31/5, the mean time since 1st wave onset in these countries was 65.19 days, significantly less than 76.32 days since 1st wave onset in remaining countries that fit best the negative trend (two tailed t-test, P = 0.0228). Hence, 1st wave viral population dynamics evolved towards low spread.
3.8. Slopes and times since start of 1st and 2nd waves
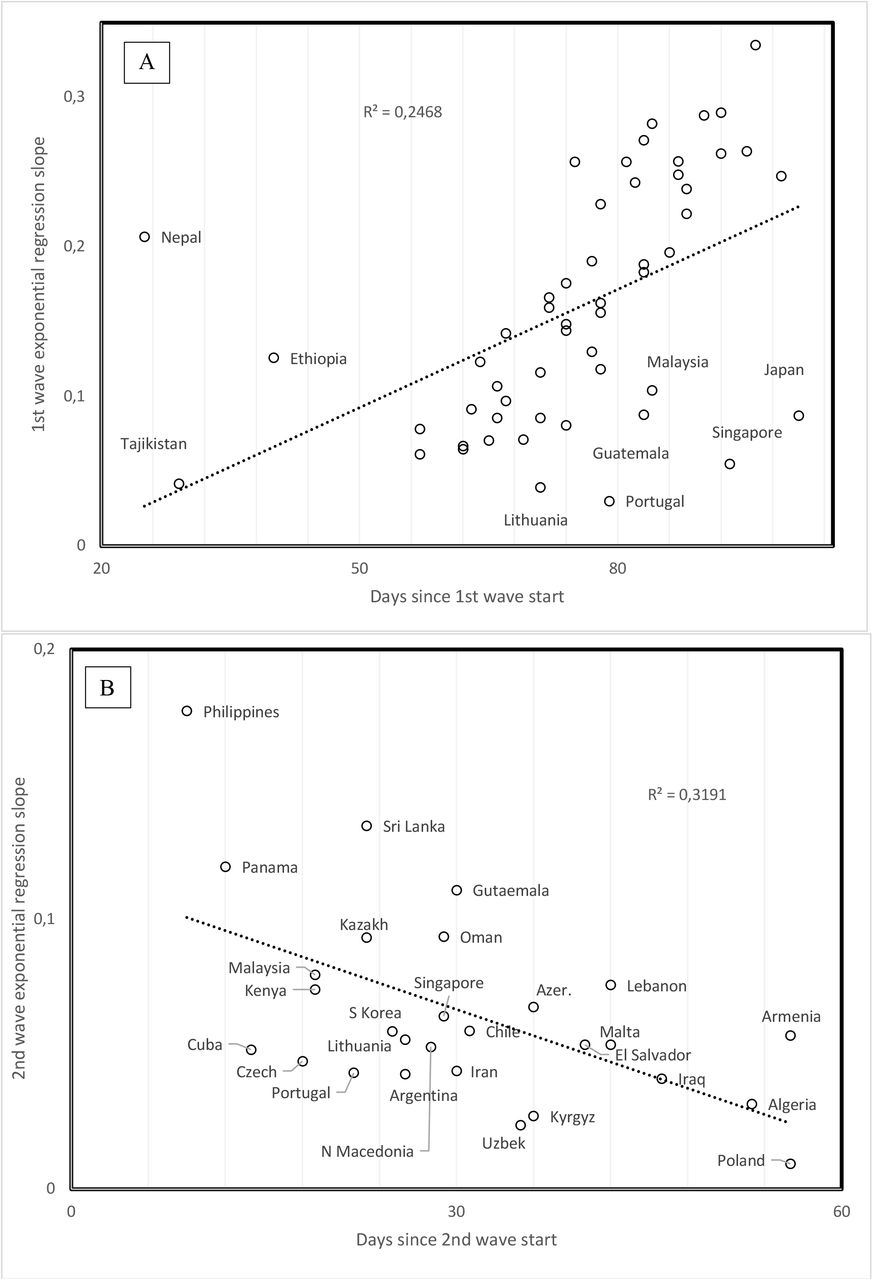
Time since 1st wave onset increases with spread slope (r = 0.4968, P = 0.00018, two tailed test, Figure 5a). More recent 1st waves have lower mortality rates (r = 0.4194, P = 0.002, two tailed test). Outliers with high slopes despite recent start associate with high elevation, outliers with low slope despite early 1stwave have developed marine commerce. Note that this trend observed across countries does not contradict results described above for specific countries where mortalities increase as compared to the first period of the 1st wave in that country. Time since 1st wave start could be a proxy of temperature, as early 1st waves occurred in February vs late ones in April. Seasonal temperature might decrease slopes at their start for countries that joined late the 1st wave. However, mean annual temperature across countries does not correlate with the time since 1st wave onset. Hence, the effect in Figure 5a seems independent from mean temperature.

Slope of daily increase in confirmed COVID-19 cases as a function of time since wave started for A. 1stand B. 2nd waves.
Considering that time is proportional to replication cycles of viral populations (Figure 2), results indicate that 1st wave viruses evolve towards lower slopes and mortalities at the level of comparisons between countries. This again contrasts with patterns for the 2nd wave, where time since 2nd wave onset correlates negatively with 2nd wave slope (r = −0.5649, P = 0.0026, two tailed test, Figure 5b). Mortality also tends to increase but this trend is not statistically significant (r = −0.2439, P = 0.2299, two tailed test). Hence, 2nd wave viral populations might increase their spread over time, possibly implying adaptation.
3.9. Elevation and population density
Mean country elevation correlates negatively with time since 1st wave onset (r = −0.6095, P = 0.0000016, two tailed test). This suggests that the pandemic reached later more elevated and possibly isolated countries. Low elevation also associates with ports and probable spread via marine commerce.
Notable is that no pandemic property (Table 1) correlate with population density. One would have expected that slopes increase with population densities, but this is not the case (1st wave: r = −0.1779, P = 0.2068; 2nd wave: r = 0.0128, P = 0.94845; two tailed tests). It seems that most COVID-19 cases are in dense urban centres. These densities might vary among different cities, but mean country does not reflect this. New York city and Singapore might have the same urban densities, but population densities for their respective countries vary due to differences in sizes of surrounding low population areas. Hence, no correlation could be observed using our simple method.
3.10. Median age and spread rates
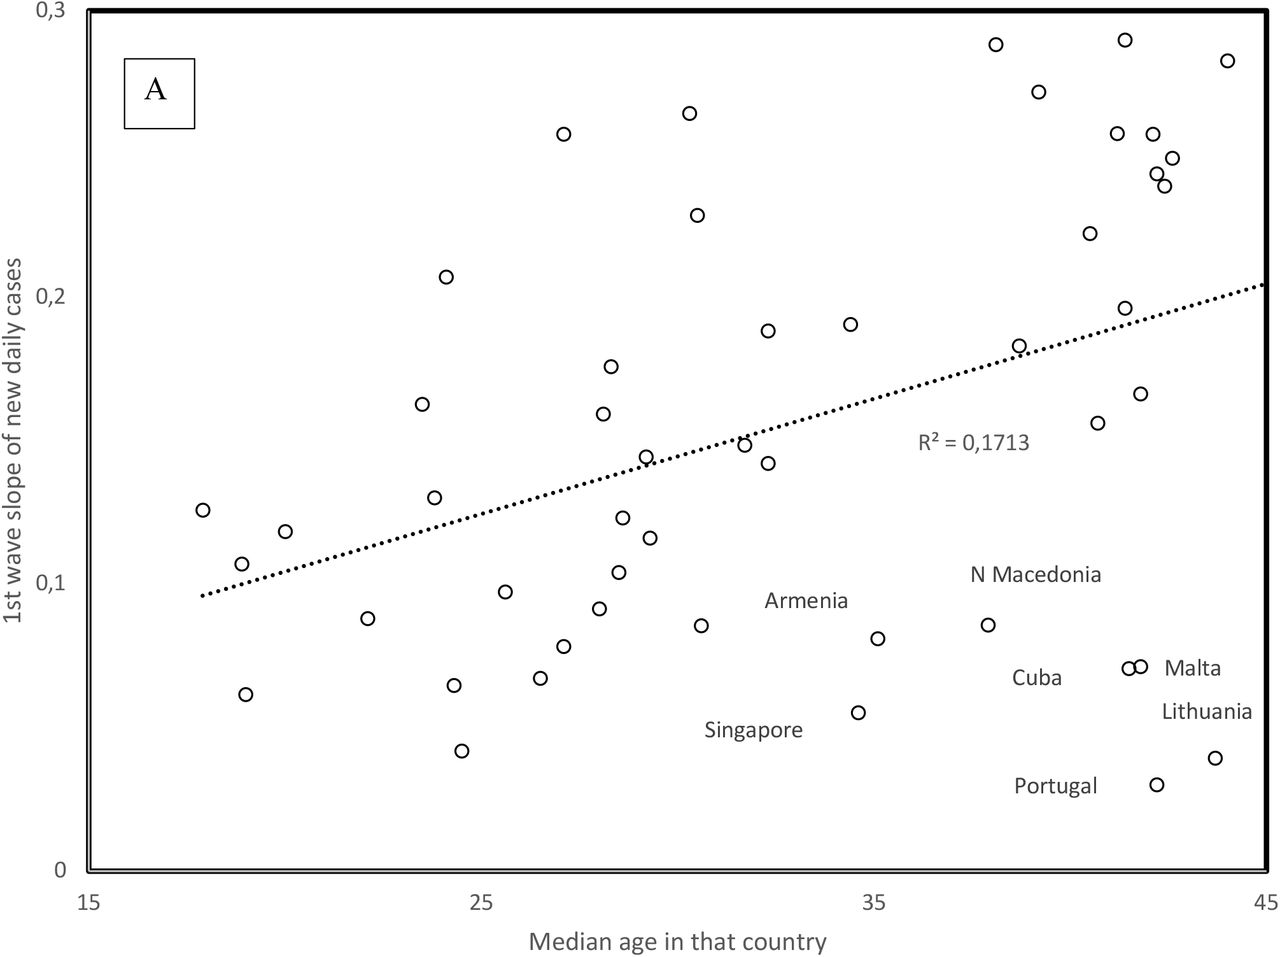
1st wave virus strains hit mainly the elderly. Hence the positive correlation between slope and median population age in Figure 6a (r = 0.414, one tailed P = 0.0011) fits the expected higher contagiousness in ageing populations. Note outliers as indicated in Figure 6a. For the 2nd wave, the opposite association occurs: slopes are highest for countries with low median age (r = −0.418, two tailed P = 0.0023, Figure 6b). This new information is crucial for future management of the pandemic: 2nd wave viruses apparently adapted to infect the larger reservoir of potential younger hosts, in addition to adapting to spread at higher temperatures.


1st (A) and 2nd (B) wave slopes as a function of country median age. For 2nd wave slopes, the figure plots the residual values after adjusting 2nd wave slopes for time since 2nd wave start (regression in Figure 4B), the main correlate of 2nd wave slopes.
Data gathered after 31/5 find 2nd waves in additional countries. For countries with median ages above 36 years (Bulgaria, Japan, Moldova, Serbia, Sweden, Ukraine), the trend for these 2nd wave slopes fits that observed for the 1st wave slopes as a function of median age in Figure 6a. This indicates that in these countries with late 2nd wave onset and high median age, viruses only adapted to seasonal temperature increase, but not to the relatively few young in these populations. In some countries, the 2nd wave might be an artefact due to sudden policy changes such as increasing daily test numbers, which increase numbers of new reported cases, but do not reflect any biological change. Other 2ndwave slopes estimated after 31/5 fit the trend in Figure 6b for Bahrain, Democratic Republic of Congo, Ghana, Guatemala, Iran, Israel, and Jordan. These patterns could be explained by policy differences between countries. Our interpretation remains biological, and suggests that viruses evolve in relation to host populations and climatic conditions because country-specific sampling artefacts are unlikely to produce overall patterns across countries such as those in Figures 5 and 6.
3. Discussion
Analyses confirm that the spread of 1st wave COVID-19 decreases with temperature. They indicate that UV also decreases the spread of 1st wave COVID-19. 2nd wave COVID-19 is characterized by a lower spread and mortalities lower than for the comparable period for 1st waves, and by infecting younger age classes. 2nd wave spread increases with temperature.
This inversion of trends between 1st and 2nd waves, at a 1-2 months interval, is highly peculiar. The possibility that a different virus was cryptic and minor during the 1st wave and became dominant as conditions changed during the 2nd wave, cannot be excluded. However, trends with time and mutation numbers suggest that a specific virus evolved from one state to another. The earliest 2nd waves, in high elevation countries, suggest UV-induced high mutation rates hastened adaptation.
Note that analyses determined clear patterns in relation to various cofactors of the pandemic, despite uncertainties in data. For example, reported over unreported cases ratio [10] apparently vary hugely between countries depending on their mode of counting and public health policy, rendering predictions for the future of the pandemic highly uncertain. For the 1st wave, within countries, mortalities increased despite the general trend across countries for decrease of mortality over time. It is too early for exploring 2nd wave-associated patterns within countries regarding the evolution of mortalities over time, and in relation to symptoms developed in the young. A 3rd wave may combine 1st wave high spread (and mortality) and 2nd wave tolerance for high temperature. A striking major point is unexplained and open for more optimistic interpretations from a health-oriented point of view. Usually, strains with high spread replace those with low spread. However, low spread 2nd wave viruses replace in an increasing number of countries fast spread 1st wave viruses. Hence, accepted knowledge in relation to epidemics seems inadequate regarding the current pandemic. Hence, prognostics and interpretations of observed patterns, whether pessimistic or optimistic, cannot be trusted, as these are based on previous knowledge that contradicts the current fast-to-slow spread evolution of COVID-19.
Data Availability
All data are available in the manuscript
Author Contributions
Conceptualization, methodology, investigation, J.D., S.Y., H.S.; resources, J.D., S.Y., H.S.; data curation, S.Y., H.S.; writing—original draft preparation, H.S.; writing—review and editing, J.D. All authors have read and agreed to the published version of the manuscript.
Funding
This research received no external funding
Conflicts of Interest
The authors declare no conflict of interest.


