
Abstract
Social multipliers occur when individual actions influence other individual actions so as to lead to amplified aggregate effects. Epidemic infections offer a dramatic example of this phenomenon since individual actions such as social distancing and masking that have small effects on individuals’ risk can have very large effects in reducing risk when they are widely adopted. This paper uses the info-metric method of constrained maximum entropy modeling to estimate the impact of social multiplier effects in the Covid-19 epidemic with a model that infers the length of infection, the rate of mortality, the base infection factor, and reductions in the infection factor due to changes in social behavior from data on daily infections and deaths. When the model takes account of the rate of reporting of infections, it can produce three rather different scenarios of epidemic dynamics, which have marginally different posterior probabilities: one in which reporting is very low, under 10% and the estimated infection is correspondingly large, and immunity effects play a significant role in stabilizing the epidemic; a second in which reporting is on the order of 25% and the model estimates a significant portion of the population as having inherent immunity to the infection; and a third where reporting rates are close to 100%, and the epidemic is controlled mostly by changes in social behavior. These qualitatively different scenarios reflect the limited data the method can extract information from in this case.
1 Introduction
The phenomenon of social multipliers, social interactions in which the impact of individual behavioral decisions have amplified social effects due to their impact on other members of society, are a pervasive feature of economic and social life. Social multiplier effects dominate important social-economic phenomena such as the determination of aggregate demand and employment in capitalist economies, asset prices in speculative markets, financial and economic crises, revolutionary political movements, and traffic congestion. In viral epidemics the social multiplier effect appears because individuals’ attempts to protect themselves against infection through social isolation, reduced social contact, and masking have a multiplied impact on the social spread of infection by changing the probability of that an infectious individual will infect others. The case of Covid-19 is particularly instructive in this respect, because the mean length of the infectious period of the disease is relatively short, on the order of 5-10 days, but it is so infectious that its spread through aerosols and other mechanisms in public spaces can double the number of infected also in a matter of days. Under these circumstances even small changes in behavior will have greatly amplified effects on the spread an epidemic on a short time horizon through the social multiplier. Each individual can do very little to protect themselves from a widespread and rapidly growing epidemic, but the collective effect of changes in social behavior that reduce the probability of infections can rapidly bring the epidemic under control.
This paper presents a method for the empirical analysis of epidemic statistics consisting of daily reports of new infections and deaths, and applies the model to data on national Covid-19 epidemics from the European Center for Disease Prevention and Control database. The method is the constrained maximum entropy framework described by [2]. In the context of epidemic modeling, this framework provides a method for estimating the unobserved daily rate of infection together with estimates of the fraction of infections reported as “confirmed”, and average recovery and mortality rates from daily reports of new confirmed infections and deaths.
The results of this study identify the expected length of Covid-19 infectiousness as on the order of 5-10 days, and the base infection factor as on the order of two new infections per existing infection. The qualitative pattern of infection dynamics is quite sensitive to the estimate of the reporting rate, which is only weakly identified by the model using this limited data. If the reporting rate is constrained to be close to 100%, the model estimates small epidemics with high death rates which are brought under control primarily by changes in social behavior. If the reporting rate is estimated without constraint, the model for many cases estimates a reporting rate under 10%, resulting in a very large estimated epidemic with a lower death rate, which is brought under control in part by the reduction in the susceptible population. Constraining the reporting rate to an intermediate level of around 25% introduces another qualitative change: in these runs the model estimates a significant part of the population is inherently immune or resistant to infection to begin with, and this fact also contributes to the control of the epidemic through reduction in the susceptible population,.
2 Epidemic modeling
2.1 SIR Model
On a given day of an epidemic t = 1,…,T, let St ≥ 0 be the proportion of a population uninfected and therefore susceptible, Ft, ≥ 0 the proportion of the population infected and infectious, and Rt =1 − St, −Ft the proportion of the population either recovered or died, and therefore unsusceptible. T is the number of days over which the model tracks the epidemic, starting from day 1.
These variables follow the deterministic laws:


Here rt is the infection rate for an encounter between a susceptible and infected person given the pattern of social behavior at day t, and m and d are the recovery and death rates for infections, which apply uniformly to the current infected population. In this context m is the rate at which an infected individual stops being infectious, not necessarily the rate at which infected individuals become symptom-free. This is a version of the well-known SIR dynamic model of epidemics [3]. (For a discussion of some of the limits of the SIR model, see [1].)
This type of geometric recovery and death rate implies that the expected length of an infection is  .
.
This model assumes that recoveries and deaths occur uniformly among the stock of currently infected individuals, which is at best an approximation, since we know the likelihood of recovery or death in fact depend on the length of the infection. Given the limitations of the data we have to work with, this approximation seems unavoidable, and the model fits reported below indicate that it does not compromise the ability of the model to track epidemics.
2.1.1 Dynamic analysis
This stripped down SIR model is a two-dimensional discrete-time nonlinear dynamical system. The linear approximation to this dynamical system is:

The eigenvalues of this system at Ft =0 are inside the unit circle, and therefore stable, if rtSt <m + d or  . When this condition is met, epidemics die out because the reproduction factor for infections is less than unity. The model parameters rt are the daily rate of infections, and to translate them into the more frequently used infection factor it is necessary to multiply the daily infection rate by the expected length of an infection in days,
  .
.
2.2 Constrained maximum entropy modeling
Constrained maximum entropy (CME) modeling representsthe theoretical principles defining the system that produced the data as constraints. These constraints restrict the set of joint probability distributions over the states of the system, but typically the constraints are not sufficient to determine the joint probability distribution. The resulting underdetermination is formally resolved byrankingthefeasiblejointprobabilitydistributionsaccordingtotheirShannon information entropy. The feasible joint probability distribution with the highest informational entropy is the CME estimate of the system’s unobserved states. Ranking probability distributions by their informational entropy ensures that all the information shaping the result enters through the explicit constraints.
In the case of epidemic modeling in this paper the explicit CME formalism is:


Here utr,vtr are error frequency distributions over the M-dimensional supports qr,sr, the expectations of which constitute the errors in fitting the observed daily data on infections, xt, and mortality, yt, given the fraction of actual infections reported as “confirmed”, b. The supports are chosen symmetrically to include three (this factor appears in the documentation as the “supportwidth” parameter) standard deviations of the corresponding data series, so that the maximum entropy of the frequency distributions corresponds to zero errors, or, equivalently, errors require a reduction in the entropy of the frequency distributions. The maximization of entropy of the error frequency distributions implies minimization of the errors.
The objective function has three other terms.
The first penalizes the variation in rt represented by the square of second differences. The weight on this factor in the simulations below is γ = 1000, which results in smoothing daily fluctuations in the estimated infection rates. Experimentation indicates that the qualitative results of the simulations are robust to variations in this parameter.
The second additional term penalizes the deviation of the daily infection rate, rt below the base infection rate, r0. The idea is that changing social behavior to depress rt below the base level r0 requires social “force” similar to the physical force depressing a spring, and results in a potential energy  , which trades off against the entropy of the frequency distributions of error terms on the observed data. This off-setting force we call resistance. The reduction in the daily infection rate, which turns out to be critical to the stabilization of most of the epidemics for which we have data in the source for this paper, is partly a spontaneous reaction of individuals to their recognition that an epidemic is spreading by reducing their exposure, and partly a social response mediated by legal guidelines and the development of social norms concerning masking, social distancing, and the like. Since these changes in behavior have substantial economic and other costs, it makes sense to include a parameter such as k to represent those costs. In the simulations reported below typically
  , a value that is in a range that produces enough resistance to changing social behavior to require a reasonable level for the infection factor
  .
.
The inclusion of this term is also necessary to allow the model to identify the base infection level, r0. The only evidence available on which to make an estimate of this base infection rate is the growth of new infections in the first few days of the epidemic, before changes in social behavior have begun to affect rt. But the number of new infections is an inherently noisy variable, and estimates of r0 through extrapolation of the number of new infections turns out to be highly unstable empirically. The inclusion of the resistance in the objective function has the effect of making the estimates of the daily infection rate in the days before the epidemic takes hold uniform over time, and of stabilizing these estimates.
The third additional term allows for a prior distribution  on the reporting rate parameter b. In some simulations α =0 and the parameter b is constrained directly to exceed some lower bound.
The logic of the simulation method is as follows. We have data on observed new infections, xt, and deaths, yt, for T days, and want to infer the history of the epidemic, the vectors {St} and {Ft}, the unobserved daily infection rates, {rt} and the parameters r0, m, d, b, by finding the values of these parameters that maximize the sum of the entropy of the error distributions and the penalty functions subject to the constraints (4).1
2.3 Example 1: United States
Figure 1 shows the results of the simulation for data from the United States. The model estimates the average duration of the disease as about 4.5 days, the proportion of cases resulting in death as .3%, the infection factor without changes in social behavior about 1.6, the resulting herd immunity threshold as requiring 37% of the population to be immune to suppress the epidemic, and the reporting rate at the lower limit of the constraint interval to be 10%.

Simulation for the U.S. The heading documents the country and period of the simulation, reports the estimated mean length of the disease in days,  , the estimated proportion of cases leading to death,
  , the estimated infection factor,
  , the implied threshold herd immunity (the proportion of the population that has to be immune to drive the infection factor below 1),
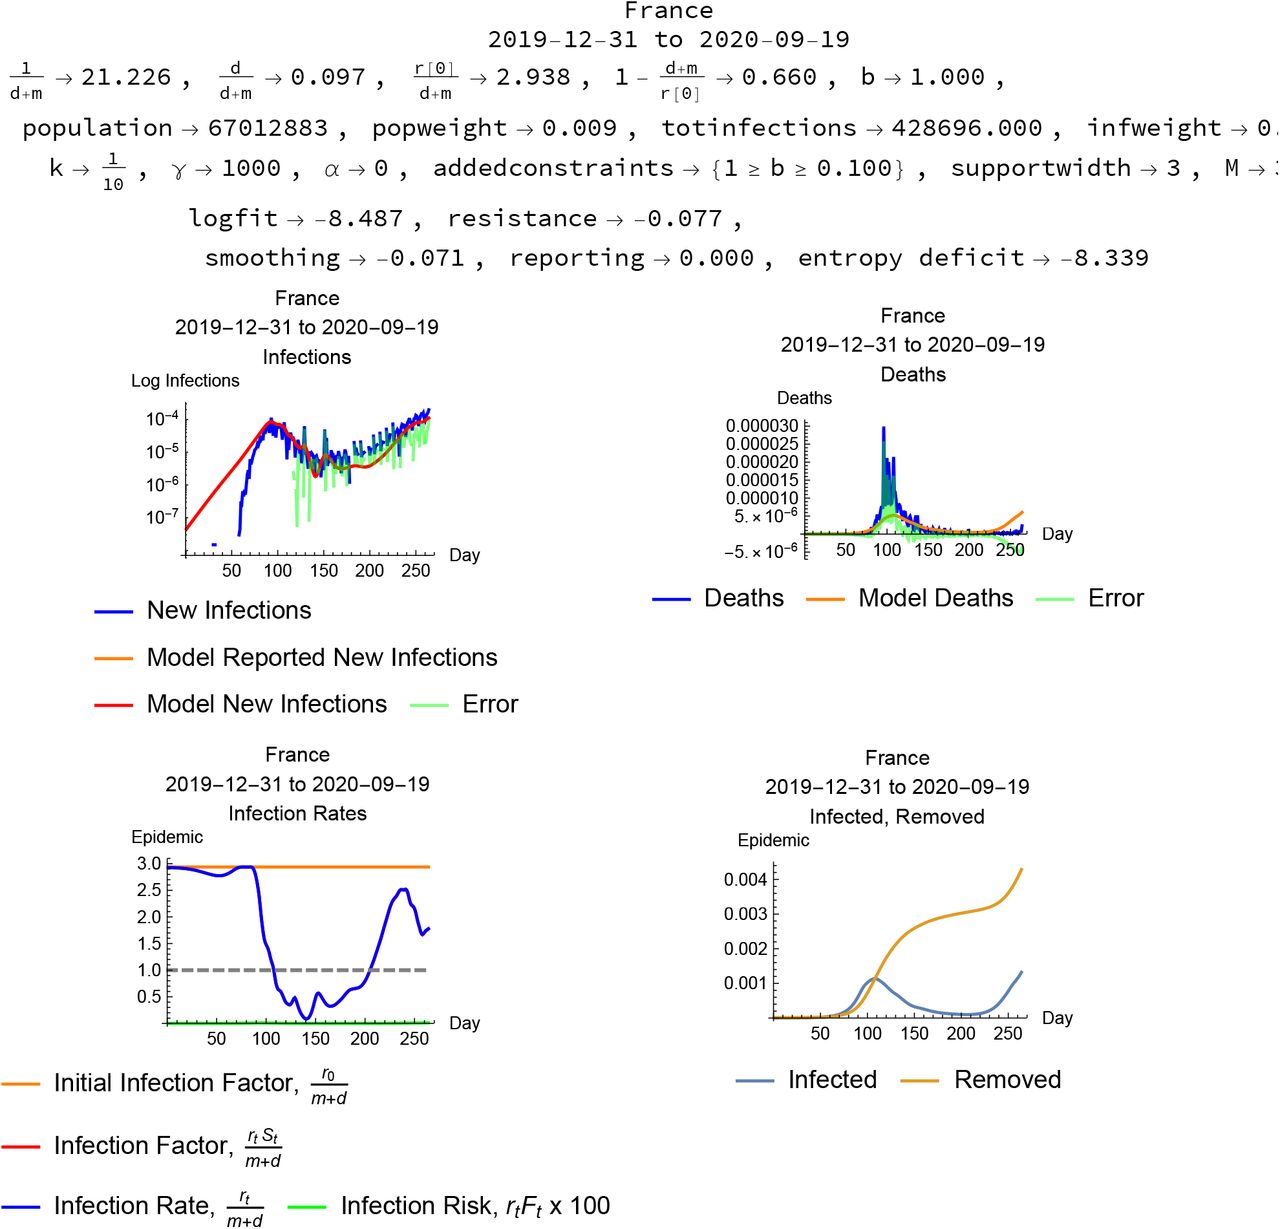
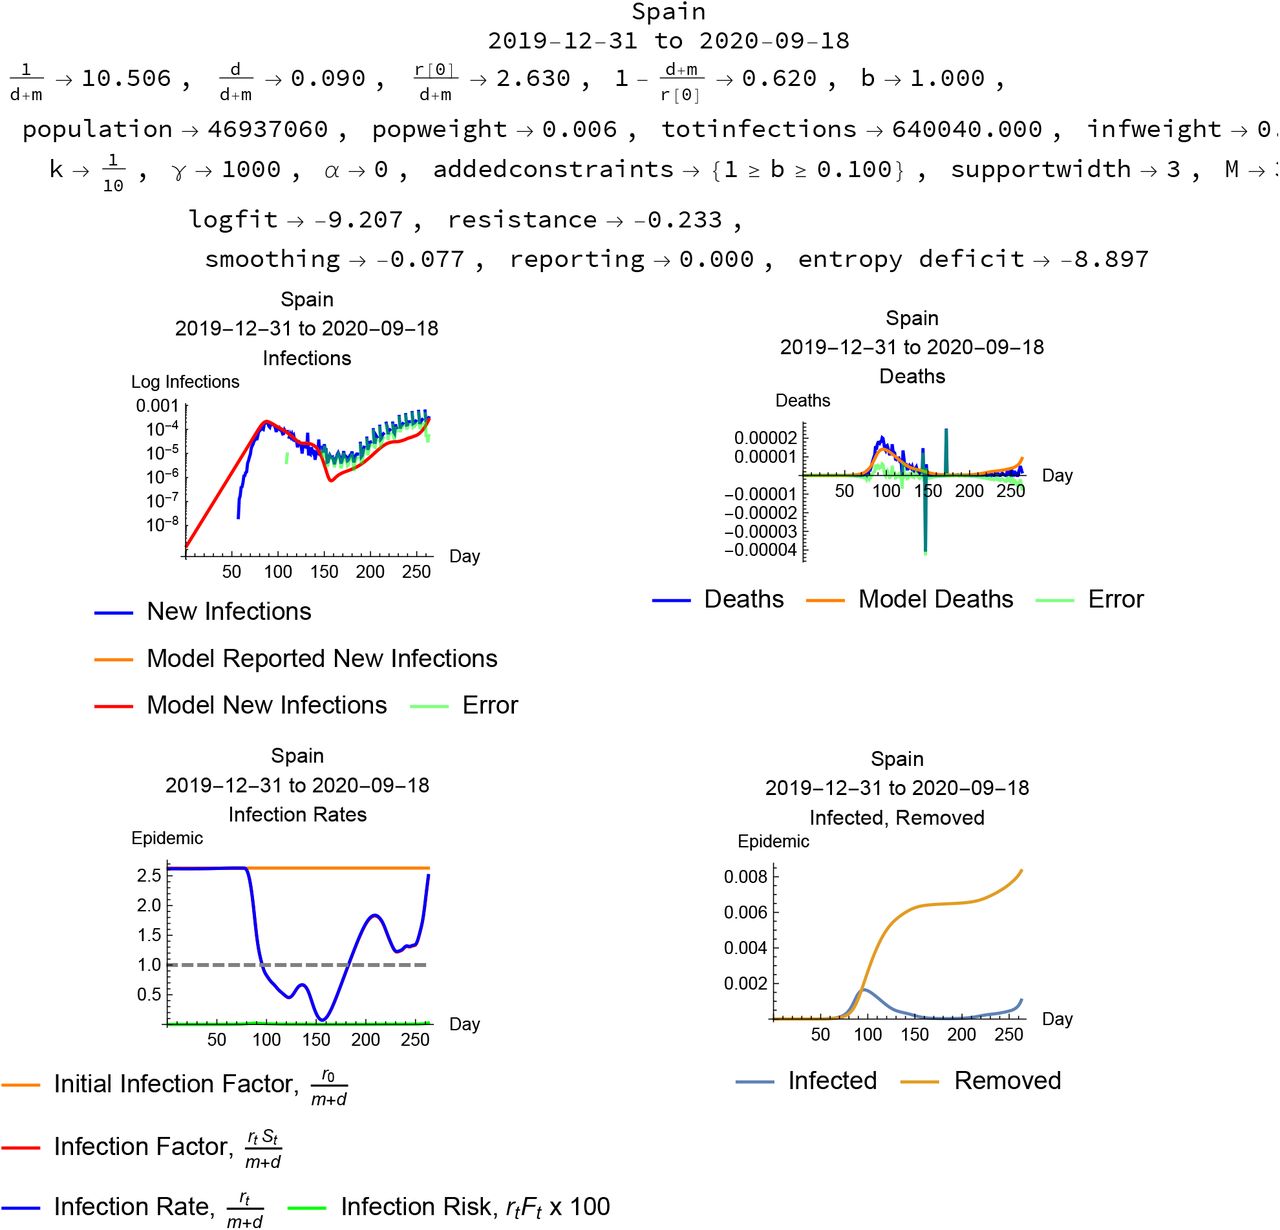
  , the estimated reporting rate, the population and population as a pro-portion of the data sample, total infections and total infections as a proportion of the sample, and the parameters used for the simulation. The upper-left plot shows observed new infections per day in blue, the model simulated new infections in orange, and the errors in green; the upper-right plot shows the same time series for deaths. The lower-left plot shows the estimated initial infection factor in orange, the estimated daily infection factor in red and infection rate in blue, and the daily infection risk multiplied by 100 in green. The lower-right plot shows the time series of the proportion of the population infected in blue, and the proportion removed from susceptibility through recovery or death in orange. All the plots have the days of the epidemic on the horizontal axis.
The plots visualize the modeling of the epidemic. The upper-left and upper-right plots show the actual daily observed new infections and deaths in blue with the model in orange and the resulting errors in green. The general fit, which has to accommodate both the infection and mortality data, is convincing. The lower-left plot shows the initial infection factor as a horizontal orange line, and the daily infection factors and rates (which diverge in this simulation because eventually 20% of the population is estimated to be removed from the pool of susceptibles through infection and recovery or death) in red and blue, with the infection risk to susceptibles plotted in green, scaled up by a factor of 100 to show up on the plot. The lower-right plot summarizes the epidemic dynamics in the proportion infected in blue and the proportion removed through recovery or death in orange.
An important feature of this simulation is that it indicates that the epidemic in the U.S. was controlled, to the extent it was controlled, by both changes in social behavior that reduced the infection factor, and by herd immunity exhausting the pool of individuals susceptible to the infection. The red and blue curves in the lower-left plot dramatically record the fall in the infection rate a few days after the infection began to take hole, as well as a rebound in the infection rate after the first peak of the epidemic.
2.4 Example 2: New York City
Data on infections and deaths from Covid-19 are also available for New York City, from https://www1.nyc.gov/site/doh/covid/covid-19-data.page, accessed August 23, 2020.
Figure 2 shows the results of the simulat0ion for data from New York City with no constraint on the reporting rate. The model estimates the average duration of the disease as about 6.5 days, the proportion of cases resulting in death as .4%, the infection factor without changes in social behavior about 2/4, and the resulting herd immunity threshold as requiring 59% of the population to be immune to suppress the epidemic. The reporting rate is estimated at about 4%, implying that for every “confirmed” infection there were about 25 unreported further infections. This simulation implies a very large epidemic eventually controlled by an approach to herd immunity with close to 60% of the population removed from the pool of susceptibles by recovery or death. (The resolution of the time series information on which this simulation is based makes the identification of re-infection as a significant factor problematic.) Retrospective serological tests for antibodies in New York City, by contrast, report at most about 20% of the population with antibodies indicating infection.

Simulation for New York City with no constraint on the reporting rate. The report has the same format as Figure 1.
Figures 3 and 4 illustrate the sensitivity of the simulations to constraints on the reporting rate, and, as a result, constraints on the size of the simulated epidemic.

Simulation for New York City with reporting rate constrained to be above 20%.

Simulation for New York City with reporting rate constrained to be above 100%.
Figure 3 constrains the reporting rate to be above 8%, and the program maximizes the posterior probability at the lower bound b = .08, which results in essentially the same estimate of the length of the infection as the unconstrained simulation, a smaller epidemic with a higher death rate, a higher base infection rate implying ahigherherdimmunitythresholdofcloseto70%. This simulation also takes advantage of the fact that the initial susceptible proportion of the population is unconstrained, and estimates that close to 40% of the population is immune or resistant to infection at the start of the epidemic. In this scenario the epidemic is brought under control by an initial change in social behavior and eventual herd immunity.
Figure 4 constrains the reporting rate to be above 100%, and the program maximizes the posterior probability at the lower bound 1, which results in essentially the same estimate of the length of the infection as the unconstrained simulation, a smaller epidemic with a higher death rate, a base infection rate close to that estimated for a reporting rate of 4%, implying a similar herd immunity threshold of close to 50%. An important feature of this simulation is that it indicates that the epidemic in the New York was controlled, to the extent it was controlled, by changes in social behavior that reduced the infection factor, not by herd immunity exhausting the pool of individuals susceptible to the infection. The red and blue curves in the lower-left plot dramatically record the fall in the infection rate a few days after the infection began to take hold, as well as a gradual rebound in the infection rate after the peak of the epidemic, though the risk of infection remains quite low due to the small number of infectious individuals.
The differences in the reported log fits correspond to differences in log posterior probability among these simulations, which give us an idea of how strong the evidence from limited time series data is for different reporting rates. For example, the difference in log fit between the simulations constraining b ≥ 1 and not constraining b is −1.805 − (−2.504) = .7, which implies a ratio of the posterior probabilities of about 2. This represents some, but limited, evidence for a low reporting rate. (Computing the posterior probabilities themselves involves the computationally burdensome task of normalizing the posterior kernel.)
The uncertainty with which the method estimates the reporting rate and the size of the epidemic reflect limitations of the time series data we have as input. Although the CME method extracts all the information available from a data set and model, there is only so much information to be extracted. Further insight depends on adding further information in the form of constraints.
3 Cross-country statistics
Data from the European Center for Disease Prevention and Control reports daily infection and mortality counts for 209 countries. The program reports errors or times out on some of these country data sets, but usable simulations result in countries. Some of these cases report small total numbers of infections. Summary statistics for the modeling of the 81 country epidemics reporting more than 10,000 infections are reported in Table 1.
Infection-weighted median values of the epidemic parameters together with a 50% confidence interval based on the interquartile range for each, computed from the empirical distributions of the parameter estimates for 81 country epidemics reporting more than 10,000 total infections in the European Center for Disease Prevention and Control Covid-19 database for 31 December, 2019 to 19 September 2020.
The estimates, which depend on extrapolating early phases of epidemics, are predictably quite noisy, but the medians, 4.7 days for the expected infectious period, a 10% mortality rate among the infected, and a base infection factor 1.66, are within ranges frequently reported for these parameters. This method reports a somewhat shorter, less infectious, but more lethal disease than some other estimates.
4 Country cases
Some national epidemics show basically the same pattern as the United States: an estimate of infection length between 4 and 12 days, an infection factor between 1.5 and 3, and a sharp drop in the daily infection factor presumably as a result of changes in social behavior such as isolation and masking motivated by a combination of individual protection and social norms backed up public policy. In many instances the model estimates that the infection factor rises again after a fall in infections, in some cases heralding a resurgence of the infection. Some national epidemics scenarios attribute a significant role in controlling epidemics to removal of a significant part of the population from the pool of susceptibles through recovery or death. These simulations all constrain the reporting rate to be between 10% and 100%, and in several cases the simulation maximizes the log fit at one or the other of these bounds.
A selection of these cases appears here in Figures 5–10.

China. The sharp spikes in the infection and mortality data represent outliers that are excluded from the model simulation constraints.

Italy

France

Spain

Germany

Russia
4.1 Anomalous cases
Some country epidemic data result in very short (less than one day) or very long (over fifty days) infection lengths even with a constraint on the reporting ratio. Some of these cases are presented in Figures 12–??.

United Kingdom

Brazil, modeled with infection length constraint and reporting constraint.

Mexico, modeled with reporting constraint.

Sweden, modeled with reporting constraint.

India, modeled with reporting constraint.
The data from India cannot be modeled successfully with the infection length constraint. The Indian case modeled without constraints is presented in Figure
5 Conclusion and discussion
The results of this modeling effort point to some conclusions both at the level of method and at the level of understanding the social aspects of an epidemic.
The model uses limited and noisy data, and reflects both the limitations of conclusions that can be drawn from the data and the potential of the info-metric constrained maximum entropy methods to extract whatever information a data set may contain. It is particularly striking that in many cases the constrained maximum entropy model allows us to draw fairly strong inferences about the behavior of unobserved, or not directly observed, variables like the daily infection factor without making strong assumptions such as linearity. There are undoubtedly numerous other ways to approach these same data sets with the CME methods, so it would be a mistake to argue that any particular CME model exhausts the information in the data, but given the constraints constituting any particular model the CME approach does promise to extract all the information available in that framework.
The epidemiological results of this exploration reflect limits not only of the quality and extent of the data but also of the specific constraints. In this case the greatest uncertainties arise because estimates of reporting rates, base infection factors and the length of the infectious period have to rest on extrapolation from limited observations of the initial stages of each epidemic and, as a result, are themselves fairly noisy. Nonetheless, the general thrust of the results seems to constitute a strong presumptive case that infections like Covid-19, which have a half-life of infectiousness measured in a few days and are infectious enough to create an epidemic, are extremely sensitive to changes in social behavior. Whether or epidemics have been controlled primarily by changes in social behavior or to a considerable degree by exhaustion of the pool of susceptible individuals depends on uncertain estimates of the reporting rate. The simulations strongly support the view that any measures that reduce infectiousness below the stability threshold can stabilize the epidemic in a relatively short time span due to the social multiplier effects outlined above. The other side of this coin, of course, is that relaxation of social distancing that allows the infection factor to rise above unity leaves the society vulnerable to a resurgence of the infection.
Covid-19 is a particularly intractable phenomenon precisely because it is not very infective but it is quite lethal. Its infection rate is not high enough to establish herd immunity without tolerating loss of life on a scale unacceptable to many societies. Fortunately an understanding of the social multiplier dynamics governing the infection show that relatively low-cost measures to reduce the infection factor can be remarkably effective in suppressing the disease.
Data Availability
Data is publicly available from sources cited in the paper.
Footnotes
Link to the Mathematica notebook documenting the methods has been added. A parameter representing the rate at which infections are reported as confirmed has been added to the model: estimates of this parameter can have significant qualitative impact on the simulations, including an increased role of immunity in controlling epidemics and the estimation of significant initial levels of population immunity to the infection.
↵1 A Mathematica notebook containing the programs used to generate these results is available for download at https://www.dropbox.com/s/47vw72j9vgooiff/EpidemicCMEModel20200926.nb?dl=0. The notebook is also available as supplementary material at the medRxiv server.


