
Abstract
Introduction SARS-CoV-2 has spread rapidly across the world yet the first pandemic waves in many low-income countries appeared milder than initially forecasted through mathematical models. Hypotheses for this observed difference include under-ascertainment of cases and deaths, country population age structure, and immune modulation secondary to exposure to endemic parasitic infections. We conducted a country-level ecological study to describe patterns in key SARS-CoV-2 outcomes by country and region and to explore possible associations of the potential explanatory factors with these outcomes.
Methods We collected publicly available data at country level and compared them using standardisation techniques. We then explored the association between exposures and outcomes using alternative approaches: random forest (RF) regression and linear (LM) regression. We adjusted for potential confounders and plausible effect modifications.
Results Altogether, data on the mean time-varying reproduction number (mean Rt) were available for 153 countries, but standardised averages for the age of cases and deaths and for the case-fatality ratio (CFR) could only be computed for 61, 39 and 31 countries respectively. While mean Rt was highest in the WHO Europe and Americas regions, median age of death was lower in the Africa region even after standardisation, with broadly similar CFR. Population age was strongly associated with mean Rt and the age-standardised median age of observed cases and deaths in both RF and LM models. The models highlighted other plausible roles of population density, testing intensity and co-morbidity prevalence, but yielded uncertain results as regards exposure to common parasitic infections.
Conclusions The average age of a population seems to be an important country-level factor explaining both transmissibility and the median age of observed cases and deaths, even after age-standardisation. Potential associations between endemic infections and COVID-19 are worthy of further exploration but seem unlikely, from this analysis, to be key drivers of the variation in observed COVID-19 epidemic trends. Our study was limited by the availability of outcome data and its causally uncertain ecological design, with the observed distribution of age amongst reported cases and deaths suggesting key differences in surveillance and testing strategy and capacity by country and the representativeness of case reporting of infection. Research at subnational and individual level is needed to explore hypotheses further.
Introduction
Since the end of 2019, the Coronavirus Disease 2019 (COVID-19), caused by the novel coronavirus SARS-CoV-2, has spread rapidly across the world, resulting in considerable morbidity and mortality, with more than 107 million cases and 2.37 million deaths reported globally as of February 11, 2021 (1).
Nevertheless, the COVID-19 pandemic has affected countries differently, with marked geographical disparities in the observed burden of cases and associated deaths. While the American continent bears the highest burden of cases and fatalities ascertained to date, African countries seem relatively spared, making up 2.5% of global cases and 2.9% of the global death toll despite accounting for 14% of the global population (2, 3). Indeed, the first pandemic waves in many low-income countries (LICs) appeared milder than initially forecasted (4–8).
Many hypotheses have been put forward to explain country differences in epidemic trajectory and magnitude. Weaker health systems with inequities in access and limited testing capacity may have resulted in the under-ascertainment of cases and deaths, the degree of which is uncertain (9).The forewarning from other health systems that were quickly overwhelmed in China and Europe may have led to comparatively earlier introduction of control measures relative to SARS-C-V-2 introduction in some LICs, increased stringency in application of these measures, and thus partial suppression of community transmission (10, 11).
In LICs, a younger population age structure could have had implications for virus transmission as well as having lower the infection fatality ratios due to a smaller proportion of older individuals who are most vulnerable to severe disease (12–14). In addition, efforts to shield older individuals in settings with younger populations may have been more effective due to a lower absolute number of individuals needing to be shielded. However, the increasingly multi-generational and larger households observed in less wealthy countries may offset this effect and increase the risk of exposure to older individuals (15). Furthermore, populations may have a lower prevalence of comorbidities that increase the risk of death with COVID-19 (16).
It has also been postulated that greater lifetime exposure to common infections in LIC populations may confer some immune protection from SARS-CoV-2 through a more diverse and competitive microbiome, more effective non-specific immune response and decreased likelihood of the ‘cytokine storm’ seen in severe COVID-19 disease (10, 17). Parasites such as Plasmodium spp. and soil-transmitted helminths, to which many LIC populations are exposed since early childhood, have immunomodulatory effects (18, 19). Access to improved water and sanitation may be a distal factor related to exposure to these parasites. Population density and household size are typical drivers of person-to-person disease transmission (20, 21).
There is little evidence for the relative influence of these hypothesised factors on the observed heterogeneity in epidemic trends around the world. In Figure 1, we propose a causal framework for understanding the relationship between potential explanatory factors, including those related to the hypotheses described above, and the outcomes of transmissibility, age-distribution of cases and deaths, and case-fatality of SARS-CoV-2 at the population level.

Proposed causal framework of factors determining SARS-CoV-2 transmissibility and COVID-19 disease outcomes. Boxes coloured in pink=outcome variables; boxes coloured in blue=exposures of interest; boxes coloured in green=covariates for which we obtained data; boxes coloured in grey=covariates and intermediate outcome variables for which we didn’t obtain data. Dotted lines represent hypotheses explored in this study.
We conducted a country-level ecological study to describe patterns in key SARS-CoV-2 outcomes by country and region, and explore possible associations of these outcomes with potential explanatory factors.
Methods
Study population and period
We considered data from each country in the world, as available; observed COVID-19 burden data from March to October 2020 were included. Analysis units included 193 United Nations member states plus the State of Palestine, Holy See and Hong Kong Special Administrative Region. Dependent territories and other entities were excluded due to inconsistencies in reporting.
Independent variables
We sought publicly available data on indicators plausibly representing each of the domains in the causal framework (e.g., the Human Development Index was used for the level of development of a country; domains for which we could not identify suitable indicators are coloured in grey in Figure 1). Information on the indicators used and data sources is summarised in Table 1 and detailed in the Supplementary File.
Summary of included variables, indicators and sources of data.
Outcome variables
Transmissibility
We sourced time-varying reproduction numbers (Rt) by country, as estimated on a real-time basis by the Imperial College London COVID-19 Response Team (22). A characteristic of these estimates is that they are informed by the dynamics of observed COVID-19 deaths rather than cases, which are less likely to be detected and more susceptible to fluctuations in ascertainment over time due to changes in testing regimens. We averaged Rt estimates over our analysis period (March-October), from the day when 50 cumulative deaths were reported. This was to ensure that these averages were not overly influenced by the prior distribution for Rt used to inform the Bayesian framework for Rt estimation (itself highly dependent on observations during the first days and weeks of observed transmission).
Age of observed cases and deaths
We conducted a systematic search of each country’s national COVID-19 website (e.g., Ministry of Health dashboard) or regional surveillance reports (e.g., produced by the African Centres for Disease Control and Prevention) for overall and age-stratified COVID-19 case and death data. Age-specific data on cases were available from 61 countries and age-specific data on deaths from 39 countries; 35 countries reported both values. For each country we present a “standardised median age” indicator interpretable as the median age of cases or deaths if the country’s observed age-specific cumulative incidence or death rates were applied to the world’s population age structure (23). Further detail can be found in Supplementary File 1.
Case-fatality ratio
After omitting countries with <50 total observed cases, we computed a crude case-fatality ratio (CFR) for each country by dividing observed deaths by cases. For countries with available age-specific data, we computed (i) an ‘age-standardised’ CFR, derived as above by applying countries’ age-specific crude CFRs to the world’s population structure; and (ii) an ‘incidence-standardised’ CFR, derived by applying each country’s age-specific CFRs to the observed age-specific caseload in South Korea, selected as a reference due to this country’s reportedly high coverage of case detection (i.e. relatively low selection bias affecting the profile of observed cases) and standard of care (24). The chosen standardisation method aims to (i) account for age differences in infection-fatality ratios (IFR), while (ii) reducing bias due to incomplete testing; neither, however, accounts for the effect of age structure on incidence or fully removes confounding.
Statistical analyses
We present two approaches for exploring the associations of hypothesised exposures with each of the above outcomes, while adjusting for potential confounders and accounting for plausible effect modifications chosen a priori for each outcome. For mean Rt and the crude CFR, we did a global analysis as well one specific to African countries (the data were too sparse for other outcomes to perform region-specific analyses). All analysis was done on R software (33). Data and R scripts are available at https://github.com/francescochecchi/covid_eco_analysis/.
Random forest regression
Random forest (RF) regression is a machine-learning approach that may be used to efficiently explore the importance of predictor variables, and possible effect modifications, for a given outcome. RF imposes minimal statistical assumptions on data, and copes well with collinearity (34). It consists of generating a large number of regression trees (i.e. partitions of the independent variables, in varying order, with each variable generating a node or ‘split’) and averaging over these based on their accuracy in predicting the outcomes. We implemented two RF approaches for each outcome, using the randomForest R package, with 1,000 trees grown: (i) using non-missing independent variable data only; (ii) imputing missing independent variable data through the rfImpute proximity method (35) (only variables with at least 60% completeness were subjected to imputation; remaining variables were excluded altogether). As the two approaches yielded similar results, for brevity we only present the latter. We then computed various metrics of variable importance, among which we present and consider most informative the mean minimal depth (MMD: a low value indicates that the variable is generally close to the root of the grown trees, i.e. a large proportion of the data are meaningfully partitioned on the basis of this variable); the mean squared error (MSE) increase (i.e. by how much model error increases if the variable is omitted); and the number of trees (out of 1000) in which the variable is the first node based on which the data are split (the higher, the more fundamental the variable may be).
Linear regression
As each outcome was continuous and not structured hierarchically, we applied ordinary least-squares fixed-effects linear models (LM), guided by our a priori causal framework, to explore associations. We imputed missing data for the independent variables using the mice package; as with the RF models, only variables with at least 60% completeness were subjected to imputation; variables were otherwise excluded. For each outcome, we first observed collinearity among independent variables through scatterplots and Pearson correlation coefficients (see Supplementary File). We screened potential confounding variables through univariate analysis (retaining variables with a p value < 0.20). We fit models through stepwise backward variable selection, retaining variables that improved goodness of fit (adjusted R2 and F-statistic p-value testing whether the model fits data better than the null model) or influenced the effect of potential exposures on the outcomes. We tried alternative collinear variables and tested plausible two-way interactions. We verified model assumptions including normality and the homoscedasticity of residuals. For each outcome, we present two models: one with all exposures retained (Supplementary File); and a “reduced” model with only significant (p < 0.05) and/or model-influential exposures retained (Table 2).
Summary of key associations between independent variables and the outcomes. Exposures of interest are in italics.
Results
Observed country patterns
Completeness for mean Rt and CFR was >70% for all regions except WPRO (33.3% and 51.9%, respectively); completeness for median age of cases and deaths was much lower, ranging from 13.6% (EMRO) to 52% (EURO), and 0 (SEARO) to 36% (EURO), respectively (Supplementary File). Figure 2 summarises trends in each of the outcomes by WHO region, as available. Mean Rt was highest in the EURO and PAHO regions (range 0.92 to 1.77 and 0.73 to 1.73, respectively) and lowest in the AFRO region (0.96 to 1.45). The age distribution of COVID-19 cases and deaths was heterogeneous across regions: even when standardised for differences in age structure, the median age of observed cases was higher in the AFRO and EMRO regions, whereas ascertained deaths occurred at younger ages in those regions compared to EURO and WPRO. While the crude CFR did not seem to vary widely across regions, higher CFR was found in the EMRO, AFRO, and PAHO regions when CFR was standardised for age and incidence. Figure 3 compares the age-standardised median age of cases and deaths for each country. Countries in the EURO and PAHO regions are clustered in the upper left quadrant (i.e., median age of cases <40, median age of deaths >70). Most countries in the AFRO region are clustered in the lower right quadrants (i.e., median age of cases >40, median age of death <70). The Supplementary File provides results by country and graphical explorations of the correlation between independent variables and outcomes.

Analysis outcomes, by WHO region. All boxplots indicate the median and inter-quartile range (boxes), 95% percentile intervals (whiskers) and outliers (dots). CFR = case-fatality ratio.
AFRO= African regional office; EMRO= Eastern Mediterranean regional office; EURO= European regional office; PAHO= Pan American health organisation; SEARO= South-East Asia regional office; WPRO= Western Pacific regional office

Scatter plot diagram of the age-standardised median age of deaths and cases (in years) for 35 countries for which both could be computed.
Statistical associations
Table 2 summarises key results from the two multivariate regression models (RF and the reduced versions of the LMs) of imputed predictors for mean Rt, age-standardised median age of observed cases, age-standardised median age of observed deaths, and age-standardised CFR. Models for crude and incidence-standardised CFR were excluded as their fit was poor. The Supplementary File presents detailed results (all exposures fitted) for each outcome globally, the AFRO region for transmissibility and crude CFR, and the models where mean Rt is computed after ≥50 cumulative deaths.
In the RF model for mean Rt, mean household size, prevalence of filariasis and median population age were the three most important variables when considering the different metrics of importance. Mean mobility change, population density, and prevalence of Pf were also important. Testing rate and testing policy were effect modifiers for the association between median population age and mean Rt. In the LM model, prevalence of filariasis, median population age, mean stringency and population density showed significant associations (p<0.05). The association with Pf prevalence was non-significant in the reduced model. When considering only the AFRO region, population age, population density, and mean stringency did not remain important, but the importance of prevalence of filariasis increased in the RF model and remained significantly associated in the reduced LM model (p<0.001).
In the RF models for median age of observed cases and deaths, median population age was the most important variable (i.e. even after age-standardisation), along with proportion at increased COVID-19 risk, testing rate, and prevalence of helminths. Mobility change was also important for median age of observed cases whereas stringency index was important for median age of observed deaths. Mean mobility change, mean stringency index, and proportion at increased risk were effect modifiers. In the LM model, median population age was positively associated with median age of cases (p<0.0001) and negatively associated with median age of deaths (p<0.01). The prevalence of helminths was not significantly associated with either outcome.
Lastly, RF suggested that median population age was also an important predictor of age-standardised CFR, but this was not borne out in the LM. Both models had a poor fit.
Discussion
We aimed to identify important factors at national level which may explain the global heterogeneity of SARS-CoV-2 epidemics and, specifically, to explore the role of population age structure and exposure to endemic infections. We found that median population age is an important factor explaining variability in transmissibility and the age of observed cases and deaths at the national level, with a significant association remaining even after age-standardisation. Potential associations between endemic infections and COVID-19 appear unlikely, based on this analysis alone, to be key drivers in the variation in observed COVID-19 epidemic trends, though the association with filariasis prevalence at global and AFRO level is intriguing (below). Furthermore, the observed distribution of age amongst reported cases and deaths (after age-standardisation) at least suggests key differences in surveillance and testing capacity between countries and regions, which probably affect the representativeness of reported cases and deaths. Overall, while we emphasise caution over causal inference due to possible hidden confounding and incomplete data, we find that population age structure presents a consistent association that suggest its full impact on country-specific epidemics warrants further research.
Population age structure
Similar to what has been observed with severe acute respiratory syndrome (SARS) and Middle East Respiratory Syndrome (MERS) coronaviruses (36), most studies of COVID-19 suggest that children are both less susceptible to infection and less infectious, as indicated by lower secondary attack rates from younger index cases (37–39). Our study provides some evidence that this may also play out at the population level such that countries with younger population age structure have a smaller susceptible population, less transmission and milder epidemics that may reflect epidemic trends in Sub-Saharan Africa in particular. However, epidemiological studies on the role of children have often relied on passive case detection and thus are likely to miss the majority of pauci-or asymptomatic cases in these age groups (40). Outbreaks among children and adolescents have been important in introducing transmission into households in the United Kingdom (41). Although refuted by some (13, 42), the role of secondary school-aged children (age 11-18 years) is considered an important driver of transmission by others (40). Heterogeneity in social contact patterns across age and locations may also influence the role population age structure plays in the transmission of SARS-CoV-2 and explain this discrepancy. Across Europe contacts between children and young people are highly assortative – that is, they mix most with people of a similar age-indicating their importance in the transmission of disease between households in these countries (43). Through modelling, Prem, Cook and Jit find that intergenerational contact was particularly common in South Asia, and that household contact patterns in countries with much younger population structures did not conform to those in Europe, being characterised by all age groups including adults having most contact with children and teenagers (44), such that the likelihood of a vulnerable older adult coming into contact with an infectious case (and thus the risk of onward transmission or death) may be smaller. Interestingly, in Kenya, assortative mixing was most pronounced between children in rural areas whereas in semi-urban areas it was most marked among adults (45). Therefore, country differences in urbanization and urban demography may reduce the importance of school-aged children in transmission, in line with our findings.
When restricting analysis to the AFRO region, population age structure did not remain an important variable for the prediction of transmission, and testing variables were less important, likely reflecting increased homogeneity in both age structure and lower testing capacity across African countries reducing our ability to detect significant associations.
Older population age structure was associated with lower median age of COVID-19 cases, after standardising for age and adjusting for confounding. Descriptively, the median ages of cases and deaths tended to be respectively ≥40 years and ≤70 years in the AFRO countries, as compared to countries in the EURO and PAHO regions. This contradicts what is known about age-dependent risk of symptomatic COVID-19. Control measures or behaviour change strategies targeting older people in countries with younger populations may explain this observation. Neither stringency index nor change in mobility are disaggregated by age. Alternatively, higher-income countries with older populations may have tested more young people due to greater testing capacity, while countries with low testing capacity might have prioritised older and at-risk people for testing, or reserved testing for travellers. Similar patterns were observed in higher income countries earlier in the pandemic when testing was not widely used and focussed on diagnosing severe infections and infections in key workers in order to assist with quarantine efforts (46). Testing rate and policy appear to modify the effect of age, supporting this explanation. However, age structure retained its importance even after including these effect modifications.
Conversely, countries with older populations had a higher median age of observed deaths from COVID-19, even after age-standardisation. Taking into consideration the fact that these same countries have younger cases overall, these findings may reflect better clinical care in countries with older populations so that although younger people are more likely to be infected, they are also much more likely to survive severe disease due to high-quality inpatient and intensive care. Moreover, outbreaks in nursing and long-term care settings have accounted for a large proportion of deaths in high-income countries and disproportionately affected older people (47). Notably, increasing prevalence of comorbidities was associated with younger age-standardised age of death, which may reflect a phenomenon whereby countries with a comparatively higher prevalence of diabetes, cardiovascular disease and other chronic conditions are also those where these conditions occur at a younger age due to life-course risk factors..
Prior exposure to endemic infections
For transmissibility, prevalence of filariasis was the only measure of endemic infection that ranked highly in the RF model and that showed a strong negative association in the LM model. A plausible explanation may be that country prevalence of filariasis is actually a proxy measure for an unknown factor not included in our models. However, when considering the AFRO region only, where countries share more similar characteristics, the association between prevalence of filariasis and transmissibility becomes stronger. One possible, albeit tenuous biological mechanism relates to the fact that individuals with prior microfilarial infection appear to develop long-term or lifelong deficiency in IgA antibodies, which in turn may be associated with a lower proinflammatory response induced by Th1-type cytokines (49). In SARS-CoV-2 infections, the immunological response involving T-cells seems to be skewed towards these Th1 cells, especially in patients with severe disease (50). Therefore, prior exposure to filariasis may reduce the probability of individuals infected by SARS-CoV-2 to become symptomatic, which in turn may lower their infectiousness and thus population-level transmissibility.
Prevalence of Pf was also a variable of importance, albeit moderate, for the prediction of transmissibility in the RF model. However, the association was not significant in the reduced LM model. Although results from the RF model do not indicate a direction of association, one hypothesis that emerged from the literature was about cross reactivity: prior exposure to malaria triggers the production of poly-specific antibodies capable of interacting with multiple antigens, which may confer some protection against SARS-CoV-2 infection (47).
It is plausible that comparison at national level is insufficiently granular to detect any potential effect of endemic infections. Mbow et al (2014) report within-country variation in non-specific immunity when comparing urban and rural populations that could be related to changes in exposure to infections (51). Our analysis does not reflect this heterogeneity and sub-national data were not publicly available for the vast majority of countries. For soil-transmitted helminths in particular, contradictory hypotheses have been formulated. One of them stipulates that helminths could worsen COVID-19 severity, due to their immunomodulatory effects involving type 2 immune response (52, 53). An alternative hypothesis is that pre-exposure to helminths infection could reduce the risk of severe COVID-19 outcomes, through a downregulation in the production of proinflammatory cytokines involved in the hyperinflammation of the lungs and ‘cytokine storm’ commonly observed in severe and fatal COVID-19 disease (18, 19).
Case-fatality
Our descriptive analysis does not indicate a lower CFR in the AFRO region compared to elsewhere, which does not support a narrative that the virus is less lethal in this region. Nonetheless, the low number of country observations for the age- and incidence-standardised CFR models is a limitation, and findings related to CFR are likely subject to significant confounding by poor case ascertainment. Generally, the CFR models fit poorly. The impact of a large number of undiagnosed cases on the CFR, and the limitations of its use in an ongoing epidemic are well-known (54). While it is logical that population age is an important determining factor, we cannot conclude this on the basis of our results.
Limitations
Related to the ecological design of our study, one of the most important limitations is incomplete ascertainment of cases and deaths due to surveillance quality, testing capacity, and cause-of-death ascertainment, which is likely to be highly-variable among countries. We attempted to control for confounding at the aggregate level, with respect to testing. We controlled for testing performance by adjusting for the population testing rate and testing policy but acknowledge that these measures are themselves subject to bias. Low levels of testing in many low-income countries persist, and may mask the true scale of the epidemic. Indeed, studies point to substantial under-ascertainment of deaths in some countries (55, 56). Furthermore, testing data that are available may overrepresent older and sicker patients. Testing data disaggregated by age, sex, socioeconomic status and geographic location were not publicly available in most countries so that it is not possible to estimate the extent to which case-ascertainment reflects bias in these factors. Therefore, our findings should be interpreted with caution. We also note that countries with lower human development index and economic indicators generally have higher prevalence of endemic infections. As such, we could not fully adjust for all confounders.
Our study is based on a causal framework describing an evolving and incompletely understood pandemic, reflecting the extent of scientific understanding of the disease at the time. Our conceptual model may therefore not take into account all factors that influence SARS-CoV-2 epidemic trends and residual confounding due to these unknown factors may exist.
In general, ecological studies are useful to generate hypotheses, but do not provide a basis for causal inference. For example, stringency of control measures appears associated with higher Rt: this may simply reflect reverse causality, whereby countries with high observed transmission would have maintained strict measures for longer. We averaged values for those variables that change over time, which may obscure the temporal relationships between them and means we cannot draw conclusions about variations in epidemic trends over time. A longitudinal study based on the same variables would be a useful next step.
Lastly, for many of the independent variables, our data is derived from modelled estimates (e.g. prevalence of soil-transmitted helminths) which are themselves based on limited national level data and therefore may not reflect the true measure of this variable. Unsystematic error in explanatory data would have biased coefficients towards the null, and thus masked potential associations.
Conclusions and further work
Population age structure appears to be an important factor associated with the transmissibility of SARS-CoV-2 and the age-distribution of COVID-19 cases and deaths at the national level, even after such outcomes are age-standardised. Our findings do not conclusively support an effect of exposure to endemic parasitic infections on either transmissibility or age distribution of cases and deaths. Research at subnational or individual level should be conducted to investigate these hypotheses further. Where possible, analysis considering the sociodemographic characteristics of those tested will be useful in understanding the general role of lifelong exposures to infection in the observed patterns of disease. Further, study of social contact patterns in a broader range of countries, and the role of urbanization could provide useful insights. This work may be important not only for SARS-CoV-2 but could also inform preparedness and response to future pandemic threats.
Data Availability
For our ecological study, we used publicly available data only. Data and R scripts are available at https://github.com/francescochecchi/covid_eco_analysis/
Funding
Caroline Favas was supported by the UK Foreign, Commonwealth and Development Office and Wellcome [ref. 221303/Z/20/Z, ‘Epidemic Preparedness - Coronavirus research programme’]. Ruwan Ratnayake and Francesco Checchi were supported by UK Research and Innovation as part of the Global Challenges Research Fund [grant number ES/P010873/1]. Oliver J Watson was supported by the UK Foreign Commonwealth and Development Office.
Declaration of competing interest
All authors have completed the ICMJE uniform disclosure form at www.icmje.org/coi_disclosure.pdf and declare: no support from any organization other than those listed in the “Funding” section for the submitted work; no financial relationships with any organizations that might have an interest in the submitted work in the previous three years; no other relationships or activities that could appear to have influenced the submitted work.
SUPPLEMENTARY FILE
Details on variables
Details on independent variables
Exposure to endemic infections
We selected prevalence of malaria, soil-transmitted helminths, filariasis and schistosomiasis as indicators of prior exposure to endemic infections based on the literature (18,19,48,57) and on consultation with parasitology experts. Prior exposure to malaria was measured using age-standardised predicted parasite prevalence rate for children two to ten years of age for Plasmodium falciparum, and in all ages for Plasmodium vivax. Parasite rate is a commonly used index of malaria transmission intensity and as such, endemicity (58). The Malaria Atlas Project database provided country-specific data for the year 2017 (25, 26). Data werewere obtained for 177 and 164 countries for Plasmodium falciparum and Plasmodium Vivax parasite rates respectively.
Estimates of national point prevalence of schistosomiasis, lymphatic filariasis and soil-transmitted helminths (STH -grouping ascariasis, trichuriasis and hookworm disease) were available for 185 countries from the Global Burden of Disease Study 2017 (27).
Population age structure
We used the population’s median age in years to reflect countries’ age structure. Data for the year 2020 were taken from the 2019 revision of World Population Prospect (23).
Country level of development
We abstracted country-specific data on the Human Development index (HDI) from the United Nations Development Programme database, for 188 countries for the year 2018 (28). HDI is a summary measure of achievement in three basic dimensions of human development: a long and healthy life, knowledge and a decent standard of living (59).
Population density, household size and WASH infrastructure
Country-level data about population density (as the number of persons per square kilometre) for the year 2020 was taken from the 2019 revision of World Population Prospect for 196 countries (23). We obtained data about household size (average numbers of members) from the United Nations Database on Household Size and Composition 2019 for 149 countries (29). The proportion of people using safely managed sanitation services for the year 2017 (% of population), was used as a proxy to measure the access to water, sanitation, and hygiene services and infrastructures. Data were extracted from the World Bank World Development Indicator database for 88 countries (30).
Testing rate and testing policy
We captured data for two indicators – “testing policy’ and “stringency index” -from the Oxford COVID-19 Government Response Tracker which systematically records individual policy responses for more than 180 countries (31). Country-specific strategies regarding availability of polymerase chain reaction (PCR) testing for COVID-19 are translated into a daily score ranging from 0 (no testing policy) to 3 (open public testing even to asymptomatic people) (60). We abstracted data for 169 countries, covering the period from January 1 to September 9, 2020 and calculated an average score for each country over that time period.
Testing rate was derived from the total number of tests for each country collected as described below under “Outcomes” and calculated based on the total population for each country as reported by the World Bank in 2019 (30).
Stringency of COVID-19 control measures
The Stringency Index measures the strictness of control measures that primarily restrict people’s behaviour over the course of the pandemic (31). This is a composite daily measure which combines nine individual indicators (school closing, workplace closing, cancellation of public events, restrictions on gatherings, closing of public transports, stay at home requirements, restrictions on internal movements, international travel controls, and public information campaign) taking into consideration whether they are targeted or applied to the whole population (60). We extracted data for 169 countries, covering the period from January 1, 2020 up to September 9, 2020. To obtain a single value, we averaged the country-specific daily indices for the study time period.
Adherence to COVID-19 control measures
Mobility data were sourced from the Google Community Mobility Reports (32) and reflects adherence to COVID-19 control measures through the daily change in population movement relative to the pre-pandemic baseline. It is reported across six place categories: ‘residential’, ‘parks’, ‘grocery and pharmacy’, ‘transit stations’, ‘retail and recreation’, ‘workplaces’. The latter four categories are understood to be most reflective of the impact of control measures, and as such we averaged them into a single aggregate change. We abstracted data for 130 countries between February 15, 2020 and September 9, 2020.
Prevalence of comorbidities
To reflect the prevalence of comorbidities, we used the estimates made by Clark et.al of the percentage of the population at increased risk of severe COVID-19 in each country, defined as those with at least one underlying condition listed as “at increased risk” in guidelines from WHO and public health agencies in the United Kingdom and United States, not adjusted for age (61). Data were obtained for 183 countries.
Details on outcome variables
We used the European Centre for Disease Prevention and Control (ECDC) list of national COVID-19 data sources (linking to country coronavirus dashboards, Ministry of Health webpage or social media accounts) to collect the following: cumulative number of coronavirus cases to date; cumulative number of coronavirus deaths to date; total number of coronavirus tests completed to date. The most recently updated figures were used. Age-disaggregated counts of cases and deaths were collected where available. Where age-disaggregation was given as a percentage of the total rather than a count, numbers of cases and deaths were calculated based on the most recently reported cumulative number of cases or deaths respectively.
The ECDC list was downloaded on 30th July 2020 (62). If the sources listed did not contain these data, or a source was not provided, a manual internet search for the country Ministry of Health website or coronavirus dashboard was attempted. If data were still not found, they were retrieved from the Our World In Data repository (63).
The count and proportion of missing outcome data by region is described in the table below.
completeness of outcome data by WHO region
Reproduction number
We sourced time-varying reproduction numbers (Rt) by country, as estimated on a real-time basis by the Imperial College London MRC Centre for Global Infectious Disease Analysis (22). A characteristic of these estimates is that they are informed by the evolution of observed deaths rather than cases. Data were downloaded on 11th October 2020. We averaged Rt estimates over our analysis period, from the day when 50 cumulative deaths were reported.
Age of observed cases and deaths
Age-specific data on cases were available from 61 countries and age-specific deaths from 39 (35 countries reported both). Eleven separate systems for age categorisation were used across countries, rendering direct comparisons difficult. Moreover, we wished to analyse differences in the average age of cases and deaths not merely explainable by countries’ demographic structure. Accordingly, for each country we present a “standardised median age” indicator âs, interpretable as the median age of cases or deaths if the country’s observed age-specific cumulative incidence or death rates were applied to the world’s population age structure. The quantity is computed as follows. Suppose a given country reports xi cumulative cases (or deaths) in each age category ai = {a1, a2, a3 … amax}, where amax is censored at 100 years. We can calculate age-specific attack rates  , where, ni is the population within each age category. If the country had the same population and age structure as the world, its expected age-specific caseload would be wi = λiNi, where N. denotes the world’s population. Accordingly, âs is the age at which the 50th percentile of the cumulative sum of {wi … wmax} occurs. Since age increments in our dataset were not annual, we linearly interpolated wi over the range a = {0,100} before computing the median. We sourced projected age-specific population for each country and the world in 2020 from the United Nations World Population Prospects (23).
Case-fatality ratio
International comparisons of the lethality of SARS-CoV-2 are notoriously confounded by varying testing coverage, age distribution of cases, prevalence of co-morbidities and other factors. After omitting countries with < 50 total observed cases, we computed a crude case-fatality ratio (CFR) for each country by dividing observed deaths by cases. For countries with available age-specific data we also computed (i) an ‘age-standardised’ CFR, derived as above by applying countries’ age-specific crude CFRs to the world’s population structure; and (ii) an ‘incidence-standardised’ CFR derived by applying each country’s age-specific CFRs to the observed age-specific caseload in South Korea, selected as a reference due to this country’s reportedly high coverage of case detection (i.e. relatively low selection bias affecting the profile of observed cases) and standard of care. Neither standardisation method fully removes confounding; (i) accounts for age differences in infection-fatality ratios (IFR) and (ii) reduces bias due to incomplete testing, but neither accounts for the effect of age on incidence.
Descriptive tables and graphs

Age-specific cumulative incidence rate, by country or territory (observed COVID-19 cases per 1000 population).

Age-specific cumulative death rate, by country or territory (observed deaths due to COVID-19 per 1000 population).
Median and inter-quartile range of the age of cases and deaths, standardised by applying each country’s observed age-specific cumulative incidence and death rates to the world’s population age structure.
Crude, age-standardised and incidence-standardised case-fatality ratios, by country or territory. The last column is the ratio of incidence-standardised CFR for the country, relative to that of South Korea.

Variable collinearity heatmap. Values in each cell are the Pearson correlation coefficient for a given pair of variables. Coefficients close to −1 or +1 indicate high correlation, with 0 indicating minimal correlation.
Pairs of highly collinear variables (Pearson correlation coefficient > |0.7|).
Univariate correlations between the independent variables and outcomes

Correlation between each independent variable and the mean time-varying reproduction number, by WHO region.
AFRO= African regional office; EMRO= Eastern Mediterranean regional office; EURO= European regional office; PAHO= Pan American health organisation; SEARO= South-East Asia regional office; WPRO= Western Pacific regional office

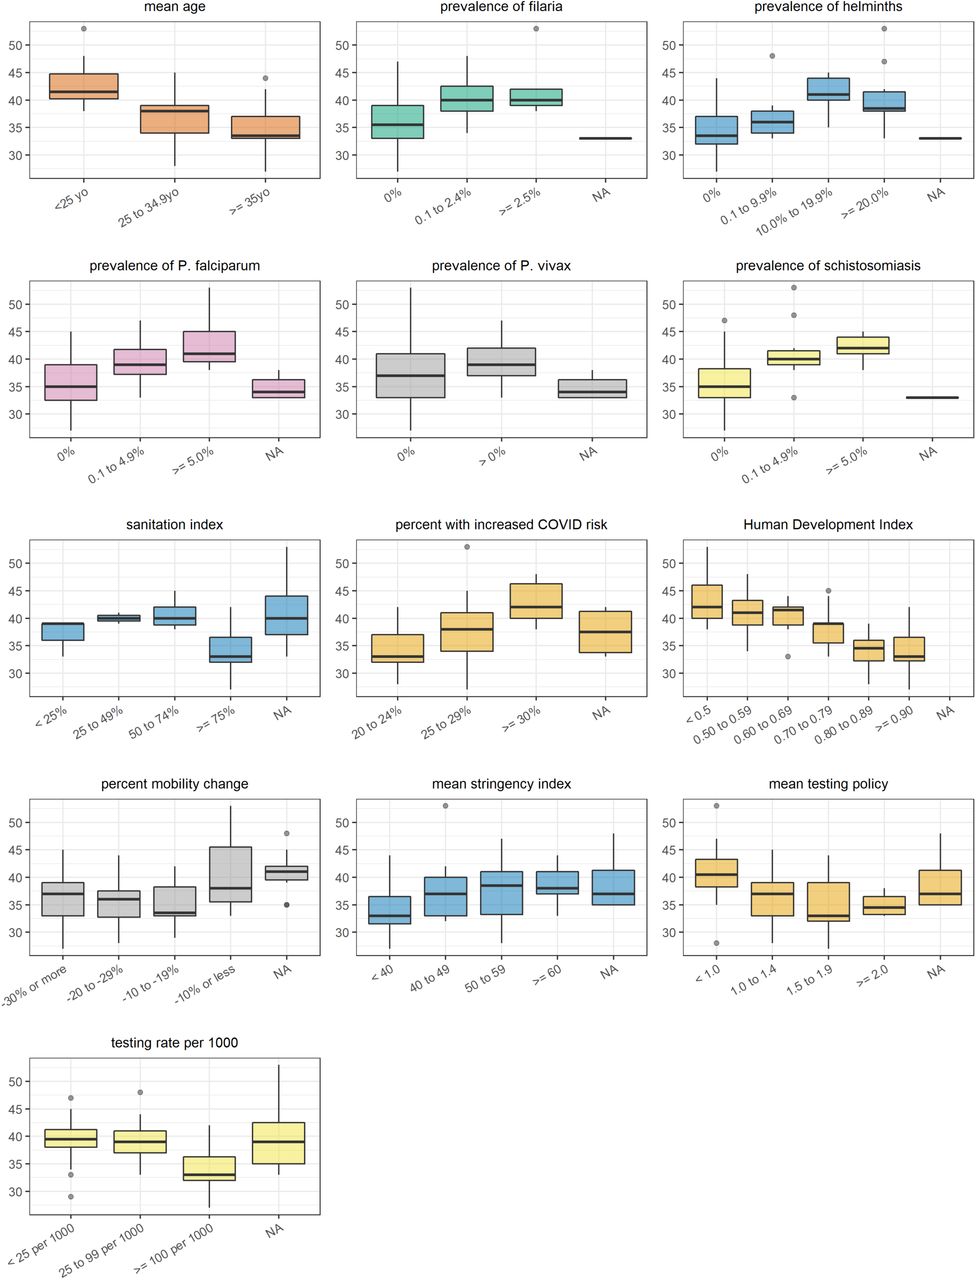
Correlation between each independent variable (categorised) and the mean time-varying reproduction number. Note: NA refers to countries for which no data were available for the specific variable considered

Correlation between each independent variable and age-standardised median age of cases, by WHO region.
AFRO= African regional office; EMRO= Eastern Mediterranean regional office; EURO= European regional office; PAHO= Pan American health organisation; SEARO= South-East Asia regional office; WPRO= Western Pacific regional office

Correlation between each independent variable (categorised) and the age-standardised median age of cases. Note: NA refers to countries for which no data were available for the specific variable considered

Correlation between each independent variable and age-standardised median age of deaths, by WHO region.
AFRO= African regional office; EMRO= Eastern Mediterranean regional office; EURO= European regional office; PAHO= Pan American health organisation; SEARO= South-East Asia regional office; WPRO= Western Pacific regional office

Correlation between each independent variable (categorised) and the age-standardised median age of deaths. Note: NA refers to countries for which no data were available for the specific variable considered

Correlation between each independent variable and crude case-fatality ratio, by WHO region.
AFRO= African regional office; EMRO= Eastern Mediterranean regional office; EURO= European regional office; PAHO= Pan American health organisation; SEARO= South-East Asia regional office; WPRO= Western Pacific regional office

Correlation between each independent variable (categorised) and the crude case-fatality ratio.
Note: NA refers to countries for which no data were available for the specific variable considered

Correlation between each independent variable and age-standardised case-fatality ratio, by WHO region.
AFRO= African regional office; EMRO= Eastern Mediterranean regional office; EURO= European regional office; PAHO= Pan American health organisation; SEARO= South-East Asia regional office; WPRO= Western Pacific regional office

Correlation between each independent variable (categorised) and the age-standardised case-fatality ratio.
Note: NA refers to countries for which no data were available for the specific variable considered

Correlation between each independent variable and incidence-standardised case-fatality ratio, by WHO region.
AFRO= African regional office; EMRO= Eastern Mediterranean regional office; EURO= European regional office; PAHO= Pan American health organisation; SEARO= South-East Asia regional office; WPRO= Western Pacific regional office

Correlation between each independent variable (categorised) and the incidence-standardised case-fatality ratio.
Note: NA refers to countries for which no data were available for the specific variable considered
Detailed multivariate analysis results
Note: all results are presented for the models imputing missing data
Results from random forest regression (RF) and multivariate linear regression (LM) models with all potential exposures for mean reproductive number (Rt)
Results from random forest regression (RF) and multivariate linear regression (LM) models with all potential exposures for age-standardised median age of observed cases
Results from random forest regression (RF) and multivariate linear regression (LM) models with all potential exposures for age-standardised median age of observed deaths
Results from random forest regression (RF) and multivariate linear regression (LM) models with all potential exposures for crude case fatality ratio (CFR)
Results from random forest regression (with imputation) and multivariate linear regression models with all potential exposures for age-standardised case fatality ratio (CFR)
Results from random forest regression (with imputation) and multivariate linear regression models with all potential exposures for incidence-standardised case fatality ratio (CFR)
Result from random forest regression (RF) and multivariate linear regression (LM) models with all potential exposures for mean reproductive number (Rt) for the WHO AFRO region
Result from reduced multivariate linear regression (LM) model for mean reproductive number (Rt) for the WHO AFRO region
Result from random forest regression (RF) and multivariate linear regression (LM) models with all potential exposures for crude case fatality ratio (CFR) for the WHO AFRO region
Result from reduced multivariate linear regression (LM) model for crude CFR for the WHO AFRO region
Acknowledgements
We are grateful to colleagues at the Imperial College of London for supporting our work and for providing useful feedback on the draft of this study report, in particular Charlie Whittaker. We also acknowledge the contribution of John Ackers and Helena Helmby, who provided helpful insights on parasitic infections and their immune modulatory effects.
References


