
Abstract
Objectives To find stunting hotspots district/ cities in Indonesia in seven major islands in Indonesia.
Method This is an ecological study that using aggregate data. We used data from The Basic Health Research Report of Indonesia 2018 and The Poverty Data and Information Report from the Central Bureau of Statistics (BPS) 2018. We analyzed 514 districts/ cities in Indonesia that spread out in 7 major Islands with 34 provinces. We used The Euclidean distance method to determine the neighborhood. Moran’s test was occupied to identify autocorrelation while Moran’s Scatter Plot particularly in the high-high quadrant was used to identify stunting hotspot areas.
Result It was found that there is autocorrelation among districts/ cities in four major islands namely Sumatera, Java, Sulawesi, and Bali Nusa Tenggara Timur (NTT) Nusa Tenggara Barat (NTB). We identified 135 districts/ cities as stunting hotspot areas that spread in 14 provinces in four islands.
Conclusion There is autocorrelation among districts/ cities in Sumatera, Java, Sulawesi, and Bali NTT NTB which resulted in 135 districts/ cities identified as stunting hotspots in four major islands in Indonesia
Policy implication Provide information to the government in prioritizing stunting prevention areas in Indonesia in term of the acceleration of stunting prevention.
Summary Strengths and limitations of this study:
The hypothesis which states that the prevalence of stunting in one area is associated with the prevalence of stunting in the neighboring area is a new method that should be considered to set the policy.
The study results can be used by the government to set priority areas for stunting interventions in Indonesia because so far, the government has made priorities based on stunting prevalence and weighted by poverty. Thus, by setting the priority areas, the funds required will be less compare if it executed in districts of Indonesia simultaneously.
The weakness in this study is the geographical differences of Indonesia regions given the vastness of the Indonesian territory. Some of the districts are separated by oceans and the size of the area is sometimes extremely different. It becomes difficult in determining the neighborhood definition method. Some regions will have no neighbors under certain conditions. Therefore, further research can be carried out with different methods of neighborhood definition.
Introduction
The world is still struggling with stunting in children under five, until 2018 as many as 150.8 million children under five worldwide are stunted 1. Stunting is a condition of growth failure in children under five due to chronic malnutrition, so the child is too short for his age. This is a result of poor nutrition in-utero and in early childhood 1–3. The prevalence of stunting has tended to decline, but the decline is still slow 1.
Indonesia is the fourth largest stunting prevalence in the world 4 as in 2018 there are 30.8% of stunting prevalence in children under five5. Nationally, the prevalence of stunting has indeed decreased by 6.4% since 2013, but the distribution pattern of the prevalence of stunting at the district / city level in Indonesia from 2015 to 2017 appears that stunting in some areas has increased over a period of three years.
Stunting is caused by many factors, including which are closely related (directly related) to family and home environment factors 6–18, insufficient food intake, namely low quality of food, low quality of feeding and quality of drinking water 6,7,19–26, breastfeeding 27–30 and infections 17,19,25,26,31,32. Stunting is also related to social and community factors such as the economic and political situation 33–36, health services, education, culture, food and agriculture systems 37 and related infrastructure of water, sanitation and environment 38–42.
Measurement of height by age at two years is the best predictor of human capital while stunting is associated with low human capital 43. Poor fetal growth or stunting at two years of age can cause permanent damage in terms of shortness in adulthood, low achievement in school, reducing income at adulthood and reducing birth weight of children. Children who are undernourished at up to two years of age and gain weight rapidly in childhood and in adulthood are at high risk for chronic nutrition-related illness 43–49. The effects of malnutrition will span at least three generations as shown by the significant relationship between grandmother height and birth weight of children born to women in the five cohorts 43.
At the end of 2017, the National Strategy for the Acceleration of Stunting Prevention 2018-2024 was issued 50. Stunting reduction in Indonesia is indeed a big challenge considering that Indonesia is a large country, consisting of 17,504 islands with 34 provinces and 514 district / city. Indonesia is the largest country in Southeast Asia, which has regional characteristics, socio-cultural characteristics, behavior, poverty levels that vary from island to island and even between districts / cities in a province. These factors should be taken into account in making stunting directives / policies / programs throughout Indonesia.
Spatial analysis in stunting context is still not widely used in Indonesia and may not even be used as a decision support system in making policies or programs, both at the national and regional levels. Therefore, Indonesia needs information on nutrition data which is analyzed by considering the regional context given the vastness of Indonesia’s territory and its different regional variations. The high prevalence of stunting and large gaps in many areas, and limited funds require the central and regional governments to prioritize the types of intervention and intervention areas as well as the need for quick action in order to meet the national target (19% of children under five by 2024) 51 dan Global World Health Assembly (40% pada tahun 2025) 52.
This study aims to find stunting hotspots area in Indonesia to provide information to the national, provincial and district governments in prioritizing stunting prevention areas in Indonesia in each of the major islands in Indonesia, namely Sumatra Island; Java; Kalimantan; Sulawesi; Nusa Tenggara Timur, Nusa Tenggara Barat, Bali; Maluku; and Papua using data from Basic Health Research Report 2018 as the main source of information. Thus, the government can decide the priority area of stunting intervention due to the acceleration of stunting prevention in Indonesia.
Methods
This is an ecological study using aggregate data. Basic Health Research Report of Indonesia 2018 is the main data source in this research. Basic Health Research is nationally re-presentative survey that provides stunting status in under five children in all districts/ cities in Indonesia. The units of analysis in this study are districts / cities throughout Indonesia as much as 514 districts / cities. There are 514 districts/ cities all in Indonesia that spread out in 7 major Islands namely Sumatera (10 provinces, 154 districts/ cities), Java (6 provinces, 119 districts/ cities), Kalimantan (5 provinces, 56 districts/ cities), Sulawesi (6 provinces, 81 districts/ cities), Bali Nusa Tenggara Timur Nusa (NTT) Tenggara Barat (NTB) (3 provinces, 41 districts/ cities), Maluku (2 provinces, 21 districts/ cities), and Papua (2 provinces, 42 districts/ cities).
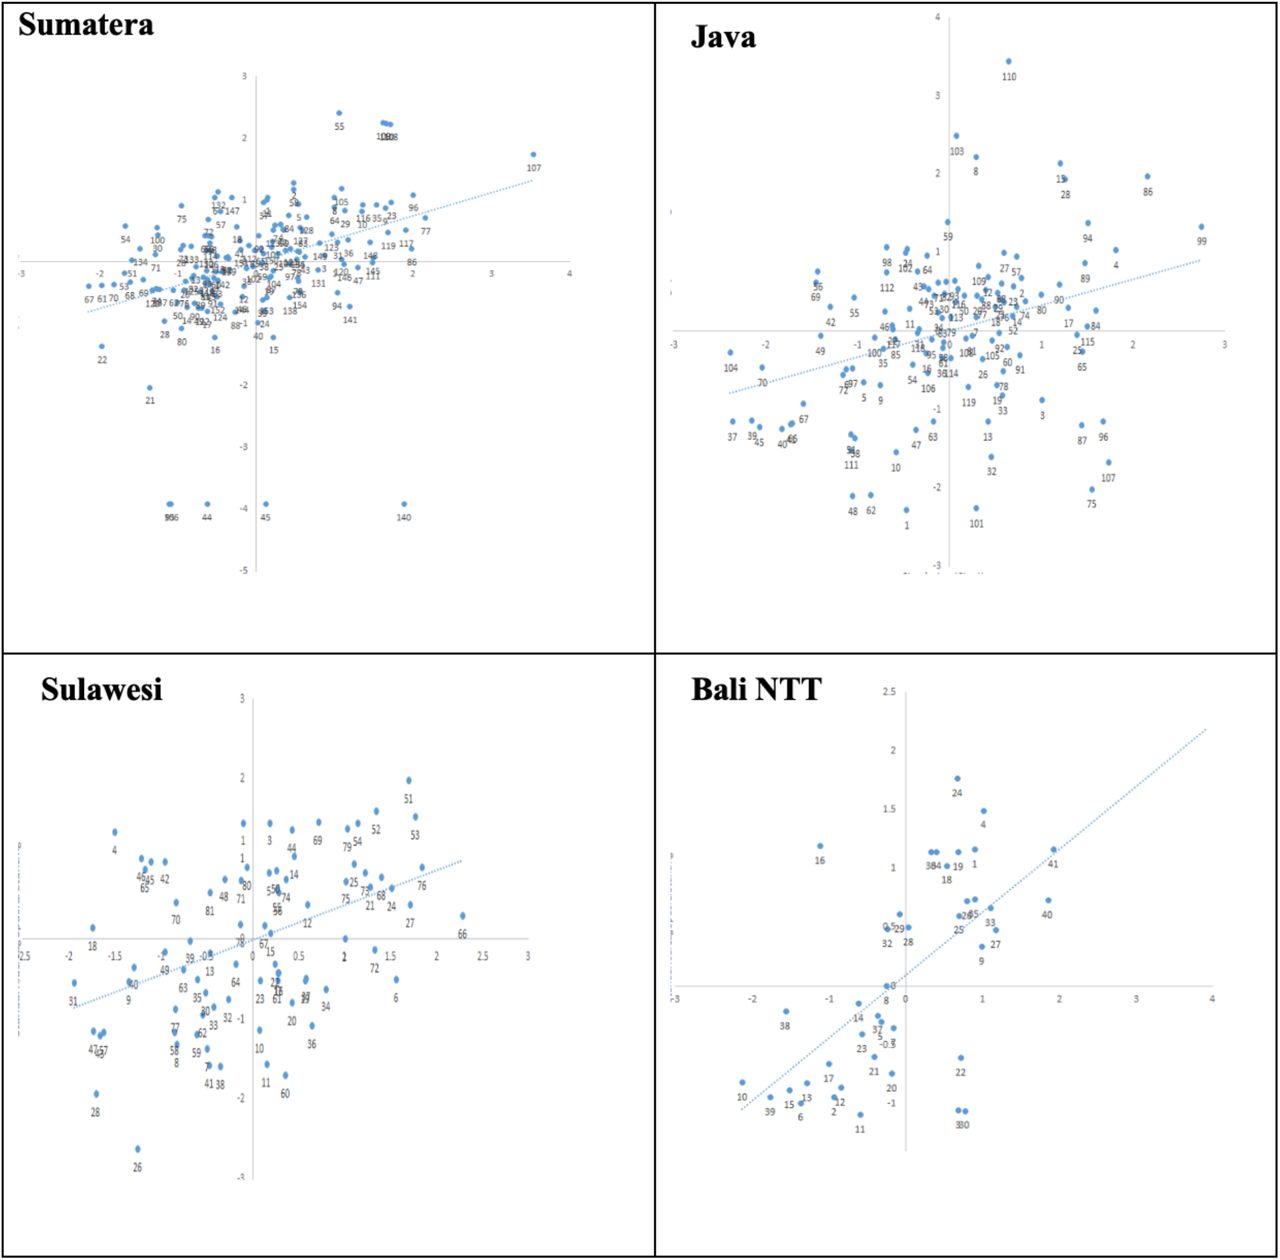
The Euclidean Distance Method was used to determine spatial weighted. The neighborhood definition is if the distance among area within a radius of 1 degree or equivalent to 111 Kilometer (km) in accordance with Euclidean definition. We used Moran’s Test to prove whether there is autocorrelation among districts / cities in each island with a significance level of 0,05. The null hypothesis for autocorrelation is I=0. The hotspot areas were determined by Moran’s Scatter Plot. The areas that clustered in high-high quadrant will be referred as stunting hotspot areas which means that high stunting prevalence area surrounded by high stunting prevalence areas as well. The rationale of this determination is since there is autocorrelation among neighboring areas based on stunting prevalence so it is not enough to intervene in one area with a high prevalence of stunting, instead all clustered area should be intervened. Missing data is not allowed in this research; it was filled by calculating the mean of neighboring areas data. We did Anderson Darling (AD) test, Durbin-Watson (DW), VIF multicollinearity, and Breusch Pagan (BP) test prior to Moran Test to test respectively the residual normality, independency, multicollinearity, and homoscedasticity assumptions with α= 5%. There were no patients or public involvement in this research. All data used in this research are taken from public domain. We used software R i386 3.6.1 to run the analysis and Tableau Public 2020 to create the map.
Result
The result of normality, independency, homoscedasticity, and multicollinearity assumption of stunting prevalence residual is fulfilled as shown in Table 1. There is significant autocorrelation among districts/ cities based on stunting prevalence in Sumatera, Java, Sulawesi, and Bali NTT NTB while on the other hand, all districts/ cities in Kalimantan, Maluku and Papua have no autocorrelation with their neighboring areas.
The Moran’s Scatter Plot of Sumatera, Java, Sulawesi, and Bali NTT NTB are shown in Picture 1.

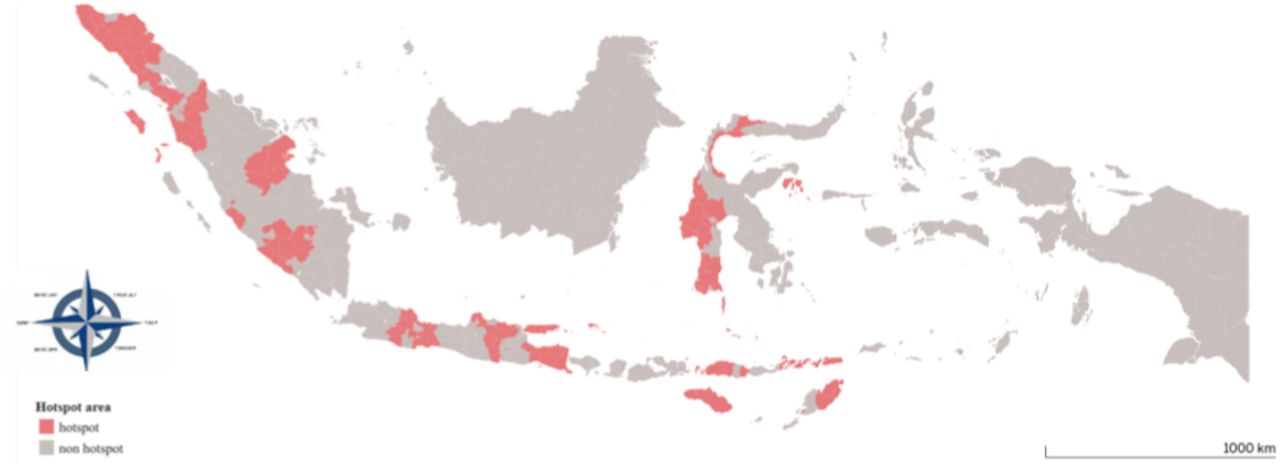
The hotspot areas are all districts/ cities that clustered in high-high quadrat in Moran’s Scatter Plot (Picture 1.). We identified that there are 135 hotspot districts/ cities that spread in 14 provinces in four islands. Picture 2. describes the geographic distribution of hotspot areas in Indonesia.

Discussion
The autocorrelation in Sumatera, Java, Sulawesi and Bali NTT NTB Island indicates that the prevalence of stunting -whether high or low -in one district / city does not occur randomly however it is related to the prevalence of stunting in the surrounding districts / cities. The purpose of spatial autocorrelation is indeed to prove whether the stunting prevalence among districts are related to the stunting prevalence levels of the neighboring districts/ cities (not randomly occurred) 53. The attribute value of a variable from an area tends to be the same or almost the same as a region close to it compared to a region further away. This is based on the basic concept of geography (Tobler I’s Law) which states “everything is related to everything else, but near things are more related than distant thing"53–57. The autocorrelation that has been proven to occur in these four islands can make the pattern of stunting interventions more tailored based on specific regions. Some previous study in other country showed the similar result such as in India, Africa, and Peru585942
Spatial autocorrelation among districts/ cities could not be identified in Kalimantan, Maluku and Papua. Kalimantan Island tends to be similar to Papua Island in terms of area size; two of the five provinces in Kalimantan Island are the largest provinces in Indonesia. Thus, the distance between one district to another district becomes further away due to the size of one district. Papua Island is the largest island in Indonesia where the population lives in groups according to their ethnicity and the population is not evenly distributed60. Maluku has a geographic situation that is slightly different from Papua and Kalimantan where the districts in Maluku are separated by the ocean. From the explanation above, it is known that the size of a district and the geographical shape that is separated by the ocean greatly affects the distance between one area and its neighboring area. This then affects the presence or absence of spatial autocorrelation based on the prevalence of stunting. The theory says that the attribute value of a variable in a region tends to be the same or almost the same as a region closer to it than a region farther away53–57. In spatial analysis context, autocorrelation is the similarity varying with the distance between locations and how this variation is affected by the distance between locations61.
The determination of priority areas for stunting interventions in Indonesia is currently only based on the high prevalence of stunting and weighted by the percentage of poverty in the region so that then this determination method only to arrange the intervention time instead of making priorities. However, using the spatial analysis method, it will be determined the priority areas in Indonesia based on identified hotspot in a certain period of time. The rationale for this is that the prevalence of stunting in districts / cities is related to the prevalence of stunting in nearby areas so that the interventions should be aimed at areas that constitute one cluster.
Some limitation might occur in this study such as ecological study that is prone to ecological fallacy where aggregate data representing areas are applied at the individual level5362. We did estimation to fill the missing data. The weakness of data estimation is that it cannot completely / cannot be ascertained to represent the real situation.
Conclusion
Indonesia is currently planning to accelerate stunting prevention to reduce the prevalence of stunting to 14% by 2024. Considering the vast area of Indonesia with all the differences in regional characteristics, it is necessary to have priority areas for intervention. Spatial analysis can help to determine priority areas by looking at hotspots generated from Moran’s Scatter Plot, especially areas that are in the high-high quadrant. This study found that there are 135 districts / cities of stunting hotspots in Indonesia out of 514 districts / cities throughout Indonesia. Hotspots are spread across four major islands, namely Sumatra, Java, Sulawesi, and Bali NTT NTB. All of these hotspots were recommended to the government to become priority areas for stunting intervention. By knowing that there is autocorrelation between district/ city and that stunting does not occur randomly in the four regions, then intervention programs should be carried out in these hotspot clusters.
Stunting hotspots are not found in Kalimantan, Maluku, and Papua because there is no autocorrelation in those three islands. Furthermore, it may be necessary to carry out a similar study using different spatial weighted.
Data Availability
All data that have been used in this study are public domain. People can access all data freely without any requirements.
https://www.litbang.kemkes.go.id/laporan-riset-kesehatan-dasar-riskesdas/
Data Sharing Statement
Data are available online from the Central Bureau of Statistics (BPS) and Health Ministry of Indonesia. Data inserted in BPS report and Province Basic Health Research Report.
Contributorship Statement
All authors have made substantial contribution to this research and have approved the final manuscript. TS contributed on all steps of research concept, design, writing, and data interpretation. TE, MPB, KNS, MNA, Mi, DMU, MR, HH were contributed on concept, interpretation, and review.
Declaration of Conflicting Interest
The author(s) stated that no potential conflicts of interest with respect to the research, authorship, and/or publication of this article.
Funding
Financial support for this research and publication was provided by Universitas Indonesia.
Ethics Approval and Consent to Participate
The study was based on data available in public domain; therefore, no ethical issue is involved.
References


