
Abstract
Background Viral population dynamics in long term viraemic antiretroviral therapy (ART) treated individuals have not been well characterised. Prolonged virologic failure on 2nd-line protease inhibitor (PI) based ART without emergence of major protease mutations is well recognised, providing an opportunity to study within-host evolution.
Methods Using next-generation Illumina short read sequencing and in silico haplotype reconstruction we analysed whole genome sequences from longitudinal plasma samples of eight chronically infected HIV-1 individuals failing 2nd-line regimens from the ANRS 12249 TasP trial, in the absence of high frequency major PI resistance mutations. Plasma drug levels were measured by HPLC. Three participants were selective for in-depth variant and haplotype analyses, each with five or more timepoints spanning at least 16 months.
Results During PI failure synonymous mutations were around twice as frequent as non-synonymous mutations across participants. Prior to or during exposure to PI, we observed several polymorphic amino acids in gag (e.g. T81A, T375N) which are have also been previously associated with exposure to protease inhibitor exposure. Although overall SNP frequency at abundance above 2% appeared stable across time in each individual, divergence from the consensus baseline sequence did increase over time. Non-synonymous changes were enriched in known polymorphic regions such as env whereas synonymous changes were more often observed to fluctuate in the conserved pol gene. Phylogenetic analyses of whole genome viral haplotypes demonstrated two common features: Firstly, evidence for selective sweeps following therapy switches or large changes in plasma drug concentrations, with hitchhiking of synonymous and non-synonymous mutations. Secondly, we observed competition between multiple viral haplotypes that intermingled phylogenetically alongside soft selective sweeps. The diversity of viral populations was maintained between successive timepoints with ongoing viremia, particularly in env. Changes in haplotype dominance were often distinct from the dynamics of drug resistance mutations in reverse transcriptase (RT), indicating the presence of softer selective sweeps and/or recombination.
Conclusions Large fluctuations in variant frequencies with diversification occur during apparently ‘stable’ viremia on non-suppressive ART. Reconstructed haplotypes provided further evidence for sweeps during periods of partial adherence, and competition between haplotypes during periods of low drug exposure. Drug resistance mutations in RT can be used as markers of viral populations in the reservoir and we found evidence for loss of linkage disequilibrium for drug resistance mutations, indicative of recombination. These data imply that even years of exposure to PIs, within the context of large stable populations displaying ongoing selective competition, may not precipitate emergence of major PI resistance mutations, indicating significant fitness costs for such mutations. Ongoing viral diversification within reservoirs may compromise the goal of sustained viral suppression.
Introduction
Even though HIV-1 infections are most commonly initiated with a single founder virus1, acute and chronic disease are characterised by extensive inter- and intra-participant genetic diversity2,3. The rate and degree of diversification is influenced by multiple factors, including selection pressures imposed by the adaptive immune system, exposure, and penetration of the virus to drugs, and tropism/fitness constraints relating to replication and cell-to-cell transmission in different tissue compartments4,5. During HIV-1 infection, high rates of reverse transcriptase- (RT) related mutation and high viral turnover during replication result in swarms of genetically diverse variants6 which co-exist as quasispecies. Existing literature on HIV-1 intrahost population dynamics is largely limited to untreated infections, predominantly in subtype B infected individuals2,7-9. These works have shown non-linear diversification of virus away from the founder strain during chronic untreated infection. Synonymous mutations can be the product of neutral evolution, but they are also expected to occur more commonly in established chronic infection due to higher fitness costs associated with non-synonymous mutations10, with the exception of immune escape during early infection2.
Viral population dynamics in long-term viraemic antiretroviral therapy (ART) treated individuals have not been well characterised. HIV rapidly accumulates drug-resistance associated mutations (DRMs), particularly during non-suppressive first line ART5,11. As a result, ART-experienced participants failing 1st-line regimens for prolonged periods of time particularly in low- and middle-income countries (LMICs), are characterised by high frequencies of common DRMs such as M184V, K65R and K103N12. By contrast, PI resistance mutations following failure of current boosted PI treatments are uncommon in LMIC13, a situation that differs for less potent drugs used in the early PI era5. A number of studies have indicated that less well characterised mutations accumulating in the gag gene during PI failure might also impact PI susceptibility14-20, though common pathways have been difficult to discern, likely reflecting plasticity to drug escape.
Prolonged virologic failure on PI regimens without emergence of protease mutations provides an opportunity to study evolution under partially-suppressive ART. The process of selective sweeps in the context of HIV-1 infection has previously been described21,22 and it was reported that major PI DRMs and other non-synonymous mutations in regulatory regions such as pol, significantly lower fitness2,23,24. However, this has been typically shown outside of the context of longitudinal sampling. By sampling participants consistently over several years, we propose that ongoing evolution is driven by the dynamic flux between selection, recombination, and genetic drift.
We have deployed next-generation sequencing of stored blood plasma specimens from participants in the Treatment as Prevention (TasP) ANRS 12249 study25, conducted in Kwazulu-Natal, South Africa. All participants were infected with HIV-1 subtype C and characterised as failing 2nd-line regimens containing Lopinavir and Ritonavir (LPV/r), with prolonged virological failure in the absence of major PI mutations26. In this paper, we report details of evolutionary dynamics during non-suppressive ART.
Results
Participant Characteristics
Eight participants with virological failure of 2nd-line PI based ART and at least two timepoints with viraemia above 1000 copies/ml were selected from the French ANRS TasP trial for viral dynamic analysis, including whole genome haplotye reconstruction (Table 1). Prior to participation in the TasP trial, participants were accessing 1st-line regimens for an average of 5.6yrs (±2.7yrs). At baseline enrolment visit into TasP (whilst failing 1st-line regimens), median viral load was 4.96×10¹⁰ (IQR: 4.17×10¹⁰ – 5.15×10¹⁰); 12 DRMs were found at a threshold of >2%; the most common of which were RT mutations K103N, M184V and P225H, consistent with previous use of d4T, NVP, EFV and FTC/3TC. Six of the eight participants carried drug resistance mutations (DRMs) associated with PI failure at minority frequencies (average 6.4%) and at usually at only single timepoints throughout the longitudinal sampling. Observed mutations included L23I, I47V, M46I/L, G73S, V82A, N83D and I85V (Supplementary Tables 1a-3c). Four of the six participants also carried major integrase stand inhibitor (INSTI) mutations, again at minority frequencies (average 5.0%) and again normally only at single timepoints (T97A, E138K, Y143H, Q148K).
Regimens and viral load at final timepoint for all participants. Participants initiated and maintained 1st-line regimens for between 1-10 years before being switched to 2nd-line regimens as part of the TasP trial. Seven of the eight participants were failing 2nd-line regimens at the final timepoint.
SNP frequencies and measures of diversity/divergence over time
We used whole-genome sequencing (WGS) data to measure the frequencies of viral single nucleotide polymorphisms (SNPs) relative to a dual-tropic subtype C reference sequence (AF411967) within individuals over time using short-read deep-sequence data (Figure 1). We observed that SNPs resulting from synonymous changes roughly mirrored those from non-synonymous changes, but the former were two-to-three-fold more common. Furthermore, when we considered diversity relative to the consensus sequence at baseline (switch from 1st-to 2nd-line regimens), we observed a moderate decrease in diversity in four of the eight participants at the second timepoint, moderate increase in diversity in one participant and relatively little diversity in the remaining three (Figure 1, Supplementary Figure 1). From timepoint two onwards (all participants now on 2nd-line regimens for >6 months), three participants saw increases in both synonymous and non-synonymous changes, two participants saw decreases in those changes and three participants did not differ significantly. Finally, HIV-1 subtype M group consensus sequences (Alignment ID: 102CG1) were downloaded from the Los Alamos National Laboratory (LANL) and a merged consensus sequence was used as a proxy of a distant ancestor for all participants. Using this ancestral sequence we measured sequence divergence over sequential timepoints (Figure 2) to determine whether under non-suppressive ART, viral populations were reverting towards an ancestral state, or diverging away from the M-group consensus. All but two participants (15664 and 29447) showed a trend towards divergence away from the ancestor. This is indicative of potential ongoing selection or could be due to random genetic drift. This finding contrasts with studies in transmission where groups have demonstrated that transmitted viruses in the ‘recipient’ are closer to consensus as compared to the majority virus in the transmitting ‘donor’27.

Measure of divergence from the SNPs relative to subtype C reference strain at successive timepoints in eight individuals under non-suppressive ART.
These data were for SNPs detected by Illumina NGS at a threshold of 2% abundance. Sites in this analysis had coverage of at least 10 reads.

Divergence under non suppressive ART: Linear regression of average pairwise distance relative to a reconstructed subtype M consensus.
Average pairwise distances were estimated under a TN93 substitution model and reveal increase divergence from from the initial samples. The 2002 HIV-1 subtype M group consensus sequences (Alignment ID: 102CG1) was downloaded and an overall ancestral consensus created from this using Geneious Prime v2021.1. This was used as a proxy for an ancestral HIV-1 group M sequence, which allowed us to determine if throughout ongoing treatment, the virus was reverting to an ancestral/founder state or diverging further. Shaded regions represented 95% CI of the linear regression fit.
To further investigate nucleotide diversity, we first considered all pairwise nucleotide distances of each consensus WGS by timepoint and participant using a multidimensional scaling approach28. Intra-participant nucleotide diversity varied considerably between participants (Figure 3A-B). Some participants showed little diversity between timepoints (for example participant 16207), whereas others showed higher diversity between timepoints (e.g. participant 22763). A similar range of diversity profiles between participants were inferred by multidimensional scaling. Some participants were tightly clustered, suggesting little change over time (Figure 3a participants 26892, 47939 & 16207), compared to others (participants 22828 & 28545).

Multi-dimensional scaling showing A) clustering of HIV whole genomes from consensus sequences and B) zoomed-in view of four participants with high intra-participant diversity. Multi-dimensional scaling (MDS) were created by determining all pairwise distance comparisons under a TN93 substitution model, coloured by participant. C) Maximum likelihood phylogeny of constructed viral haplotypes for all participants. The phylogeny was rooted on the AF411967 clade C reference genome. Reconstructed haplotypes were genetically diverse and did not typically cluster by timepoint.
When examining the gag, pol and env genes independently, the average diversity over all timepoints (for participants 15664, 16207 and 22763) suggested that the highest diversity (π) was in the env gene. Watterson’s genetic diversity (θ) was highest in the env gene of participants 15664 and 16207. By contrast, θ was highest in the gag gene for participant 22763 (Table 2).
Nucleotide diversity between gag, pol and env reconstructed haplotype sequences from three participants.
Phylogenetic analysis of inferred haplotypes
The preceding diversity assessments suggested the existence of distinct viral haplotypes within each participant. We therefore used a recently reported computational method29 to infer 166 unique haplotypes across all participants, with between 11 and 32 haplotypes (average 21) per participant (Figure 3C). The number haplotypes changed dynamically between successive timepoints indicative of dynamically shifting populations. To ensure that haplotypes were sensibly reconstructed, a phylogeny of all consensus sequences was also inferred (Supplementary Figure 2). Three participants were selected for deeper analysis based on these participants having the highest number of longitudinal plasma samples. These included participants 15664, 16207 and 22763 who each had whole-genome short-read deep-sequence data at more than five timepoints.
Intra-host evolutionary dynamics and relation to drug levels
Changing landscapes of non-synonymous and synonymous mutations
In the absence of major PI mutations, we first examined non-synonymous mutations across the whole genome (Figures 4-6), with a specific focus on pol (to observe first and second line NRTI-associated mutations) and gag (given its involvement in PI susceptibility). We and others have previously shown that gag mutations accumulate during non-suppressive PI therapy30,31. There are also data suggesting associations between env mutations and PI exposure32,33. Supplementary Tables 1-3 summarise the changes in variant frequencies of gag, pol and env mutations in participants over time. We found between two and four mutations at sites previously associated with PI resistance in each participant, all at persistently high frequencies (>90%) even in the absence of presumed drug pressure. This is explained by the fact that a significant proportion of sites associated with PI exposure are also polymorphic across HIV-1 subtypes18,34. To complement this analysis, we examined underlying synonymous mutations across the genome. This revealed complex changes in the frequencies of multiple nucleotide residues across all genes. These changes often formed distinct ‘chevron-like’ pattens between timepoints (Figures 4c & 5b), indicative of linked alleles dynamically shifting and suggestive of competition between viral haplotypes.

Drug regimen, adherence and viral dynamics within participant 15664. a) Viral load and drug levels. At successive timepoints drug regimen was noted and plasma drug concentration measured by HPLC (nmol/l). The participant was characterised by multiple partial suppression (<750 copies/ml, 16 months; <250 copies/ml, 22 months) and rebound events (red dotted line) and poor adherence to the drug regimen. b) Drug resistance and non-drug resistance associated non-synonymous mutation frequencies by Illumina NGS. The participant had large population shifts between timepoints 1-2, consistent with a hard selective sweep, coincident with the shift from 1st-line regimen to 2nd-line. c) Synonymous mutation frequencies. All mutations with a frequency of <10% or >90% at two or more timepoints were tracked over successive timepoints. Most changes were restricted to gag and pol regions and had limited shifts in frequency i.e. between 20-60%. d) Maximum-likelihood phylogeny of reconstructed haplotypes. Haplotypes largely segregated into two major clades, those with the NNRTI mutation K103N and those without. Majority and minority haplotypes, some carrying lamivudine resistance mutation M184V. Clades referred to in the text body are shown to the right of the heatmap.
Participant 15664 had consistently low drug plasma concentration of all drugs at each measured timepoint, with detectable levels measured only at month 15 and beyond (Figure 4a). At baseline, whilst on NNRTI-based 1st-line ART, known NRTI (M184V) and NNRTI (K103N and P225H) DRMs5 were at high prevalence in the virus populations which is as expected whilst adhering to 1st-line treatments. Haplotype reconstruction and subsequent analysis inferred the presence of a majority haplotype carrying all three of these mutations at baseline, as well as a minority haplotype with none of the RT mutations (Figure 4d, orange circles). Following the switch to a 2nd-line regimen, variant frequencies of M184V and P225H dropped below detection limits (<2% of reads), whilst K103N remained at high frequency (Figure 4b). Haplotype analysis was concordant, revealing that viruses with K103N, M184V and P225H were replaced by haplotypes with only K103N (Figure 4d, large brown circles), with minority haplotypes that had no RT mutations (Figure 4d, small brown circles). At timepoint two (month 8), there were also numerous synonymous mutations observed at high frequency in both gag and pol genes, corresponding with the switch to a 2nd-line regimen. At timepoint three (15 months post-switch to 2nd-line regimen) drug concentrations were highest, though still low in absolute terms, indicating partial adherence. Between timepoints three and four we observed a two-log reduction in viral load, with modest change in frequency of RT DRMs. However, we observed synonymous variant frequency shifts predominantly in both gag and pol genes, as indicated by multiple variants increasing and decreasing contemporaneously, creating characteristic chevron patterning (Figure 4b). However many of the changes were between intermediate frequencies, (e.g. between 20% and 60%), which differed from changes between time points one and two where multiple variants changed more dramatically in frequency from <5% to more than 80%, indicating harder selective sweep. These data are in keeping with a soft selective sweep between time points 3 and 5. Between time points five and six, the final two samples, there was another population shift - M184V and P225H frequencies fell below the detection limit at timepoint six, whereas the frequency of K103N dropped from almost 100% to around 75% (Figure 4b). This was consistent with haplotype reconstruction, which inferred a dominant viral haplotype at timepoint six bearing only K103N, as well as a minor haplotype with no DRMs at all (Figure 2d, pink circles). The inferred haplotype without DRMs was nonetheless phylogenetically distinct from the timepoint one minority haplotype (Figure 4d, compare small orange and pink circles in upper clade).
Upon examining the phylogenetic relationships of the inferred haplotype sequences, there were two distinct clades with members of both clades present at all time points apart from the first. This suggests an intermingling of viral haplotypes and competition. DRMs showed some segregation by clade; viruses carrying a higher frequency of DRMs were observed in the lower clade (Clade B, Figure 4d), and those with either K103N alone, or no DRMs were preferentially located in the upper clade (Clade A, Figure 4d). However, this relationship was not clear cut, and therefore consistent with competition between haplotypes during low drug exposure. Soft sweeps were evident, given the increasing diversity (Figure 1) of this participant, as well as constrained variant frequencies between 20-80% (Figure 4b,c).
Participant 16207. Viral load in this participant were consistently elevated >10,000 copies/ml (Figure 5a). As with participant 15664, drug concentrations in blood plasma remained extremely low or absent at each measured timepoint, consistent with non-adherence to the prescribed regimen. There was almost no change in the frequency of DRMs throughout the follow up period, even when making the switch to the 2nd-line regimen. NNRTI resistance mutations such as K103N are known to have minimal fitness costs24 and can therefore persist in the absence of NNRTI pressure. Throughout treatment the participant maintained K103N at a frequency of >95% but also carried several integrase strand transfer inhibitor (INSTI) associated changes (E157Q) and PI-exposure associated amino acid replacements (L23I and M46I) at low frequencies at timepoints two and three. Despite little change in DRM site frequencies, very significant viral population shifts were observed at the whole genome level, again indicative of selective sweeps (Figures 5b-c). Between timepoints one and four, several linked mutations changed abundance contemporaneously, generating chevron-like patterns of non-synonymous changes in env specifically (blue lines). A large number of alleles increased in frequency from <20% to >80% at the same time as numerous others decreased in frequency from above 80% to below 20%. Whereas large shifts in gag and pol alleles also occurred, the mutations involved were almost exclusively synonymous (red and green lines). These putative selective sweeps in env were evident in the phylogenetic analysis (Figure 5d, see long branch lengths between timepoints one and four, and cladal structure) possibly driven by neutralising antibodies and/or T-cell immune pressures.

Drug regimen, adherence and viral dynamics within participant 16207. A) Viral load and drug levels. At successive timepoints regimen was noted and plasma drug concentration measured by HPLC (nmol/l). The participant displayed ongoing viraemia and poor adherence to the prescribed drug regimen. B) Drug resistance and non-drug resistance associated non-synonymous mutations frequencies. The participant had only one major RT mutation - K103N for the duration of the treatment period. Several antagonistic non-synonymous switches in predominantly env were observed between timepoints 1-4. C) Synonymous mutation frequencies. All mutations with a frequency of <10% or >90% at two or more timepoints were followed over successive timepoints. In contrast to non-synonymous mutations, most synonymous changes were in pol, indicative of linkage to the env coding changes. D) Maximum-likelihood phylogeny of reconstructed haplotypes. Haplotypes were clearly divided by a bifurcation; each clade contained haplotypes from all timepoints, suggesting lack of hard selective sweeps and intermingling of viral haplotypes with softer sweeps. that most viral competition occurred outside of drug pressure.
Phylogenetic analysis of inferred whole genome haplotypes overall showed a distinct cladal structure as observed in 15664 (Figure 5d), although the dominant haplotypes were mostly observed in the lower clade (Clade B, Figure 5d). K103N, the only major DRM, was inferred in both clades A and B. Haplotypes did not cluster by time point. Significant diversity in haplotypes from this participant was confirmed by MDS (Supplementary Figure 3).
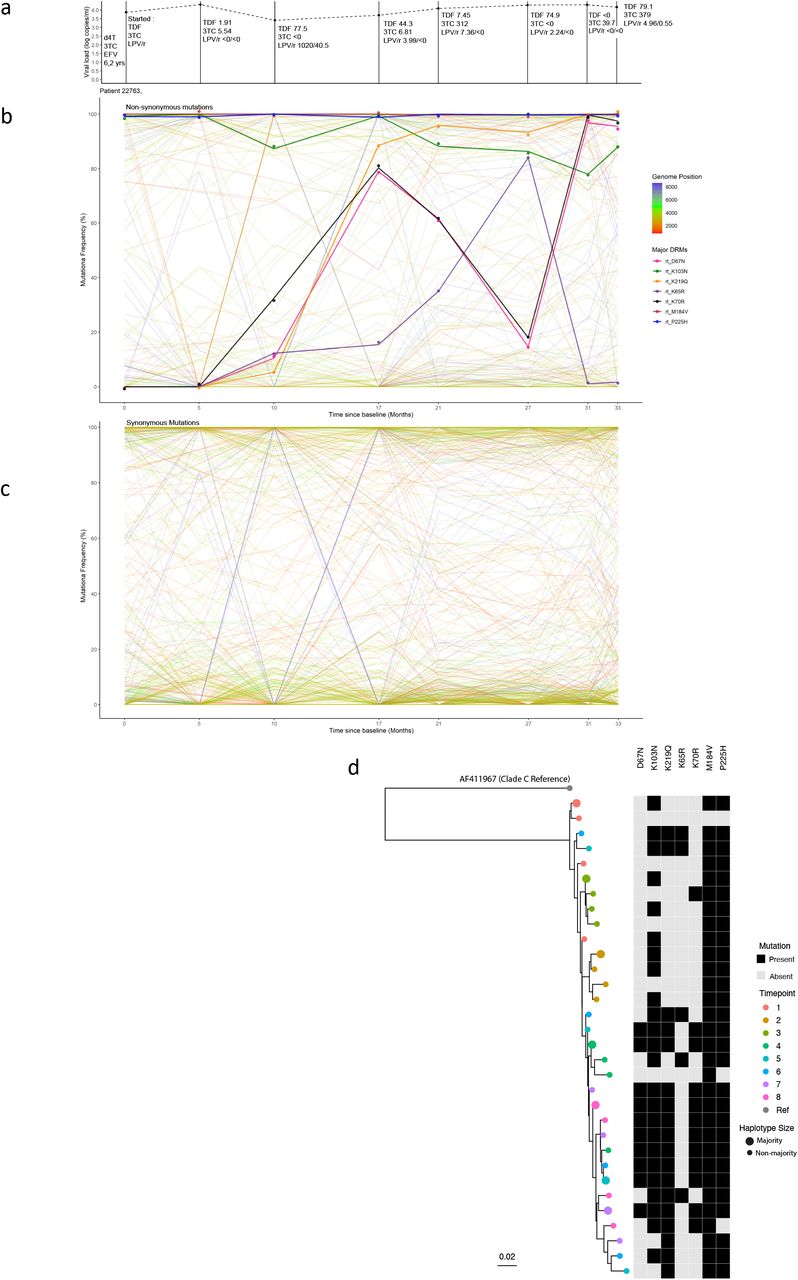
Participant 22763 was notable for a number of large shifts in variant frequencies across multiple drug resistance associated residues and synonymous sites. Drug plasma concentration for different drugs was variable yet detectable at most measured timepoints reflecting changing levels of adherence across the treatment period (Figure 6a). Non-PI DRMs such as M184V, P225H and K103N were present at baseline (time of switch from first to second line treatments). These mutations persisted despite synonymous changes between time points one and two. Most of the highly variable synonymous changes in this participant were found in the gag and pol genes (as in participant 16207) (Figure 6c), but in this case env displayed large fluctuations in synonymous and non-synonymous allelic frequencies over time. At timepoint three therapeutic concentrations of LPV/r and TDF were measured in plasma and haplotypes clustered separately from the first two timepoints (Figure 6d, green circles). NGS confirmed that the D67N, K219Q, K65R, L70R, M184V DRMs and NNRTI-resistance mutations were present at low frequencies from timepoint three onwards. Of note, between timepoints three and six, therapeutic concentration of tenofovir (TDF) was detectable, and coincided with increased frequencies of the canonical TDF DRM, K65R5. The viruses carrying K65R outcompeted those carrying the thymidine analogue mutants (TAMs) D67N and K70R, whilst the lamivudine (3TC) associated resistance mutation, M184V, persisted throughout. In the final three timepoints M46I emerged in protease, but never increased in frequency above <6%. At timepoint seven, populations shifted again with some haplotypes resembling those previously timepoint four, with D67N and K70R again being predominant over K65R in reverse transcriptase (Figure 6d, green and blue circles). At the final timepoint (eight) the frequency of K103N was approximately 85% and the TAM-bearing populations continued to dominate over the K65R population, which at this timepoint had a low frequency.

Drug regimen, adherence and viral dynamics of participant 22763. A) Viral load and regimen adherence. At successive timepoints the regimen was noted, and plasma drug concentration measured by HPLC (nmol/l). The participant had therapeutic levels of drug at several timepoints (3, 5 and 8), indicating variable adherence to the prescribed drug regimen. B) Drug resistance and non-drug resistance associated non-synonymous mutation frequencies. The participant had numerous drug resistance mutations in dynamic flux. Between timepoints 4-7, there was a complete population shift, indicated by reciprocal competition between the RT mutations K65R and the TAMs K67N and K70R. C) Synonymous mutations frequencies. All mutations with a frequency of <10% or >90% at two or more timepoints were followed over successive timepoints. Several env mutations mimicked the non-synonymous shifts observed between timepoints 2-4, suggestive of linkage. D) Maximum-likelihood phylogeny of reconstructed haplotypes. timepoints 1-3 were largely in distinct lineages. In later timepoints, from 4-8, haplotypes became more intermingled, whilst maintaining antagonism between K65R and K67N bearing viruses.
Although the DRM profile suggested the possibility of a selective sweep, we did not observe groups of other non-synonymous or synonymous alleles exhibiting dramatic frequency shifts, i.e. we did not observe the same ‘chevron patterns’ in synonymous- and non-synonymous variant plots (Figure 6b-c) as those seen in participants 15664 and 16207. Indeed, haplotypes were spread throughout the phylogenetic tree, consistent with low drug pressure. Some inferred haplotypes had K65R and others the TAMs D67N and K70R. K65R was not observed in combination with D67N or K70R, consistent with previously reported antagonism between K65R and TAMs whereby these mutations are not commonly found together within a single genome35-37. One possible explanation for the disconnect between the trajectories of DRM frequencies over time and haplotype phylogeny is recombination. Alternatively, emergence of haplotypes from previously unsampled reservoir with different DRM profile is possible, but one might have expected other mutations to characterise such haplotypes that would manifest as change in frequencies of large numbers of other mutations.
Discussion
The proportion of people living with HIV (PLWH) accessing ART has increased from 24% in 2010, to 68% in 202038,39. However, with the scale-up of ART, there has also been an increase in both pre-treatment drug resistance (PDR)40,41 and acquired drug resistance12,42 to 1st-line ART regimens containing NNRTIs. Integrase inhibitors (specifically dolutegravir) are now recommended for first-line regimens by the WHO in regions where PDR exceeds 10%43. Boosted PI-containing regimens remain second line drugs following first 1st-line failure, though one unanswered question relates to the nature of viral populations during failure on PI-based ART where major mutations in protease, described largely for less potent PI, have not emerged. Here we have comprehensively analysed viral populations present in longitudinally collected plasma samples of chronically-infected HIV-1 participants under non-suppressive 2nd-line ART.
With the vast majority of PLWH treated in the post-ART era, virus dynamics during non-suppressive ART is important to understand, as there may be implications for future therapeutic success. For example broadly neutralising antibodies (bNab) are being tested not only for prevention, but also as part of remission strategies in combination with latency reversal agents. We know that HIV sensitivity to bNab is dependent on env diversity44,45, and therefore prolonged ART failure with viral diversification could compromise sensitivity to these agents.
Our understanding of virus dynamics largely stems from studies that were limited to untreated individuals46, with largely subgenomic data analysed rather than whole genome9. Traditional analysis of quasispecies distribution, for example as reported by Yu et al47, suggests that the viral diversity increases in longitudinal samples. However the findings of Yu et al were based entirely on short-read NGS data without considering whole-genome haplotypes. The added benefit of examining whole genome is that linked mutations can be identified statistically using an approach that we gave recently developed29. Indeed haplotype reconstruction has proved beneficial in the analysis of compartmentalisation and diversification of several RNA viruses, including HIV-1, CMV and SARS-CoV-230,48,49.
Key findings of this study were: firstly that diversity increased over time with variable trajectory away from the consensus baseline sequence and also the reconstructed ancestral subtype M consensus. Approximately half of the participants appeared to diversify away from the reconstructed ancestral subtype M sequence, but interestingly three participants showed possible diversification back towards the ancestral consensus (albeit with insufficient statistical support).
Secondly, and in contrast to the fractions of synonymous and non-synonymous mutations reported by Zanini et al in a longitudinal untreated dataset2, we show that the fractions of synonymous mutations are generally two-to-three fold higher than non-synonymous mutations during non-suppressive ART in chronic infection. This finding may reflect early versus chronic infection and differing selective pressures. Haplotype reconstruction revealed evidence for competing haplotypes, with evidence for numerous soft selective sweeps in phylogenies, evidenced by intermingling of haplotypes during periods where there was low drug concentration measured in participant’s blood plasma.
Individuals in the present study were treated with Ritonavir boosted Lopinavir along with two NRTIs (typically Tenofovir + Emtricitabine). We observed significant change in the frequencies of NRTI mutations in two of the three participants studied in-depth. These fluctuations likely reflected adherence to the 2nd-line regimen though we saw evidence for possible archived virus populations with DRMs emerging during follow-up because large changes in DRM frequency were not always accompanied by changes at other sites. This is consistent with soft sweeps occurring and that non-DRMs do not necessarily drift with other mutations to fixation21 and that the same mutations are occurring on different backgrounds. As frequencies of RT DRMs did not always segregate with haplotype frequencies, we suggest that a high number of recombination events, known to be common in HIV infections, was responsible for the haplotypic diversity.
Although no participant developed major DRMS at consistently high frequencies to PIs (https://hivdb.stanford.edu/dr-summary/resistance-notes/PI/), we did observe non-synonymous mutations associated with PI exposure that are also known to be polymorphic; however, there was no temporal evidence of specific changes being associated with selective sweeps. For example PI exposure associated residues in matrix (positions 76 and 81) were observed in participant 16207 prior to PI initiation50. Furthermore, participant 16207 was one of few participants who achieved two partial suppressions (<750 copies/ml). After both of these partial suppressions, the rebound populations appeared to be less diverse, consistent with drug-resistant virus re-emerging.
Mutations in all genes that are further apart than 100bp are subject to shuffling via recombination51. Indeed, particularly in participant 22763, there is evidence of recombination between timepoint corresponding to months 10 and 27. Whilst we did not undertake a formal recombination analysis at this time, in the future insights into the relationship between DRMs and the dissociation from synonymous changes, relative to genomic regions that have been transferred by recombination, may lead to additional insights of viral populations pressures under non-suppressive ART.
This study had some limitations – we examined in-detail three participants with ongoing viraemia and variable adherence to 2nd-line drug regimens. Despite the small sample size, this type of longitudinal sampling of ART-experienced participants in unprecedented. We are confident that the combination of computational analyses has provided a detailed understanding of viral dynamics under non-suppressive ART and is directly applicable to wider datasets. The method used to reconstruct viral haplotypes in silico is novel and has previously been validated in HIV-positive participants with CMV48. Validation of haplotypes is based on inputting a known mix of artificial viruses and comparing the output to the known input, as is common with such software. We are confident that approach implemented by HaROLD has accurately, if conservatively estimated haplotype frequencies and future studies should look to validate these frequencies using an in vitro method such as single genome amplification. Despite there being high viral loads present at each of the analysed timepoints, nuances of the sequencing method led in some cases to suboptimal degrees of gene coverage (Supplementary Figure 4). Mapping metrics showed that gaps in sequence coverage were random, which excludes the possibility of systematic bias in the participant data. To ensure that uneven sequencing coverage did not bias our analyses, we ensured that variant analysis was only performed where coverage was >10 reads.
In summary we have found compelling evidence of HIV-1 within host viral diversification and haplotype competition during non-suppressive ART, in addition to recombination. Going forward, participants failing PI-based regimens are likely to be switched to INSTI-based ART (specifically Dolutegravir in South Africa) prior to genotypic typing or resistance analysis. Although the prevalence of underlying major INSTI resistance mutations is low in sub-Saharan Africa52,53, this approach needs assessment given data linking individuals with NNRTI resistance with poorer virological outcomes on Dolutegravir54, coupled with a history of intermittent adherence. The increases in diversity generated during long term PI failure may have biological effects that renders durable suppression less likely.
Methods
Study & Participant selection
This cohort was nested within the French ANRS 12249 Treatment as Prevention (TasP) trial25. TasP was a cluster-randomised trial comparing an intervention arm who offered ART after HIV diagnosis irrespective of participant CD4 + count, to a control arm which offered ART according to prevailing South African guidelines. A subset of 44 longitudinal samples from 8 chronically infected participants. Participants were selected for examination if there were >3 timepoint samples available. All samples were collected from blood plasma. The Illumina MiSeq platform was used and an adapted protocol for sequencing55. Adherence to 2nd-line regimens was measured by HPLC using plasma concentration of drug levels as a proxy. Drug levels were measured at each timepoint with detectable viral loads, post-PI initiation.
Ethical approval was originally grant by the Biomedical Research Ethics Committee (BFC 104/11) at the University of KwaZulu-Natal, and the Medicines Control Council of South Africa for the TasP trial (Clinicaltrials.gov: NCT01509508; South African Trial Register: DOH-27-0512-3974). The study was also authorized by the KwaZulu-Natal Department of Health in South Africa. Written informed consent was obtained from all participants. Original ethical approval also included downstream sequencing of blood plasma samples and analysis of those sequences to better understand drug resistance. No additional ethical approval was required for this.
Illumina Sequencing
Sequencing of viral RNA was performed as previously described by Derache et al56 using a modified protocol previously described by Gall et al57. Briefly, RNA was extracted from 1ml of plasma with detectable viral load of >1000 copies/ml, using QIAamp Viral RNA mini kits (Qiagen, Hilden, Germany), and eluted in 60μl of elution buffer. The near-full HIV genome was amplified with 4 subtype C primers pairs, generating 4 overlapping amplicons of between 2100 and 3900kb.
DNA concentrations of amplicons were quantified with the Qubit dsDNA HS Assay kit (Invitrogen, Carlsbad, CA). Diluted amplicons were pooled equimolarly and prepared for library using the Nextera XT DNA Library preparation and the Nextera XT DNA sample preparation index kits (Illumina, San Diego, CA), following the manufacturer’s protocol.
Genomics & Bioinformatics
Poor quality reads (with Phred score <30) and adapter sequences were trimmed from FastQ files with TrimGalore! v0.6.51958 and mapped to a clade C South African reference genome (AF411967.1) with BWA-MEM59. The reference genome was manually annotated in Geneious Prime v2020.3 with DRMs according to the Stanford HivDB60. Optical PCR duplicate reads were removed using Picard tools (http://broadinstitute.github.io/picard). Finally, QualiMap261 was used to assess the mean mapping quality scores and coverage in relation to the reference genome for the purpose of excluding poorly mapped sequences from further analysis. Single nucleotides polymorphisms (SNPs) were called using VarScan262 with a minimum average quality of 20, minimum variant frequency of 2% and in at least 10 reads. These were then annotated by gene, codon and amino acid alterations using an in-house script63 modified to utilise HIV genomes.
All synonymous variants and DRMs were examined, and their frequency compared across successive timepoints. Synonymous variants were excluded from analysis if their prevalence remained at ≤10% or ≥90% across all timepoints. DRMs were retained for analysis if they were present at over 2% frequency and on at least two reads. A threshold of 2% is supported by a study evaluating different analysis pipelines, which reported fewer discordances over this cut-off64.
Haplotype Reconstruction & Phylogenetics
Whole-genome viral haplotypes were constructed for each participant timepoint using Haplotype Reconstruction for Longitudinal Samples (HaROLD)65. Briefly, SNPs were assigned to each haplotype such that the frequency of variants was equal to the sum of the frequencies of haplotypes containing a specific variant. Maximal log likelihood was used to optimise time-dependent frequencies for longitudinal haplotypes which was calculated by summing over all possible assignment of haplotype variants. Haplotypes were then constructed based on posterior probabilities. After constructing haplotypes, a refinement process remapped reads from BAM files to those constructed haplotypes. The number of haplotypes either increased or decreased as a result of combination or division according to AIC scores, in order to present the most accurate representation of viral populations at each timepoint.
Whole-genome nucleotide diversity was calculated from BAM files using an in-house script (https://github.com/ucl-pathgenomics/NucleotideDiversity). Briefly diversity is calculated by fitting all observed variant frequencies to either a beta distribution or four-dimensional Dirichlet distribution plus delta function (representing invariant sites). These parameters were optimised by maximum log likelihood. Individual gene nucleotide diversity (π), number of segregating sites (S) and Watterson’s genetic diversity (θ) were calculated separately using all reconstructed haplotypes per participant, using DnaSP v6.12.0366.
Maximum-likelihood phylogenetic trees and ancestral reconstruction were performed using IQTree2 v2.1.267. Evolutionary model selection for trees were inferred using ModelFinder68 and trees were estimated using the GTR+F+I model with 1000 ultrafast bootstrap replicates69. All trees were visualised with Figtree v.1.4.4 (http://tree.bio.ed.ac.uk/software/figtree/), rooted on the AF411967.1 reference sequence, and nodes arranged in descending order. Phylogenies were manipulated and annotated using ggtrree v2.24.
Multi Dimension Scaling (MDS) Plots
Whole genomes were obtained as previously described. Pairwise distances between these consensus sequences were calculated using the dist.dna() package in R, with a TN93 nucleotide-nucleotide substitution matrix70 and with pairwise deletion by way of the R package Ape v.5.471. Multi-dimensional scaling (MDS) was implemented using the cmdscale() function with pairwise deletion in R v4.0.4. Much like PCA is a method to attempt to simplify complex data into a more interpretable format, by reducing dimensionality of data whilst retaining most of the variation. In a genomics context we can use this on pairwise distance matrices, where each dimension is a sequence with data points of n-1 sequences pairwise distance. The process was repeated with whole genome haplotype sequences.
Data Availability
All data has been provided as supplementary tables. Sequencing data can be provided upon reasonable request to the authors.
Funding
SAK is supported by the Bill and Melinda Gates Foundation: OPP1175094. RKG is supported by Wellcome Trust Senior Fellowship in Clinical Science: WT108082AIA.
Transparency declarations
RKG has received ad hoc consulting fees from Gilead, ViiV and UMOVIS Lab.


