
Abstract
Animal and human studies have documented the existence of developmental windows (or sensitive periods) when experience can have lasting effects in shaping brain structure or function, behavior, and disease risk. Sensitive periods for depression likely arise through a complex interplay of genes and experience, though this possibility has not been explored. We examined the effect of sensitive period-regulating genetic pathways identified in preclinical animal studies, alone and in interaction with socioeconomic disadvantage, a common childhood adversity, on depression risk. Using a translational approach, we: (1) performed gene-set association analyses using summary data from a genome-wide association study of depression (n=807,553) to assess the effects of three gene sets (60 genes) shown in animal studies to regulate sensitive periods; (2) evaluated the developmental expression patterns of these sensitive period-regulating genes using data from BrainSpan (n=31), a transcriptional atlas of postmortem brain samples; and (3) tested gene-by-development interplay by analyzing the combined effect of common variants in sensitive period genes and timing of exposure to socioeconomic disadvantage within a population-based birth cohort (n=6254). The gene set regulating sensitive period opening associated with increased depression risk. Notably, six of the 15 genes in this set showed developmentally regulated gene-level expression. A genome-wide polygenic risk score-by-environment analysis showed socioeconomic disadvantage during ages 1-5 years were independently associated with depression risk, but no gene-by-development interactions were found. Genes involved in regulating sensitive periods may be implicated in depression vulnerability and differentially expressed across the life course, though larger studies are needed to identify developmental interplays.
Introduction
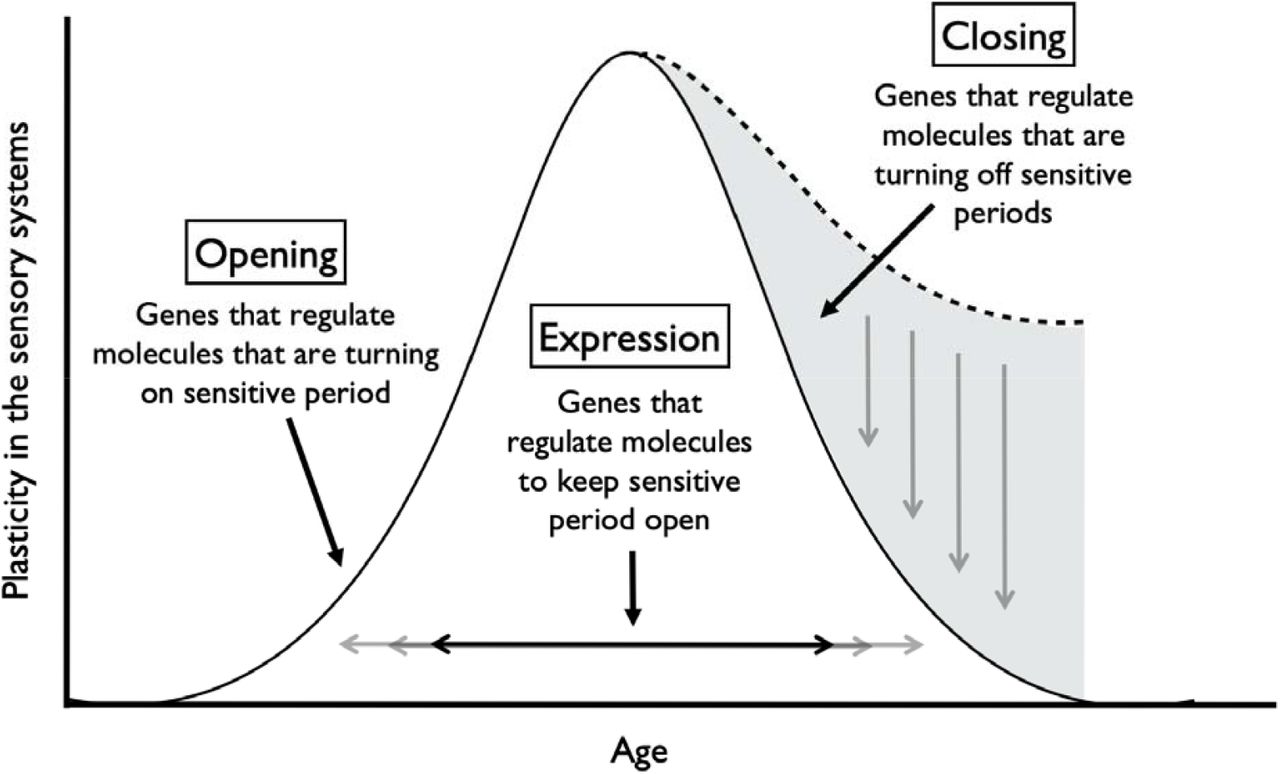
Sensitive periods are stages of heightened plasticity when experience can have particularly strong and enduring effects on brain structure, behavior, and health [1-5]. To date sensitive periods have been most commonly studied with respect to sensory systems and related domains, including vision, hearing, and language learning, in animals [6-8] and humans [9,10]. This research has revealed that sensitive period plasticity occurs through an orchestration of genes and life experiences [11,12]. As shown in Figure 1 and previously summarized elsewhere [12], robust evidence from in vivo experiments with genetically modified mice or rats has shown that several dozen genes regulate the opening, closing, and expression of sensitive periods in the visual and auditory systems [12-15]. For instance, opening genes (e.g., Bdnf or Gad2 [12,16,17]) initiate, accelerate, or delay the onset of sensitive periods by regulating parvalbumin (PV) cell maturation and altering the ratio of excitatory and inhibitory circuit activity. Closing genes (e.g., Acan, Rtn4r) regulate the formation of perineuronal nets (PNNs), which operate as a “molecular brake” of sensitive period plasticity [18]. Expression genes (e.g., Nr2a or Stat1 [19,20]) maintain the duration of sensitive periods by circuit rewiring and consolidation. Beyond the primary sensory cortex, these genetic pathways have been recently implicated in plasticity mechanisms that configure the prefrontal cortical network [21], which regulates cognition and mood [8,18,21]. Thus, alterations in the genetic structure of sensitive period regulation have developmental impacts across brain regions and could give rise to varying levels of psychiatric vulnerability.

Gene sets regulating three aspects of sensitive period functioning in the sensory systems of mice.
Note: Gene sets identified by Hensch (2005) and Takesian and Hensch (2013). Opening genes: BDNF, ARNTL, CLOCK, GABBR1, GABRA1, GABRA2, GABRB3, GAD1, GAD2, SLC6A1, NTRK2, OTX2, NPTX2, HTR3A, CHRNA4 Expression genes: CREB1, KCNK2, NGF, GRIN2A, DLG4, PVALB, STAT1, TNF Closing genes: OTX2, GCLC, GCLM, LYNX1, MAG, MBP, HLA-C, HLA-A, HLA-B, PODN, LILRB3, LILRB1, PTPRS, RTN4, ACAN, BCAN, HAPLN1, HAPLN3, HAPLN4, NCAN, PTS, TNR, VCAN, ADAMTS15, ADAMTS4, ADAMTS8, CSGALNACT1, HAS1, HAS2, HAS3, MME, MMP15, MMP24, MMP3, MMP8, DLG4, PILRB, CAM5, NCAM1
To that end, accumulating evidence from molecular studies suggest genetic dysregulation of sensitive period plasticity may explain risk for neuropsychiatric disorders. For instance, in mouse models of autism, researchers observed mistimed sensitive period onset due to premature or impoverished PV circuits [24, 25]. In both clinical patients and animal models, reduction of sensitive period triggers (PV+ interneurons) or molecular brakes (PNNs) and sensitive period-related transcriptional or epigenetic aberrations were shown to confer greater risk for schizophrenia [24–26]. Recent findings from large-scale genome-wide association studies (GWAS) also point towards associations between variants located in some of the genes implicated in sensitive period regulation (e.g., GABBR1 [22-25], GRIN2A [26-30], NCAM1 [23,31], NCAN [30]) and neuropsychiatric illnesses, such as schizophrenia, depression, and bipolar disorder.
Environmental perturbations during sensitive periods are also associated with risk for neuropsychiatric disorders [32,33]. Observational epidemiologic studies in humans show that exposure to childhood adversity may have time-dependent effects on brain structure and function [34], as well as social, emotional, and behavioral processes, ranging from fear conditioning to stress reactivity and psychopathology symptoms [4,35,36]. This work has generally found that adversity during the first five years of life is associated with the greatest risk for psychiatric outcomes relative to exposure after age five or no exposure [4]. Adversity is thought to disrupt sensitive period functioning through experience-expectant processes, wherein during restricted periods of development, the brain is primed through genetic instruction to expect a normative set of environmental inputs [37]. Experiences of childhood adversity, including acts of social commission (e.g., physical or sexual abuse) or social and material omission (e.g., neglect, poverty) [38], are therefore understood as violations of expected environmental inputs that can lead to impaired brain plasticity and mental disorders [39].
Depression is a disorder classically viewed as governed by the interplay between genetic variations and time-dependent experiences over the life course [40,41]. While the timing and duration of depression-related sensitive periods are unknown, preclinical and molecular studies have implicated sensitive period biology in etiologic pathways of depression risk. For example, the molecular signature of sensitive period closure, PNNs, has protective effects against oxidative stress [42]. Oxidative stress responses have been connected to the pathophysiology of major depressive disorder [43,44] and appear impacted by childhood adversity [45,46]. Moreover, deficits in GABAergic transmission, which plays a key role in regulating sensitive period timing, can alter susceptibility to early life stress [47]. Therefore, stress exposures during developmental periods of heightened vulnerability may give rise to more severe symptoms of depression, especially among individuals with genetic variations linked to disrupted sensitive period timing [47-49].
However, to our knowledge, no studies to date have investigated the independent and joint roles of gene sets regulating developmental plasticity and exposure to time-varying early life adversity on depression risk. In this study, we pursued the overarching hypothesis that genetic variation governing sensitive period plasticity interacts with adverse life experiences during specific developmental windows to shape risk for depression. We tested this hypothesis using a translational approach, bridging and triangulating sources of evidence (from animal models and human studies) [50], types of data (cross-sectional and longitudinal), and disciplines (genetics, developmental neuroscience, and epidemiology). Adopting a pathway-based approach similar to previous studies on neuropsychiatric disorder etiology [51,52], we focused on three sets of genes encompassing existing molecular evidence for sensitive period biology, which regulate the opening (n=15 genes), closing (n=39 genes), and expression (n=8 genes) of sensitive periods (Figure 1). The following three research questions are sequentially investigated (Figure 2):
Does variation in sensitive period genes identified from animal models predict risk for depression in humans?
If so, are the sensitive period genes implicated in depression risk developmentally-regulated? And if so, can we identify variants in these genes that function as developmental expression quantitative trait loci (which we refer to as “d-QTLs)”, shaping developmental timing of expression patterns in the brain?
Does variation in sensitive period genes interact with time-dependent effects of adversity to shape levels of depressive symptoms? In other words, is there evidence for developmental gene-environment interplay(dGxE)?

Systematic approach to examining the role of sensitive period-regulating genes, alone and in interaction with exposure to adversity, on risk for depression.
Note: We approached the above three questions systematically and sequentially, with results from each stage of analysis guiding our approach at the next stage. Specifically, gene sets associated with depression risk in question 1 analysis used to address question 2, where we characterized the developmental trajectories of their gene expression levels and examined whether the trajectories were shaped by certain variants. Similarly, variants annotated to genes in gene sets associated with depression risk were used to compute a gene-set genetic risk score in question 3. Results from question 2 analysis suggested the existence of a biologically-defined sensitive period based on levels of gene expression, which guided how the timing of environmental exposure was parameterized in question 3 analysis.
Methods and Materials
Research Question 1: Examining the association between sensitive period gene sets and risk for depression
Genetic data
To evaluate the strength of association between genetic pathways involved in regulating sensitive period functioning and risk for depression, we analyzed summary-level data from a meta-analysis of depression, which included 414,055 cases and 892,299 controls from three large-scale depression samples: UK Biobank, the Psychiatric Genomics Consortium (PGC), and 23andMe, Inc. [53]. Across subsamples, depression was defined using minimal (e.g., self-reported symptoms) and deep phenotyping (e.g., structured clinical interviews) approaches. Therefore, the analyses captured genetic architecture of general depression, instead of strict clinical diagnosis of major depressive disorder. Details about the genotyping and quality control procedure are provided by Howard et al. [53].
Data Analysis
We pursued a pathway analyses of summary data from the meta-analysis described above. Specifically, we performed competitive gene-set analyses using the Multi-marker Analysis of GenoMic Annotation (MAGMA) software (Version 1.06) [54]. MAGMA uses a nested approach to first summarize SNP-level associations into gene-level associations and then gene-set level associations, allowing for the detection of aggregated signals at even modest levels. In the current analysis, SNP-level estimates were obtained from the Howard et al. meta-analysis of depression described above [53]. For the gene-level analyses, we annotated each of the SNPs reported in the summary data to genes using human genome build 37 (hg19) as the reference. Gene-level p-values were calculated using the sum of -log(p-values) of all tested SNPs within a gene, typically defined as the region between the transcription start and stop sites of each gene [54]. For the gene-set level analyses, we grouped the 60 sensitive period genes into their respective sets based on their biological functioning (Figure 1). To perform a competitive gene-set analysis, we compared the gene-level results for our three sensitive period gene sets to the gene-level results of the rest of the genome; this test determines whether the average association between genes in the given set and the trait of interest were stronger than that of other genes not in the set. We included a corrected p-value that empirically accounts for multiple testing, using 10,000 random permutations. This gene-set approach, rather than a single genetic variant-level analysis, was chosen to test specific biological pathways and understand their potential for identifying therapeutic targets [54]. Moreover, based on the observation of polygenicity (i.e., many thousands of loci each conferring very small risk), aggregating functionally-consistent signals could substantially improve statistical power [40,55].
Of note, five genes in our analysis were located in the Major Histocompatibility Complex (MHC), a region of the genome involved in human immunity that contains polymorphic loci with long-range linkage-disequilibrium (LD) patterns [56]. Although these features could make interpretation of SNP-level associations more difficult, we did not remove SNPs in the extended MHC region, as LD is explicitly modeled in MAGMA to produce unbiased results (see Supplemental Materials).
Research Question 2: Investigating the developmental regulation of depression-implicated sensitive period gene sets
Gene expression data
We investigated the temporal expression patterns of sensitive period genes within the left hemisphere of three brain regions involved in the pathophysiology of depression (amygdala, hippocampus, and medial prefrontal cortex (mPFC)) [57]. Data came from BrainSpan [58,59] (http://www.brainspan.org), a transcriptional atlas of healthy, post-mortem brain donors (ages 5.7 weeks post-conception to 82 years) without large-scale genomic or other abnormalities (see Supplemental Materials). In brief, the 31 postnatal donors studied represented both sexes (42% were female) and were predominantly of European ancestry (58%). BrainSpan investigators classified donors by developmental stage at time of death: (1) 0-5 months (n=3); (2) 6-11 months (n=3); (3) 1-5 years (n=2); (4) 6-11 years (n=3); (5) 12-19 years (n=4); (6) 20-39 years (n=9); (7) 40-59 years (n=4); and (8) 60+ (n=3). Prenatal donors and right hemisphere data were not analyzed here, due to issues with data suitability or availability (see Supplemental Materials).
Quality-controlled, quantile normalized exon microarray data [60] were downloaded from Gene Expression Omnibus (GEO; GSE25219). For each brain region, expression levels for all probes within an exon were averaged to obtain an expression value for each exon. Probes were annotated to genes using the UCSC Human Genome (hg19) reference sequence. Similar to prior studies [61,62], we used the median of all exons within each gene as the estimate of gene expression. Expression values are presented in log(2) values; thus, each one-unit difference represents a doubling of expression. Although RNA-sequencing data were available in BrainSpan, that dataset contained only one-third of the sample size, which would have been too small for our analysis (see Supplemental Materials).
Data Analysis
To investigate whether sensitive period gene expression patterns were developmentally regulated, we tested the hypothesis that developmental stage at time of death explained a significant amount of variation in gene expression. Specifically, we performed multiple regression analysis using an omnibus F-test to compare the full model (with developmental stage included as a categorical variable) to a baseline model (only adjusting for two principal components capturing genetic ancestry). The amount of variation in gene expression additionally explained by developmental stage was quantified using the increase in R2. To reduce multiple testing burden, we focused only on genes in the gene sets associated with depression risk from analyses of the first research question.
Further, to explore whether certain genetic variants could shape developmental expression patterns of sensitive period genes implicated in depression, we tested the interactions between genotype and developmental stage on expression. Genotype was included as a categorical variable instead of the conventional additive model, to capture the potential nonlinear relationship between genotype and trajectories of gene expression; developmental stage was modeled as an ordinal variable, with both linear and quadratic effects to account for nonlinearity while retaining model parsimony. An F-test was then performed to compare the genotype-by-timing model (with the interaction terms) to the baseline model (without the interaction terms). Of note, we restricted these exploratory analyses to the mPFC, as we saw the most evidence for developmental regulation in this brain region. More details are provided in the Supplemental Materials.
Research Question 3: Investigating interactions between genome-wide and gene set-level genetic liability to depression, timing of exposure to adversity, and depressive symptoms in development (i.e., developmental gene-environment interplay)
Dataset and measures
To examine potential developmental gene-environment interplay (dGxE), we analyzed data from 6254 child participants in the Avon Longitudinal Study of Parents and Children (ALSPAC), a UK-based prospective, longitudinal birth-cohort of children followed for more than two decades [63-65]. Ethical approval for the study was obtained from the ALSPAC Ethics and Law Committee and the Local Research Ethics Committees. Consent for biological samples has been collected in accordance with the Human Tissue Act 2004 [66]. More details are available on the ALSPAC website, including a fully searchable data dictionary: http://www.bristol.ac.uk/alspac/researchers/our-data/.
The analytic sample included all participants who were genotyped and had data on the outcome, which was average depressive symptoms across adolescence, spanning ages 10.5 years to 23 years [67,68]. Details about the genotype data collection and quality control procedure are provided in Supplemental Materials. Depressive symptoms across adolescence were measured by averaging clinically administered and child self-reports of depressive symptoms using the Short Mood and Feelings Questionnaire (SMFQ) [69] (Supplemental Materials). We focused on average symptoms to maximize the analytic sample size and measure general levels of symptoms across development.
We studied socioeconomic disadvantage as our measure of adversity, because it is one of the most commonly-occurring and frequently studied adversity types [70,71], and has been consistently associated with psychopathology symptoms in childhood [72] and adulthood [73,74]. Prior literature [72,75] and our own analyses (see Supplemental Materials) provided converging evidence of a time-dependent relationship between exposure to socioeconomic disadvantage and depressive symptoms. In ALSPAC, socioeconomic disadvantage was measured as a time-varying construct based on maternal reports of the extent to which the family had difficulty affording items for the child, rent or mortgage, heating, clothing, or food. Based on prior evidence and preliminary findings, exposure was defined as a three-level variable: no exposure before age 7, exposure during the identified sensitive period (i.e., ages 1-5), and exposure at other time points outside the sensitive period.
Data Analysis
Using summary statistics provided by Howard et al. as weights [53], we generated a polygenic risk score (PRS) representing risk for depression conferred by common variants in the gene set(s) associated with depression in the analyses for the first research question, which was comprised of 3617 SNPs before clumping. As a comparison, we additionally generated a genome-wide PRS including all SNPs associated with depression in the summary statistics at the threshold of p<0.05. Prior to computing the PRS, clumping was performed to eliminate SNPs that were in high LD (based on an r2 threshold of 0.25). PRS calculations were conducted in PLINK 1.90 [76].
All analyses controlled for the following covariates (measured at childbirth): sex, maternal age, number of previous pregnancies, home ownership, highest level of maternal education, and maternal marital status. We also adjusted for the top four principal components to control for potential population stratification. To reduce potential bias and maximize statistical power, missing exposure and covariate data were multiply imputed using the MICE package [77] in R among participants with complete outcome data. All subsequent multiple regression analyses were performed using 20 imputed datasets and the estimates were combined to account for variations between- and within-imputed datasets.
Results
1) Are genetic pathways involved in regulating sensitive periods associated with depression risk?
Of the three gene sets examined, only the gene set regulating the opening of sensitive periods was associated with risk for depression (corrected p-value=0.01, Table 1). There was no evidence for associations between gene sets involved in the expression or closing of sensitive periods and depression risk.
Gene set association analysis for genetic pathways regulating sensitive periods using data from a genome-wide meta-analysis of depression (n=807,553).
2) Are sensitive period genes implicated in depression risk developmentally regulated?
Developmental stage was significantly associated with expression levels in six opening genes, explaining up to 54% of the additional variation in gene-level expression beyond genetic ancestry (Table S1). We observed preliminary evidence for developmental regulation in the mPFC but not hippocampus or amygdala (Figure 3). Three of the six opening genes with evidence of developmental regulation had a nadir of expression between ages 1 and 5: gene expression levels between ages 1 and 5 years were statistically significantly different from other time points at GABRA1 (β=-2.33, 95% C.I. [-3.47, -1.19], p=3×10⁻⁴), GAD1 (β=-1.88, 95% C.I. [-2.78, -0.98], p=2×10⁻⁴), and GAD2 (β=-2.32, 95% C.I. [-3.25, -1.39], p=2×10⁻⁵).

Temporal expression patterns of genes involved in regulating the opening of sensitive periods.
Note: AMY = Amygdala; HIP = Hippocampus; mPFC = Medial Prefrontal Cortex. Thicker lines indicated a significant association between developmental stage and gene expression (i.e., developmental regulation) based on results from multiple regression analyses. The evidence for developmental regulation was found in the mPFC. In particular, three genes showed decreased expression between ages 1 and 5 (GABRA1, GAD1, and GAD2).
We further examined whether genotype was associated with developmental expression of these genes. To identify SNPs associated with developmental gene expression (which we term “developmental expression quantitative trait loci”, or d-QTLs), we tested SNP-by-age interactions on expression levels of the opening genes. Analyses were limited to the mPFC and examined 144 independent SNPs (Supplemental Materials).
We found nominal evidence (p<0.05) for SNP-by-age interactions at five loci (Table S2), with two SNPs (rs1442060, an intron variant in GABRA2; rs7900976, an intron variant in GAD2) showing significant association after accounting for the number of SNPs tested within each gene. As shown in Figure S1, these results revealed that GABRA2 was upregulated early in life and downregulated later in life for both major and minor allele homozygotes, whereas the expression level was more stable over time for heterozygotes. GAD2 was upregulated over time for major allele homozygotes and downregulated for heterozygous individuals. There were only two data points available from homozygous minor individuals, so the trend over time was not discernible. These findings suggest that genetic variants may be associated with different patterns of gene expressions over the life course.
3) How does variation in these sensitive period genes interact with the timing of exposure to adversity to shape depressive symptoms?
Average depressive symptoms across adolescence were heritable in our sample (h2SNP=9.1%, SE=0.05, p=0.03). The genome-wide PRS for depression was significantly associated with average depressive symptoms (β=0.40, 95% C.I. [0.31, 0.49], p<1×10⁻²²).
The gene set-level PRS representing all SNPs annotated to the opening genes did not have a main effect on the outcome (β=-0.01, 95% C.I. [-0.11, 0.08], p=0.78). The environmental exposure, socioeconomic disadvantage, showed a time-dependent association with depressive symptoms. Specifically, the exposure between ages 1 and 5 years was associated with increased symptoms (β=0.79, 95% C.I. [0.5, 1.08], p=1.01×10⁻⁷). This effect estimate was almost twice as large as the increase associated with exposure at other time points (β=0.43, 95% C.I. [0.07, 0.78], p=0.02). When assessing main genetic and environmental effects additively, we observed similar patterns: both the genome-wide PRS and exposure to socioeconomic disadvantage were associated with depressive symptoms, and no gene set-level PRS effect was detected (Table 2, Models 4 and 5). There was no significant evidence supporting dGxE with either the genome-wide PRS or the gene set-level PRS of the opening genes (Table 2, Models 6 and 7). These findings suggest that there was little signal for gene-by-development interplay, though environmental exposure and genetic risk may jointly shape depression risk additively.
Effect estimates of main genetic effects, main environmental effect, and GxE interactions using data from ALSPAC (n=6,254).
Discussion
Three notable findings emerged from our analyses. First, we found that variations in genes governing the onset of sensitive periods were associated with risk for depression at the population level. The mechanism underlying this association remains to be determined. However, we posit that because these genes are known to regulate the initial maturation of inhibitory signaling during early development [6,12], their altered function might therefore delay the onset of sensitive period plasticity. Such mistiming could result in aberrant responses to external stimuli during the process of fear learning and other cognitive functions critical to affective development [78] and thus increase risk for depression and other neuropsychiatric disorders. By contrast, we found no effect on depression of genetic pathways involved in the duration or closure of sensitive periods. The lack of association with closing genes is somewhat surprising given previous studies suggesting that PNN maturation plays an instrumental role in the emergence of higher order functioning (e.g., social memory formation) [79], and has protective effects against toxic stress exposures [42]. The lack of evidence from our study could be due to the heterogeneity among genes included in the closing set. Among the 39 genes in this set, some relate to the formation of PNNs (e.g., ACAN, RTN4R), while others affect myelin and myelin-associated inhibitors that restrict plasticity (e.g., PIRB) [12]. Although these 39 genes all regulate the closure of sensitive periods, they appeared to have mixed effects on depression risk: namely, only 11 out of the 39 genes showed a gene-level association with depression risk. We analyzed the entire closing set to preserve the biological interpretation of this pathway and avoid cherry-picking, however, testing somewhat heterogeneous genes as one pathway might have diluted the signals. Readers interested in seeing gene-level results are referred to Table S5.
Second, we showed that genes involved in sensitive period functioning were developmentally regulated in the mPFC, though not hippocampus or amygdala. Configurations of the prefrontal cortical network during sensitive periods have been implicated in different developmental trajectories and vulnerability to neuropsychiatric disorders, suggesting that plasticity of mPFC may play a prominent role in development [21]. The absence of evidence for developmental regulation in amygdala or hippocampus was unexpected, because the trajectories of GABAergic signaling markers were found to be nonlinear over time in these brain regions within animal models [80]. Our inability to identify time-varying patterns in these regions could be attributed to the limited sample size: although not reaching statistical significance, some genes (e.g., GABRA1, GAD1, and GAD2) did show similar trends of expression in amygdala and hippocampus. Moreover, the nadir in expression levels of opening genes between ages 1 and 5 years suggests that this time period may be developmentally relevant. This decline in plasticity-related transcriptional activities co-occurred with reported periods of decreased synaptogenesis and increased pruning or maturation of the central nervous system, which may signal the start of developing higher-order cognition or more complex behavior [81,82]. However, we were unable to fully disentangle different patterns between individuals across time due to the lack of repeated gene expression measures. Replication studies are needed to further confirm the importance of the developmental window between ages 1 and 5 years. We also provided a proof of concept for identifying genetic loci predicting developmental regulation of genes – which we labeled as d-QTLs. Although our results are preliminary and suggestive given the restrictions of sample size and data availability, the d-QTL framework holds potential for studying the heterogeneity of sensitive period timing and responsivity across individuals with different genetic profiles.
Third, in a population-based sample of adolescents, we did not observe any evidence for genetic main effects or gene-by-developmental timing of adversity interplay. However, we did identify a sensitive period effect of exposure to socioeconomic disadvantage, between ages 1 and 5, which is consistent with prior research [72,83]. The lack of genetic associations with sensitive period genes might reflect insufficient power in our study. As environmental perturbations likely increase phenotypic heterogeneities and yield more nuanced effects, detecting gene-by-environment interactions requires larger sample sizes [40,84]. Our sample size was smaller compared to population-based cross-sectional analyses where effect modification of depression PRS by environmental exposures have been observed [85]. Additionally, our data came from a homogeneous sample of European ancestry children in the UK, where most families of participants were relatively socioeconomically advantaged [64]. Thus, we might have been unable to capture large detrimental effects of extreme hardship and their potential interactions with genetic variations.
Several limitations of our study are noted. First, the lack of detailed phenotypic data in BrainSpan made it impossible for us to test whether developmental regulations of genetic pathways were impacted by life experiences, and whether different trajectories may contribute to risk for depression. By studying associations between phenotypic experiences and gene expression levels across time in human, future studies can better link observable environmental risks to underlying molecular changes. Second, all three data sources were comprised of predominantly White populations, restricting the generalizability of our findings. It should remain a priority of neuropsychiatric genetic studies to expand the recruitment and research of non-White samples [86]. Third, as mentioned above, our analyses were limited by sample sizes and characteristics of the samples. To fully address these issues, larger individual studies or meta/mega-analyses including high risk samples and rigorous assessments of phenotypes are warranted in future work.
In conclusion, our study provides a translational model for testing novel neurobiological pathways by triangulating concepts and data from genetics, developmental sciences, and epidemiology. Through the integration of genetic risk, experiences over the life course, and physiological markers across domains of functioning, interdisciplinary translational studies hold great potential to unravel the complexity of depression etiology and identify novel targets for prevention or intervention.
Data Availability
Summary data of the genome-wide association study referenced in the manuscript are available from the original publication. Please contact the authors for information on how to access data used for other sections of the analyses.
Funding and Disclosure
Research reported in this publication was supported by the National Institute of Mental Health of the National Institutes of Health under Award Numbers K01MH102403 and R01MH113930 (Dr. Dunn) and K24MH094614 (Dr. Smoller). It was also supported in part by a NARSAD Young Investigator Grant from the Brain & Behavior Research Foundation (Dr. Dunn) and an award from the Jacobs Foundation (Drs. Dunn and Takesian). The Psychiatric Genomics Consortium (PGC) has received major funding from the US National Institute of Mental Health and the US National Institute of Drug Abuse (U01 MH109528 and U01 MH1095320). The content is solely the responsibility of the authors and does not necessarily represent the official views of the National Institutes of Health.
The UK Medical Research Council and Wellcome (Grant ref: 217065/Z/19/Z) and the University of Bristol provide core support for ALSPAC. A comprehensive list of grants funding is available on the ALSPAC website (http://www.bristol.ac.uk/alspac/external/documents/grant-acknowledgements.pdf). GWAS data was generated by Sample Logistics and Genotyping Facilities at Wellcome Sanger Institute and LabCorp (Laboratory Corporation of America) using support from 23andMe, Inc. This publication is the work of the authors and all authors will serve as guarantors for the contents of this paper.
Dr. Smoller is an unpaid member of the Bipolar/Depression Research Community Advisory Panel of 23andMe, Inc., a member of the Leon Levy Foundation Neuroscience Advisory Board and received an honorarium for an internal seminar at Biogen, Inc. He is Principal Investigator of a collaborative study of the genetics of depression and bipolar disorder sponsored by 23andMe, Inc., for which 23andMe, Inc. provides analysis time as in-kind support but no payments. The remaining authors (including the contributing Consortium members) have nothing to disclose.
Author contributions
YZ, JWS, TKH, and ECD conceived and designed the analysis. ECD and contributing authors of the Major Depressive Disorder Working Group of the Psychiatric Genomics Consortium acquired the data. YZ, MJW, KMC, JCRT, and KAD performed the analysis. AAL, CL, AET, TKH, JWS, and ECD provided critical feedback on preliminary results and revised the analysis. YZ, MJW, KMC, and ECD drafted the manuscript. All authors critically reviewed the manuscript, gave their final approval, and agreed to be accountable for all aspects of the work in ensuring that questions related to the accuracy or integrity of any part of the work were appropriately investigated and resolved.
Acknowledgments
The authors thank Oliver Hoffman, PhD, formerly of the Harvard Chan Bioinformatics Core, Harvard T.H. Chan School of Public Health, Boston, MA, Meeta Mistry, Virginia Fisher, and Kuang Zheng for their assistance with early data analyses. We are extremely grateful to all the families who took part in this study, the midwives for their help in recruiting them, and the whole ALSPAC team, which includes interviewers, computer and laboratory technicians, clerical workers, research scientists, volunteers, managers, receptionists and nurses. We would also like to thank the research participants and employees of 23andMe, Inc. for making this work possible.
Footnotes
↵# Authorship list appears in the Supplemental Materials
References
- 1.↵
- 2.
- 3.
- 4.↵
- 5.↵
- 6.↵
- 7.
- 8.↵
- 9.↵
- 10.↵
- 11.↵
- 12.↵
- 13.
- 14.
- 15.↵
- 16.↵
- 17.↵
- 18.↵
- 19.↵
- 20.↵
- 21.↵
- 22.↵
- 23.↵
- 24.↵
- 25.↵
- 26.↵
- 27.
- 28.
- 29.
- 30.↵
- 31.↵
- 32.↵
- 33.↵
- 34.↵
- 35.↵
- 36.↵
- 37.↵
- 38.↵
- 39.↵
- 40.↵
- 41.↵
- 42.↵
- 43.↵
- 44.↵
- 45.↵
- 46.↵
- 47.↵
- 48.
- 49.↵
- 50.↵
- 51.↵
- 52.↵
- 53.↵
- 54.↵
- 55.↵
- 56.↵
- 57.↵
- 58.↵
- 59.↵
- 60.↵
- 61.↵
- 62.↵
- 63.↵
- 64.↵
- 65.↵
- 67.↵
- 68.↵
- 69.↵
- 70.↵
- 71.↵
- 72.↵
- 73.↵
- 74.↵
- 75.↵
- 76.↵
- 77.↵
- 78.↵
- 79.↵
- 80.↵
- 81.↵
- 82.↵
- 83.↵
- 84.↵
- 85.↵
- 86.↵


