
Abstract
SARS-CoV-2 is spread primarily through person-to-person contacts. Quantifying population contact rates is important for understanding the impact of physical distancing policies and for modeling COVID-19, but contact patterns have changed substantially over time due to shifting policies and behaviors. There are surprisingly few empirical estimates of age-structured contact rates in the United States both before and throughout the COVID-19 pandemic that capture these changes. Here, we use data from six waves of the Berkeley Interpersonal Contact Survey (BICS), which collected detailed contact data between March 22, 2020 and February 15, 2021 across six metropolitan designated market areas (DMA) in the United States. Contact rates were low across all six DMAs at the start of the pandemic. We find steady increases in the mean and median number of contacts across these localities over time, as well as a greater proportion of respondents reporting a high number of contacts. We also find that young adults between ages 18 and 34 reported more contacts on average compared to other age groups. The 65 and older age group consistently reported low levels of contact throughout the study period. To understand the impact of these changing contact patterns, we simulate COVID-19 dynamics in each DMA using an age-structured mechanistic model. We compare results from models that use BICS contact rate estimates versus commonly used alternative contact rate sources. We find that simulations parameterized with BICS estimates give insight into time-varying changes in relative incidence by age group that are not captured in the absence of these frequently updated estimates. We also find that simulation results based on BICS estimates closely match observed data on the age distribution of cases, and changes in these distributions over time. Together these findings highlight the role of different age groups in driving and sustaining SARS-CoV-2 transmission in the U.S. We also show the utility of repeated contact surveys in revealing heterogeneities in the epidemiology of COVID-19 across localities in the United States.
Introduction
SARS-CoV-2, the causative agent for COVID-19, is transmitted primarily through close person-to-person interactions (Cevik, Kuppalli, Kindrachuk, & Peiris, 2020). The transmission dynamics of SARS-CoV-2, and subsequent morbidity and mortality from COVID-19, are therefore fundamentally dependent on changing patterns of interpersonal interaction in the population. The multiple waves that have characterized the epidemic so far in the USA have been caused by shifting contact rates, as populations have responded to the pandemic with various physical distancing policies. Quantifying population contact patterns and changes in these patterns over time is especially important for identifying demographic groups that are driving and sustaining disease transmission in a population.
Age-specific contact patterns are especially relevant for COVID-19 because clinical outcomes, and likely susceptibility to infection, vary by age (Davies et al., 2020). While the age structure of COVID-19 infections has changed over time, with more cases reported among younger age groups during the summer of 2020 compared to the initial wave (Boehmer, 2020), evidence is limited regarding the relative importance of changing testing rates versus changing contact patterns in driving this finding. Further, the extent to which different demographic groups shifted in driving and sustaining transmission over time remains unclear (Monod et al., 2021).
The unprecedented adoption of physical distancing policies during the COVID-19 pandemic has, meanwhile, created dynamic contact rates and patterns that are challenging to capture in the absence of frequently collected data. Interpersonal contact rates declined significantly after lockdown and shelter-in-place mandates were announced in US cities in mid-March, and slowly increased over the summer after restrictions began to ease by late April (Feehan & Mahmud, 2021). There is, however, considerable heterogeneity across the US in terms of both the infection and mortality burden of COVID-19, as well as the types of non-pharmaceutical interventions (NPI) adopted. As such, quantifying the variation in contact rates between cities over time is key to understanding spatial and temporal variations in contact patterns and infection burden by age and demographics, as well as the effectiveness of physical distancing policies in different localities over time.
Surveys have been used previously to quantify population contact rates to understand transmission dynamics of respiratory pathogens (Rohani, Zhong, & King, 2010; Kucharski et al., 2014; Eames, Tilston, Brooks-Pollock, & Edmunds, 2012; Melegaro, Jit, Gay, Zagheni, & Edmunds, 2011). In the absence of existing surveys for the US, many age-structured mathematical models of SARS-CoV-2 transmission in the US rely on pre-pandemic estimates of contact patterns (Hay, Haw, Hanage, Metcalf, & Mina, 2020; Miller, Becker, Grenfell, & Metcalf, 2020; Enns et al., 2020), based on the POLYMOD study in Europe (Mossong et al., 2008), or on synthetic (modeled) contact rates (Davies et al., 2020; Bubar et al., 2021; Prem et al., 2020; Larremore et al., 2021) based on POLYMOD and country-specific socio-demographic data (Prem, Cook, & Jit, 2017; Prem et al., 2021). While there has been an increase in contact surveys conducted globally since the landmark POLYMOD study (Hoang et al., 2019), there have been few studies conducted in the US that allow for estimation of age-specific contact patterns (Zagheni et al., 2008; A. Dorelien, Ramen, & Swanson, 2020), and there have been no studies to date in the US covering more than one locality (A. M. Dorelien et al., 2020) over the course of the COVID-19 pandemic. In general, there is a deficit in contact survey studies conducted in the US both before the pandemic and especially during its course.
To this end, the ongoing Berkeley Interpersonal Contact Survey (BICS) has been collecting detailed contact data in the US over the course of the COVID-19 pandemic. The BICS consists of six survey waves that have collected information on respondents’ total number of contacts, demographic information about their contacts, and the nature of these contacts (e.g. location, duration). Existing work has used BICS data to quantify changes in contact rates over time and to assess the effectiveness of social distancing measures nationally (Feehan & Mahmud, 2021). Here, we focus on the BICS quota samples collected from six US designated market areas (DMA) surrounding Atlanta, the San Francisco Bay Area, Boston, New York City, Philadelphia, and Phoenix. We first quantify overall contact patterns across the six DMAs over time to understand the impact of NPIs on interpersonal contact. We then use these data to parameterize an age-structured mechanistic model of SARS-CoV-2 transmission to understand changes in age-specific infection burden over time. We show that the median number of reported contacts was fairly stable over time across DMAs, but that the mean number of reported contacts generally increased over time. Moreover, across DMAs, 18-34 year olds reported the highest mean number of contacts compared to other age groups in most survey waves. Our simulation results from a mathematical model parameterized with empirical contact rates from the BICS study closely match observed data on the proportion of COVID-19 cases by age group; in contrast, simulation results from a model parameterized with alternative contact rate estimates commonly used in the literature are unable to capture the shift in proportion of cases by age group. This approach provides a way to improve model estimates during outbreaks, which will be critical for responding to COVID-19 and future outbreaks.
Results
We use data from six waves of the BICS study collected between March 22 and April 8, 2020 (Wave 0); between April 10 and May 4, 2020 (Wave 1); between June 17 and 23, 2020 (Wave 2); between September 11 and 26, 2020 (Wave 3); between November 29 and December 16, 2020 (Wave 4); and between February 7 and February 15, 2021 (Wave 5). We quantified the mean and median number of contacts in each BICS survey wave across the six DMAs (Figure 1A). Despite the differences in COVID-19 epidemic trajectories and NPIs enforced across the different DMAs, all localities show similar dynamics in the mean and median number of reported contacts over time. Although median values across DMAs were fairly stable across survey waves, the means varied substantially because the distribution of the number of contacts was highly right-skewed across all locations, with the mean number of contacts exceeding the median for most survey waves. These differences were driven by changes in contact rates among those reporting large numbers of contacts per day (Figure 1B). In the first wave, the vast majority of respondents reported having five or fewer contacts per day, but the mean generally increased across survey waves and peaked in Wave 3 (September 11-26, 2020) for Atlanta, the Bay Area, New York City, and Philadelphia. Respondents in Atlanta reported the highest mean number of contacts during the BICS study at 7.4 contacts in Wave 3. The mean number of contacts in Boston increased relatively steadily to a value of 6.1 by Wave 5 (February 7-15, 2021). Phoenix respondents, meanwhile, reported a peak in Wave 4 at 6.2 mean contacts (November 29-December 16, 2020). While the median number of reported contacts remained relatively stable, the distribution of the number of contacts changed across survey waves, with a larger proportion of respondents reporting more than five contacts over time.

Descriptive analyses of the number of contacts estimated for the 6 DMAs across BICS Waves 0-5. A) Mean number of contacts (red line) and median number of contacts (blue line) reported during survey Waves 0-5 in each DMA in the BICS study. B) Proportion of BICS respondents reporting 0-5, 6-10, 11-20, and >20 contacts during survey Waves 0-5 in each DMA of the BICS study. The y-axis is truncated and begins at the value 0.5.
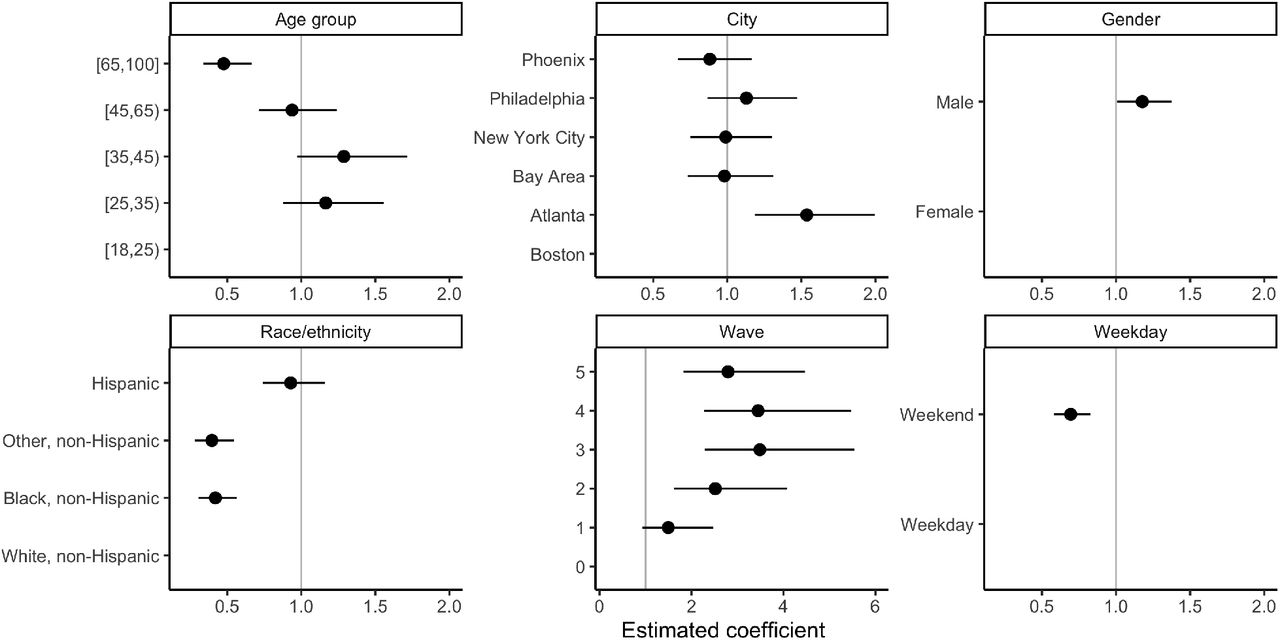
To investigate factors related to reporting a high number of contacts, we fit a logistic regression to the outcome of reporting more than seven contacts (Supplementary Figure S2). The cutoff of seven contacts represents the 80th percentile in the BICS data across survey waves and DMAs. We find that compared to the reference group of 18-24 year olds, 25-34 and 35-44 year olds had a higher odds of reporting more than seven contacts, while 65+ year olds were least likely to report more than seven contacts. Atlanta residents had a higher odds of reporting more than seven contacts compared to the other DMAs in the BICS study. Black and other non-Hispanics had a lower odds of reporting more than seven contacts relative to White non-Hispanics and Hispanics. Consistent with trends in the mean number of contacts, the odds of respondents reporting more than seven contacts increased from Wave 0 to Wave 3 and 4 before slightly declining. Males had a higher odds relative to females of reporting more than seven contacts; and the odds of reporting more than seven contacts was higher on a weekday compared to the weekend.
To understand the demographic groups driving and sustaining transmission, we analyzed the mean number of reported contacts by respondent age groups. Across DMAs, 18-34 year olds consistently reported the highest mean number of contacts (Figure 2). In particular, the mean number of contacts reported by 18-34 year olds in the Bay Area increased from 3.2 mean contacts in Wave 0 to a peak of 9.0 mean contacts in Wave 3 before declining. The middle age group of 35-64 year olds in general exhibited a steady increase in the mean number of contacts over time across DMAs. In Phoenix and Atlanta, 35-64 year olds had the highest mean number of contacts in Waves 4 and 5. Lastly, 65+ year olds consistently reported the lowest mean number of contacts relative to other age groups across time and DMAs. Supplementary Figure S3 shows the corresponding figure with the mean number of reported contacts for five age groups.

The mean number of contacts reported by BICS participants aged 18-34, 35-64, and 65+ years old during survey Waves 0-5 in each DMA of the BICS study.
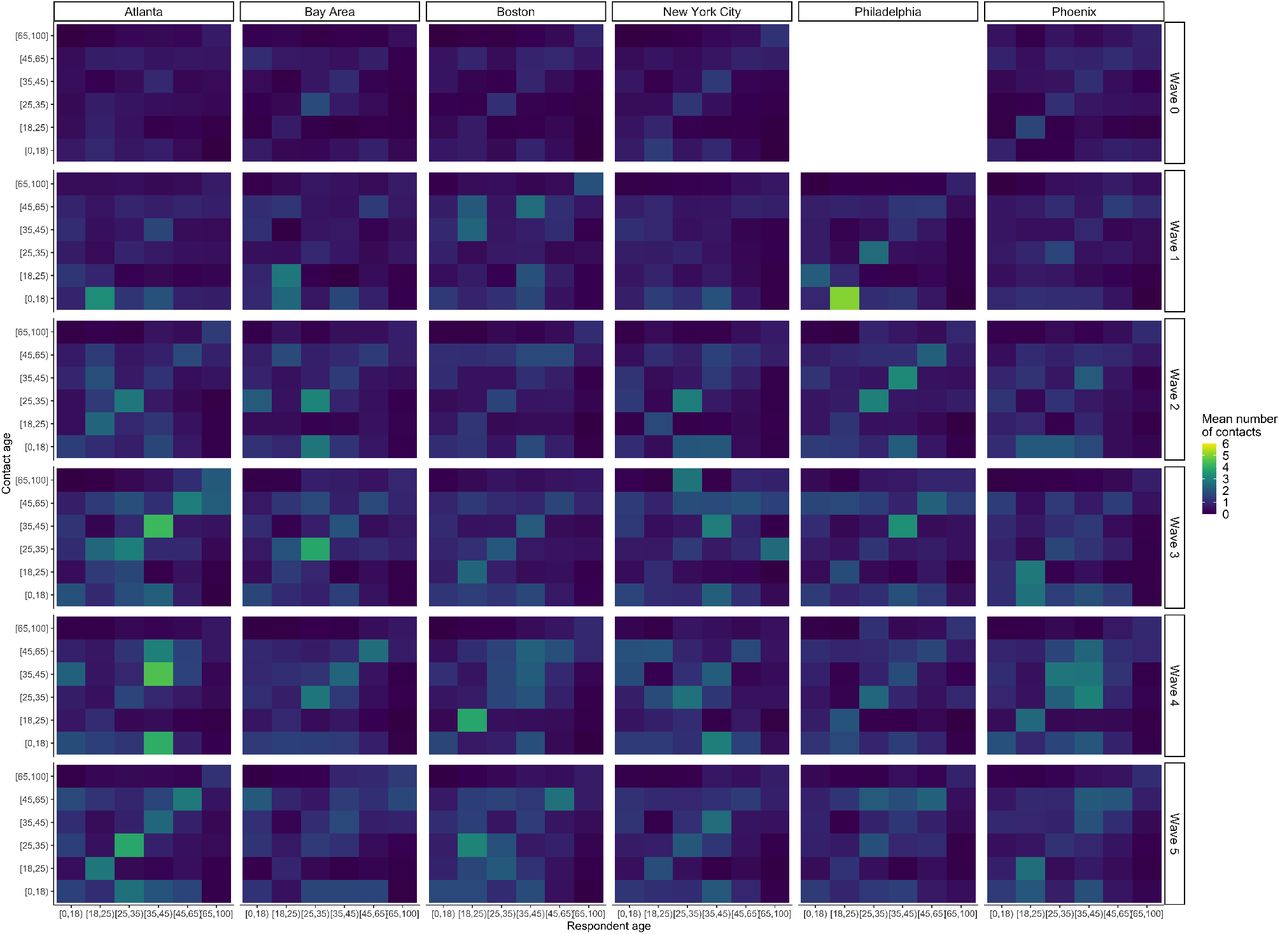
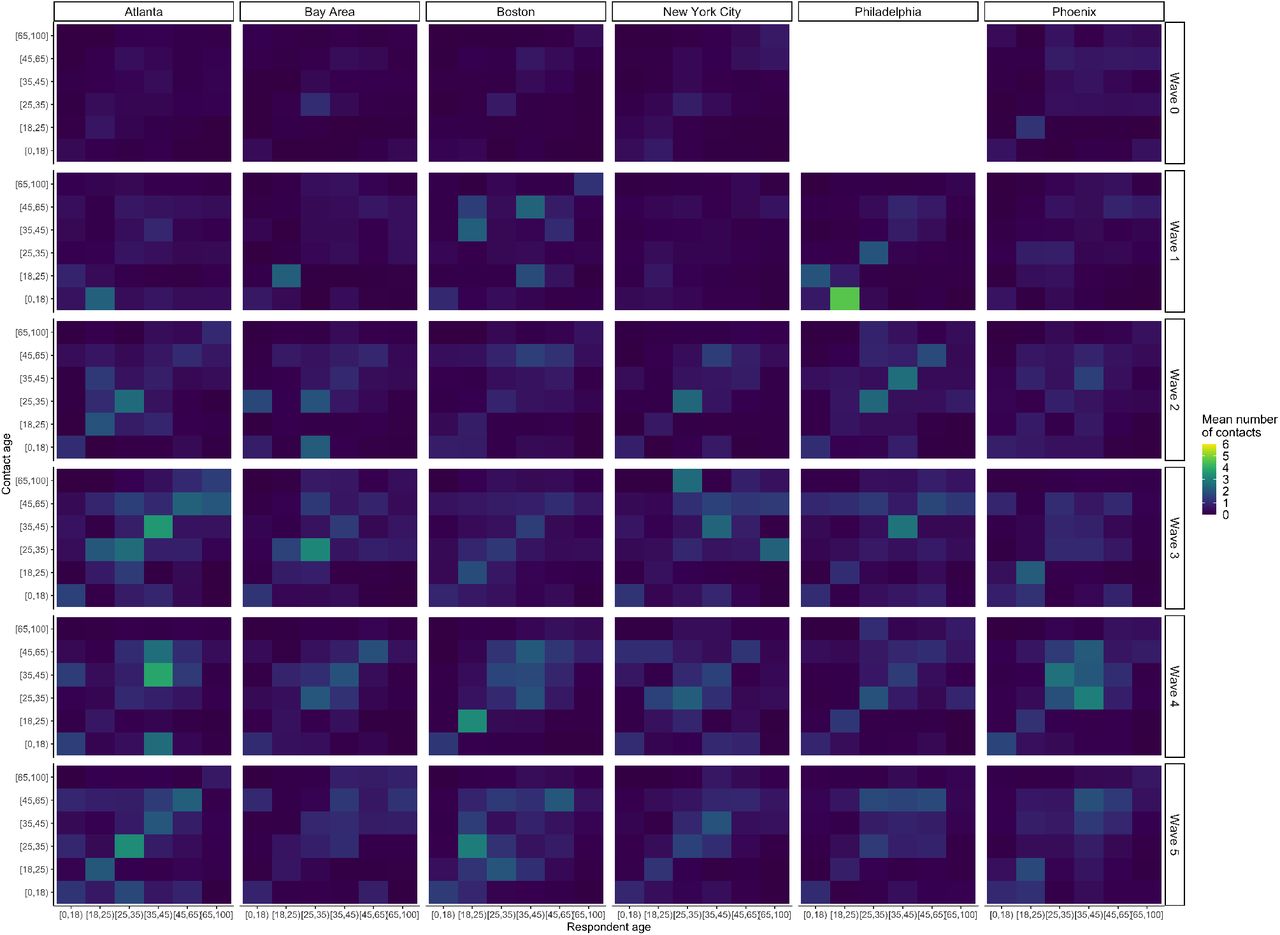
Importantly, transmission dynamics depend not only on the mean number of contacts reported by age group, but also on which age groups interact with one another due to age-specific differences in susceptibility to infection and likelihood of presenting with symptomatic disease. The age-structured contact matrices estimated for all reported contacts and reported non-household contacts in each survey wave and DMA are shown in Supplementary Figures S4 and S5. The age-structured matrices are similar across DMAs, with consistent evidence of assortative mixing and a higher mean number of contacts reported by 25-34 and 35-44 year olds starting in Wave 3.
To understand the impact of changing contact rates and patterns on disease burden, we simulated SARS-CoV-2 transmission in each of the six DMAs using an age-structured mechanistic model parametrized with the BICS contact rate data. We present the model results in terms of four age groups for visual simplicity given the similarity in patterns between certain age groups, but the results for all six age groups are presented in Supplementary Figures S6 and S7. We present simulation results in terms of the reference group of 0-17 year olds, and also compare with observed data where possible.
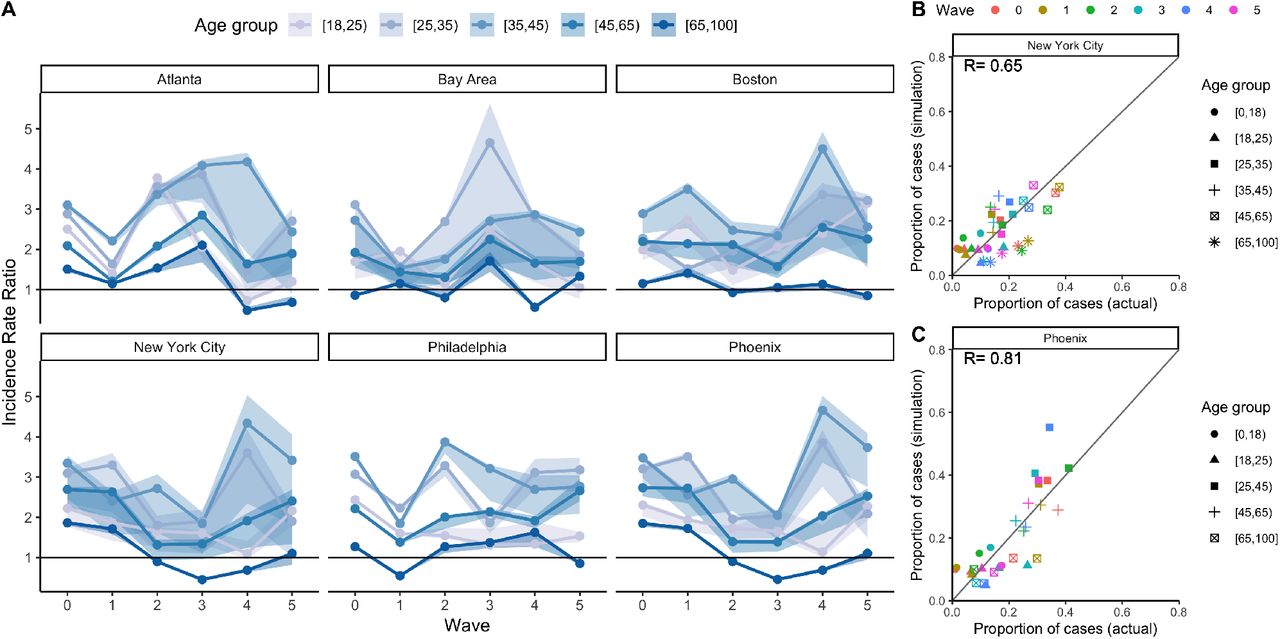
We find that 18-34 year olds and 35-64 year olds had a higher total incidence (including both clinical and subclinical cases) of COVID-19 relative to the reference group of 0-17 year olds across DMAs and time (Figure 3A). Despite their much higher susceptibility to infection, the oldest age group of 65+ year olds had comparable or lower total incidence relative to 0-17 year olds in the simulation results, particularly in later waves, as a result of 65+ year olds’ substantially lower contact rates. When we look at clinical incidence, as expected, we find that all age groups have higher clinical incidence relative to the reference group of 0-17 year olds across survey waves due to the model’s incorporation of age-dependent propensity to have clinical symptoms (Supplementary Figure S8).

Mechanistic model results of total incidence for four age groups using BICS contact rate data, with comparisons to observed data where possible. A) Simulated incidence rate ratio (IRR) representing total incidence for each DMA and BICS survey wave comparing 18-34, 35-64, and 65+ year olds to the reference age group of 0-17 year olds. 90% uncertainty bounds are estimated from running 1,000 simulations with 1,000 different values of R0. The mathematical model is parameterized using empirical contact rate estimates from the BICS study. B) Scatterplot comparing the proportion of COVID-19 cases in each age group (represented by symbol shape) and survey wave (represented by symbol color) estimated in the simulation based on clinical incidence vs. reported in actual epidemiological data for New York City. The empirical data for New York City represent the proportion of positive COVID-19 molecular tests by age group for New York City. C) Scatterplot comparing the proportion of COVID-19 cases in each age group (represented by symbol shape) and survey wave (represented by symbol color) estimated in the simulation based on clinical incidence vs. reported in actual epidemiological data for Phoenix. The empirical data for Phoenix represent the proportion of confirmed and probable COVID-19 cases reported in Maricopa County.
Where possible based on data availability, we compare the proportion of simulated cases by age group using clinical incidence results and the proportion of observed COVID-19 cases by age group. We find a very high correlation between the simulated and observed proportions of COVID-19 cases by age group for both New York City and Phoenix (Figures 3B and 3C). Our simulations are also consistent with the changing proportion of clinical cases observed in empirical data. For instance, we are able to simulate the observed decline in the proportion of cases in the 65+ age group in New York and Phoenix after the first wave of the outbreak in March to May 2020 (Supplementary Figure S9). This suggests that this observed trend was not simply the result of changes in testing rates by age group, but rather a result of the very low contact rates in the 65 and older age group compared to younger age groups. In the Bay Area, our simulations captured the relatively high proportion of cases among 25-45 year olds, again reflecting the age group’s relatively higher contact rates.
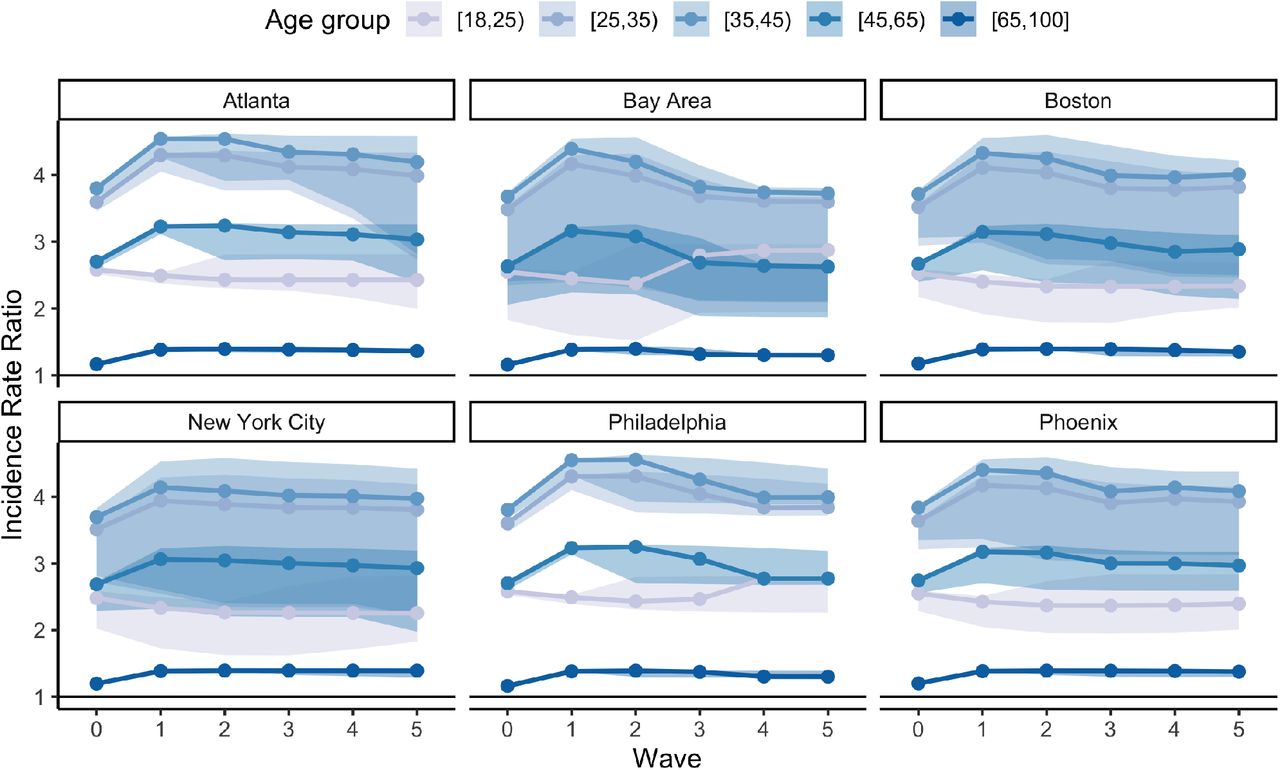
The changes in the incidence rate ratio across survey waves and DMAs that are evident in Figure 3 contrast with the time- and DMA-invariant estimates from the simulation results when the model is parameterized with alternative contact rate estimates commonly used in the literature (Supplementary Figure S10). Although these alternative contact matrices are scaled at each wave to change the intensity of contacts based on information from the BICS survey, the age-structured contact patterns are invariant over time, highlighting the need for frequent up-to-date empirical estimates. As a result, the estimated IRRs for different age groups relative to the youngest age group of 0-17 year olds are stable over time, and differences between DMAs are driven by differences in their demography rather than changes in the contact patterns.
Discussion
The ongoing COVID-19 pandemic and physical distancing policies have fundamentally altered interpersonal interactions across the US and globally. Yet, little is known about how contact rates and patterns have changed and the implications for SARS-CoV-2 transmission dynamics. We studied contact rate patterns across six DMAs in the US over the course of the COVID-19 pandemic, and modeled the impact of changing contact patterns on incidence across different age groups. We find that the median and mean number of contacts reported across survey waves steadily increased from March 2020 to September 2020 before declining slightly. Mean contact rate differences were driven by shifting distributions of rates, with some individuals reporting many contacts per day. We find consistent differences across age groups; 18-34 year olds reported among the highest mean number of contacts across survey waves in all DMAs, while 65+ year olds reported the lowest. The similarity in contact patterns across DMAs is surprising given their heterogeneity in the timing and reinforcement of different physical distancing policies, although this may reflect the fact that the six DMAs included in the BICS study are all large, urban metropolitan areas.
Our simulation results suggest time- and DMA-varying differences in the relative incidence of COVID-19 infections by age groups. Despite 65+ year olds having a higher susceptibility to infection relative to other age groups, they had comparable or lower incidence rates of COVID-19 in our simulations relative to younger age groups due to their substantially lower mean daily contact rates. In contrast to the results from the model parameterized with empirical contact rate estimates from BICS, the simulation results using synthetic contact data fail to capture shifts in the proportion of COVID-19 cases by age group. This difference reinforces the value of collecting empirical contact rate estimates in order to capture spatial and temporal changes in contact rates and patterns.
This analysis has several limitations to consider. First, BICS uses a quota sample from an online panel instead of a probability sample. However, respondent-level calibration weights were estimated to adjust for sample composition to produce representative surveys for each DMA. Moreover, information bias is a concern for contact surveys due to difficulties with recall and social desirability bias, which may be expected to be especially pronounced in the middle of a pandemic. Respondents may therefore have under-reported their number of contacts in the survey. At the same time, the BICS survey captures only two-way conversational and physical contacts. Other types of contacts that might be relevant to SARS-CoV-2 transmission, including, for example, contacts that happen from being in close proximity to others, were not captured in this analysis. The analyses also did not take into account the nature of these conversational and physical contacts, such as mask wearing, distance maintained during the contact, and duration of the contact. In terms of generalizability, the BICS is only offered in English, limiting the ability to generalize results to Americans whose primary language is not English. Lastly, since children, defined as less than age 18, are not included in the BICS, previously developed methods were used to fill missing data values for the youngest age group.
A key limitation of the simulation results is the significant parameter uncertainty of the compartmental model. To capture some of this uncertainty, we used a range of values for our estimate of R0. Our method for estimating the reproduction number (Wallinga & Teunis, 2004) assumes that all cases in our dataset acquired infections from others in the dataset, and it thereby excludes unreported cases and asymptomatic individuals; this may bias the estimate if the proportion of unreported cases changed over time. Lastly, comparisons between the proportion of simulated cases by age group and the proportion of observed COVID-19 cases are difficult to make due to differences in age categorization of the observed data, as well as temporal changes in testing rates by age, which are not captured in our model. We therefore only presented these comparisons for New York City and Phoenix.
Contact rate estimates from the BICS study offer unique insight into how age-structured contact patterns have changed across time and localities in the US during the COVID-19 pandemic. Since the BICS study is an ongoing effort, data from additional survey waves will continue to provide invaluable information on how contact rate patterns continue to change as the COVID-19 pandemic evolves. Examining whether and when contact rates return to prepandemic levels, and understanding the relationship between contact rates and NPIs for SARS-CoV-2 and other respiratory pathogens, are key directions for future research.
Materials and Methods
Survey Population
The BICS data collection occurred in six waves: between March 22 and April 8, 2020 (Wave 0); between April 10 and May 4, 2020 (Wave 1); between June 17 and 23, 2020 (Wave 2); between September 11 and 26, 2020 (Wave 3); between November 29 and December 16, 2020 (Wave 4); and between February 7 and February 15, 2021 (Wave 5). A total of 15,712 respondents were surveyed in the US (Wave 0 n=1,437; Wave 1 n=2,627; Wave 2 n=2,431; Wave 3 n=3,248; Wave 4 n=2,993; Wave 5 n=2,976) (Supplementary Table S1). Respondents were recruited using Lucid, an online panel provider. Two samples were obtained in each survey wave: 1) a quota sample intended to be representative of the US (national sample); and 2) smaller quota samples from the DMAs of New York City, the San Francisco Bay Area, Atlanta, Phoenix, Boston, and Philadelphia (city-level samples). Philadelphia was added in Wave 1.
The survey methodology is described in more detail in Feehan and Mahmud (2021) (Feehan & Mahmud, 2021). In brief, respondents were asked to report the number of people with whom they had contact on the day before the survey interview. Contacts were defined as a two-way conversation with three or more words in the physical presence of another person. Starting in Wave 1, the survey also asked about physical contacts. Demographic information was collected on respondents (e.g. age, gender, race/ethnicity, household size, educational status). Respondents were asked to provide detailed information on up to three of their reported contacts, including demographic information of their contacts, as well as the duration and location of the contact. In Wave 0, respondents reported all contacts, and then reported how many of their contacts were non-household members. Beginning in Wave 1, respondents provided a household roster and then reported their non-household contacts.
All survey respondents provided informed consent and the project was approved by the UC Berkeley IRB (Protocol 2020-03-13128).
Survey Weights
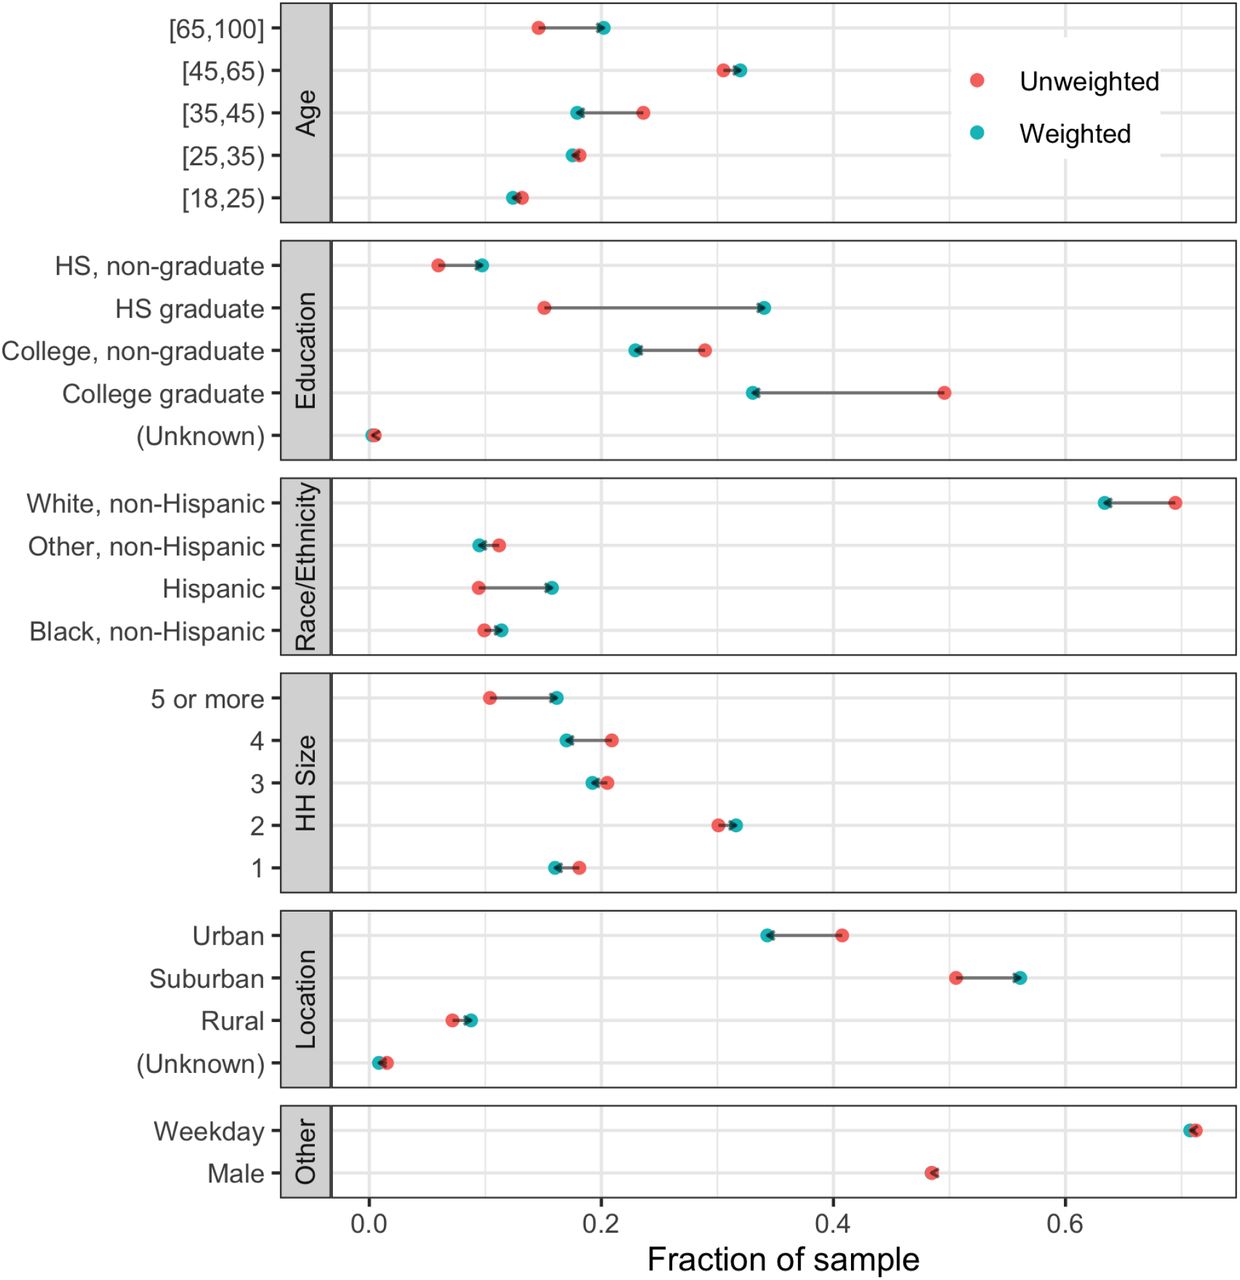
Supplementary Table S2 presents the unweighted survey population’s demographics. Since some respondents were oversampled in select cities, weights were used to account for sample composition, as previously described (Feehan & Mahmud, 2021). Respondent-level weights were estimated to represent the number of people that respondent i represents in their city’s general population. These weights were designed based on a model-based inference approach, in which pseudo-probabilities of inclusion are calculated, and then calibrated based on age categories, sex, age by sex interactions, educations, race, Hispanicity, household size category, and whether the respondent lives in a rural/surburban/urban county. We performed the calibration using the R packages autumn and leafpeepr (Rossell, n.d.; Aaron, n.d.). Characteristics of survey respondents in the unweighted vs. weighted samples are shown in Supplementary Figure S1. Contact-level weights were estimated since detailed information on reported contacts was only collected for a subset of a respondent’s total number of contacts (up to three contacts).
Construction of Contact Matrices
The methods for estimating age-structured contact matrices for each wave and DMA of the BICS study have been previously described (Feehan & Mahmud, 2021), and are summarized here. Respondents were grouped into six age categories: 0-17, 18-24, 25-34, 35-44, 45-64, and 65+. The raw contact matrix M has entries mij, representing the average number of daily contacts between respondents in age group, i, with their reported contacts in age group, j. We adjusted for survey weights, such that mij was calculated as:
 where wt,i is the weight for reports made by participant t, in age group i, and yt,j is the number of reported contacts made by respondent t in age group j. Ti is the total number of respondents in age group i.
We next created a reciprocal contact matrix C, such that on the population level the total number of contacts that respondents in age group i report with individuals in age group j is equal to the number of contacts that respondents in age group j report with individuals in age group i:
 where cij are the entries of the reciprocal contact matrix, C, and Ni and Nj the population size in age class i and j, respectively.
Since children, defined as <18 years old, were excluded from the BICS study, using methods previously developed and used (Klepac et al., 2020; Jarvis et al., 2020), we imputed the within age group average number of contacts for the youngest age group. Briefly, for each wave and DMA of the BICS study, we calculated the ratio of the dominant eigenvalue of the contact matrix estimated from the BICS data to the dominant eigenvalue of the contact matrix estimated for the US from Prem et al. (2021) (Prem et al., 2021), with school contacts removed to reflect school closure policies in 2020. The matrices for this calculation were subset to exclude age groups with missing values. We then multiplied the within age group average number of contacts for the youngest age group from Prem et al. (2021) by this ratio.
Logistic Regression
We examined factors associated with the probability of reporting >7 contacts, where seven represents the 80th percentile in the BICS data across all waves and DMAs. We fit a logistic regression model using maximum likelihood:
 where µi is the probability of respondent i reporting >7 contacts, Xi is a vector of covariates, including age group, DMA, gender, race/ethnicity (Non-Hispanic White, Non-Hispanic Black/Hispanic/Non-Hispanic Other), survey wave, and whether the survey day was a weekday, and β is a vector of the estimated coefficients.
Age-structured Mechanistic Transmission Model
Model Structure
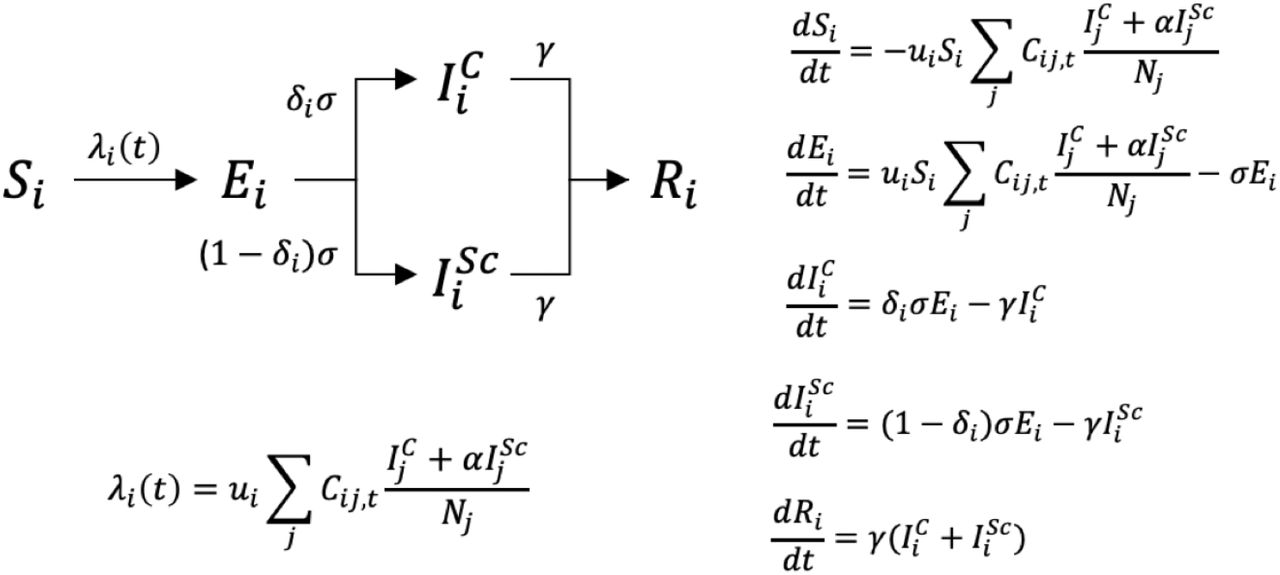
We used an age-structured Susceptible-Exposed-Infectious-Recovered (SEIR) model for each of the six DMAs (Figure 4. The SEIR model has two infectious compartments – clinical and subclinical. Consistent with the definitions used in Davies et al. (2020) (Davies et al., 2020), we defined clinical, infectious individuals as symptomatic individuals, while subclinical, infectious individuals include both pauci-symptomatic and asymptomatic individuals who are likely to remain undetected by surveillance. For all compartments the index i references the age category (0-17, 18-24, 25-34, 35-44, 45-64, and 65+). Individuals in the susceptible compartment, Si, transition to the exposed (but not yet infectious) compartment, Ei, through contact with a clinical or subclinical infectious individual at rate λi(t), which is a time-varying, age-group-specific force of infection. Individuals then transition to either the clinical or subclinical infectious compartment  at rate σ, which is the inverse of the mean latent period. Individuals in the infectious compartments recover at rate γ, which is the inverse of the mean infectious period. Two assumptions incorporated in the model are that subclinical infectious individuals are less infectious than clinical infectious individuals (represented by the reduction factor α), and that the probability of being a clinical vs. subclinical infectious individual is dependent only on age. This model structure is in line with compartmental models frequently used in existing COVID-19 research (Davies et al., 2020; Miller et al., 2020; Prem et al., 2020). Parameters values used in the model are described in Supplementary Table S3.

Age-structured SEIR model structure and corresponding equations representing susceptible (Si), exposed but not yet infectious, (Ei), clinical infectious  , subclinical infectious
  , and recovered individuals (Ri). Age groups [0,18), [18,25), [25,35), [35,45), [45,65), [65,100] are denoted by the index i, ui is the age-dependent probability of infection given contact with an infectious individual, Cij,t is the time-varying number of individuals in age group j contacted by an individual in age group i per day at time t, α is the multiplicative factor by which the probability of infection is reduced for subclinical infections, δi is the age-dependent probability of being clinically infectious, σ is the inverse of the latent period, and γ is the recovery rate.
Simulation Conditions
Simulations start two weeks prior to the first reported case in each DMA and run to the last date of the Wave 5 BICS survey, February 15, 2021. This assumption for the starting date, which attempts to account for delays in the reporting of the initial cases of COVID-19 in the US, results in a starting date across the six DMAs that ranges from the start of February to mid-February. This date range is consistent with estimated introduction times for SARS-CoV-2 in the U.S. (Jorden et al., 2020). To initialize the outbreaks, each DMA starts with the same proportion of the population (p0 = 0.0001) exposed or infected, which is evenly spread across age groups in the exposed (Ei), clinical infectious  , and subclinical infectious
  compartments. The number of susceptible people in each age group at the start of the simulation, (Si), is therefore the number of people in age group in the city based on ACS demographic data, minus the number of people starting in the exposed, clinical infectious, and subclinical infectious compartments. All population values are from the 1-year extract of the 2018 American Community Survey provided by IPUMS (Ruggles et al., 2021). Our model results are robust to starting simulations with different initial proportions exposed or infected, as shown in sensitivity analyses (Supplementary Figure S11).
The age-structured contact matrices for each DMA and wave from BICS were used as the time-varying contact matrices in the SEIR models. Contact matrices from each BICS wave were used during the period in which the survey wave was conducted. We linearly interpolated average reported contacts for each cell of the contact matrices between survey waves to obtain the daily contact matrices Cij,t. Since the Philadelphia DMA was added in Wave 1, we used the Wave 0 national age-structured contact matrix as Wave 0 for contact rates in Philadelphia (Feehan & Mahmud, 2021). The BICS Wave 0 captures contact rates starting mid-March, when social distancing mandates were already enforced. To capture pre-pandemic baseline contact rates we used the model-based synthetic contact matrix estimated by Prem et al. (2021) for the US (Prem et al., 2021). Since the synthetic contact matrix from Prem et al. (2021) is available in 5-year age bands, to align the youngest age group, we assumed that the 15-17 year olds in the Prem et al. (2021) study have the same contact rates on average as 0-14 year olds.
To examine simulation results in the absence of empirical estimates from BICS, we also ran simulations that were parameterized using the same simulation conditions with one exception: the contact matrices were synthetic age-structured contact rates for the US from the literature (Prem et al., 2021). For each BICS wave, we calculated the ratio of the dominant eigenvalue of the DMA-specific BICS contact matrix and the dominant eigenvalue of the Prem et al. (2021) US matrix, representing pre-pandemic contact rates. The estimated ratio from this calculation represents a factor by which to scale the pre-pandemic contact rate estimates to capture changing contact rates over the course of the pandemic. We multiplied the synthetic US contact matrix from Prem et al. (2021) by these scaling factors to obtain the contact rates,  in these simulations:
 where ρBw,d is the dominant eigenvalue of the DMA-specific (d) and wave-specific (w) BICS contact matrix, ρR is the dominant eigenvalue of the Prem et al. (2021) US contact matrix, and Rij is the US contact matrix from Prem et al. (2021). We interpolated between survey waves to obtain daily contact matrices
  .
.
Calibration to Target R0 Estimates
The age-dependent probabilities of infection given contact with an infectious individual, ui, were scaled by calibrating to target R0 estimates. First, we estimated the daily effective reproductive number, Rt, for each DMA using the method developed by Wallinga and Teunis (2004) (Wallinga & Teunis, 2004), which is a likelihood-based method that considers pairs of cases and uses the distribution of the serial interval (i.e. the time interval between successive cases in a transmission chain) and a time series of incident cases. We assumed a serial interval with mean 3.96 days and standard deviation of 4.75 days (Du et al., 2020). We also used an alternate method (Cori, Ferguson, Fraser, & Cauchemez, 2013) for estimating Rt as a sensitivity analysis, although the two estimation methods are expected to yield similar results for our purposes of estimating only early Rt values in a retrospective manner (Gostic et al., 2020). Our target estimates of R0 for each DMA are the maximum mean value estimated from the Wallinga and Teunis (2004) and Cori et. al. (2013) methods in the first week of estimates. Lastly, we multiplied the next-generation matrix (NGM) by a constant to achieve the target dominant eigenvalue, which is R0. Using methods previously described to derive an expression for the NGM (Diekmann, Heesterbeek, & Roberts, 2010), we defined the NGM as the following:
 where ui is a vector of the age-group-specific probabilities of infection given contact with an infectious individual, Cij is the number of individuals in age group j contacted by an individual in age group i based on the Prem et al. (2021) US contact matrix, representing estimates of pre-pandemic contact rates, δi is the age-dependent probability of being clinically infectious, and α is the multiplicative factor by which the probability infection is reduced for subclinical infections.
Parameter Uncertainty
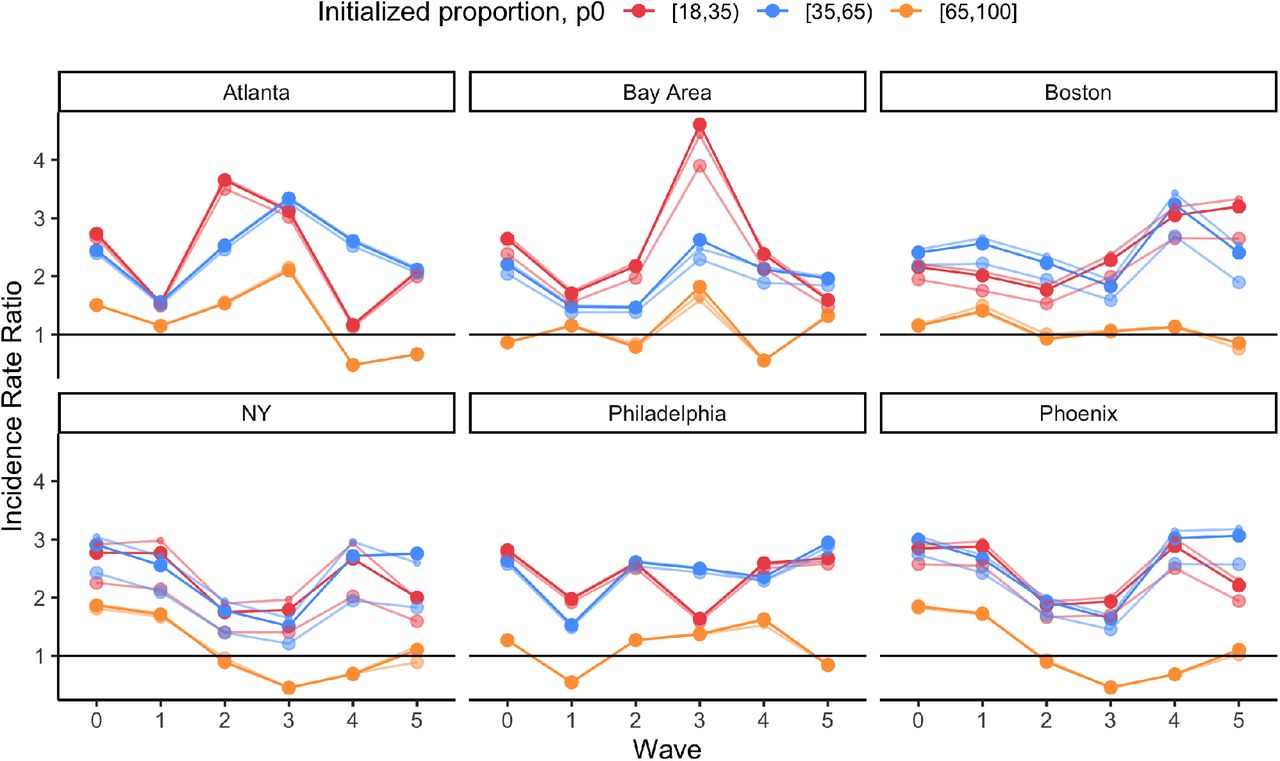
To incorporate parameter uncertainty, we drew 1,000 values of R0 for each DMA from a truncated normal distribution, with the mean estimated from the R0 estimation procedures (Atlanta = 2.4; Bay Area = 2.1; Boston = 2.9; New York City = 3.2, Philadelphia = 2.4; Phoenix = 2.8), a standard deviation of 0.54, and a minimum possible value of 0.8. In a sensitivity analysis, we also varied the proportion of the population assumed to be latent or infectious at the start of the outbreak (p0) from 1/5 to 5 times p0 = 0.0001 (Supplementary Figure S11).
Presentation of Results
In presenting our results, we calculated the incidence rate ratio (IRR) of infections for each BICS survey wave and DMA as the following:
 where i references the age categories 18-34, 35-64, and 65+, w references the BICS survey wave, d references one of the six DMAs, Incidence refers to the simulated incidence on the midpoint date of each BICS survey wave, and N refers to the population size of the age group based on ACS data. IRR estimates shown in Figure 3A are based on simulated total incidence while estimates in Supplementary Figure S8 are based on simulated clinical incidence. We used [0,18) year olds as the reference age group. We collapsed the simulation results into four age categories for visual simplicity due to similar findings in certain age groups, but we show the simulations results for all six age categories in Supplementary Figures S6 and S7.
For New York City and Phoenix, we also compared the simulated proportion of clinical infections in each age group to the empirical proportion of COVID-19 infections in each age group. The New York City data are weekly data from the New York City Department of Health and Mental Hygiene (Coronavirus Data, 2021) on the proportions of positive COVID-19 molecular tests by age group. The data for Phoenix are weekly confirmed and probable COVID-19 cases by age group reported by the Maricopa County Public Health Department (Dashboard: Weekly confirmed and probably COVID-19 cases over time by age group, 2021). Since the youngest age group reported by the Maricopa County Public Health Department data source is [0,19), we treated this age category as [0,18) in order to align this youngest group with our simulation results for plotting purposes. Comparing age-specific simulated and empirical COVID-19 proportions was not possible for the other DMAs due to the lack of empirical data on age categories that are comparable to those in our simulations.
All analyses are conducted in R version 3.6.3.
Data Availability
Data and code to reproduce all results and figures can be found at https://github.com/taylor-chin/bics-age-model-release.
Author Contributions
Taylor Chin, Conceptualization, Methodology, Data Curation, Formal Analysis, Writing - Original Draft Preparation, Writing - Review & Editing; Dennis Feehan, Methodology, Data Curation, Writing - Review & Editing, Funding Acquisition; Caroline O. Buckee, Conceptualization, Writing - Review & Editing; Ayesha S. Mahmud, Conceptualization, Methodology, Data Curation, Writing - Review & Editing, Supervision, Funding Acquisition
Data and Code Availability
Data and code to reproduce all results and figures can be found at https://github.com/taylor-chin/bics-age-model-release.
Declaration of Interests
None
Funding Source
Seed funding was provided by a Berkeley Population Center pilot grant (NICHD P2CHD073964) and further funding was provided by the Hellman Fellows Program.
Supplementary Material
Survey sample size by BICS survey wave and DMA
Characteristics of BICS survey respondents (unweighted)
Parameters used in SEIR model

Characteristics of BICS survey respondents when weighted vs. unweighted. We used calibration weights to improve the representativeness of our sample. Each facet shows the unweighted (red) and calibration weighted (blue) composition of survey respondents for a given covariate.

Estimated exponentiated coefficients from the logistic regression, where the outcome is the odds of reporting >7 contacts, representing the 80th percentile in the BICS data.

The mean number of contacts reported by BICS participants aged 18-24, 25-34, 35-44, 45-64, and 65+ years old during survey Waves 0-5 in each DMA of the BICS study.

Estimated age-structured contact matrices for all contacts reported in each survey wave and DMA from the BICS.

Estimated age-structured contact matrices for non-household contacts reported in each survey wave and DMA from the BICS.

Mechanistic model results of total incidence for six age groups using BICS contact rate data, with comparisons to observed data where possible. Simulated incidence rate ratio (IRR) using total incidence for each DMA and BICS survey wave comparing 18-24, 25-34, 35-44, 45-64, and 65+ year olds to the reference age group of 0-17 year olds. 90% uncertainty bounds are estimated from running 1,000 simulations with 1,000 different values of R0. The mathematical model is parameterized using empirical contact rate estimates from the BICS study. B) Scatterplot comparing the proportion of COVID-19 cases in each age group (represented by symbol shape) and survey wave (represented by symbol color) estimated in the simulation vs. reported in actual epidemiological data for New York City. The empirical data for New York City represent the proportion of positive COVID-19 molecular tests by age group for New York City). C) Scatterplot comparing the proportion of COVID-19 cases in each age group (represented by symbol shape) and survey wave (represented by symbol color) estimated in the simulation vs. reported in actual epidemiological data for Phoenix. The empirical data for Phoenix represent the proportion of confirmed and probable COVID-19 cases reported in Maricopa County.

Mechanistic model results of total incidence for six age groups using alternative contact rate data. Simulated incidence rate ratio (IRR) using total incidence for each DMA and BICS survey wave comparing 18-24, 25-34, 35-44, 45-64, and 65+ year olds to the reference age group of 0-17 year olds. 90% uncertainty bounds are estimated from running 1,000 simulations with 1,000 different values of R0. The mathematical model is parameterized using pre-pandemic synthetic contact rate estimates that have been scaled at each BICS survey wave using information from the BICS study.

Mechanistic model results of clinical incidence for four age groups using BICS contact rate data. A) Simulated incidence rate ratio (IRR) using clinical incidence for each DMA and BICS survey wave comparing 18-34, 35-64, and 65+ year olds to the reference age group of 0-17 year olds.. 90% uncertainty bounds are estimated from running 1,000 simulations with 1,000 different values of R0. The mathematical model is parameterized using empirical contact rate estimates from the BICS study.

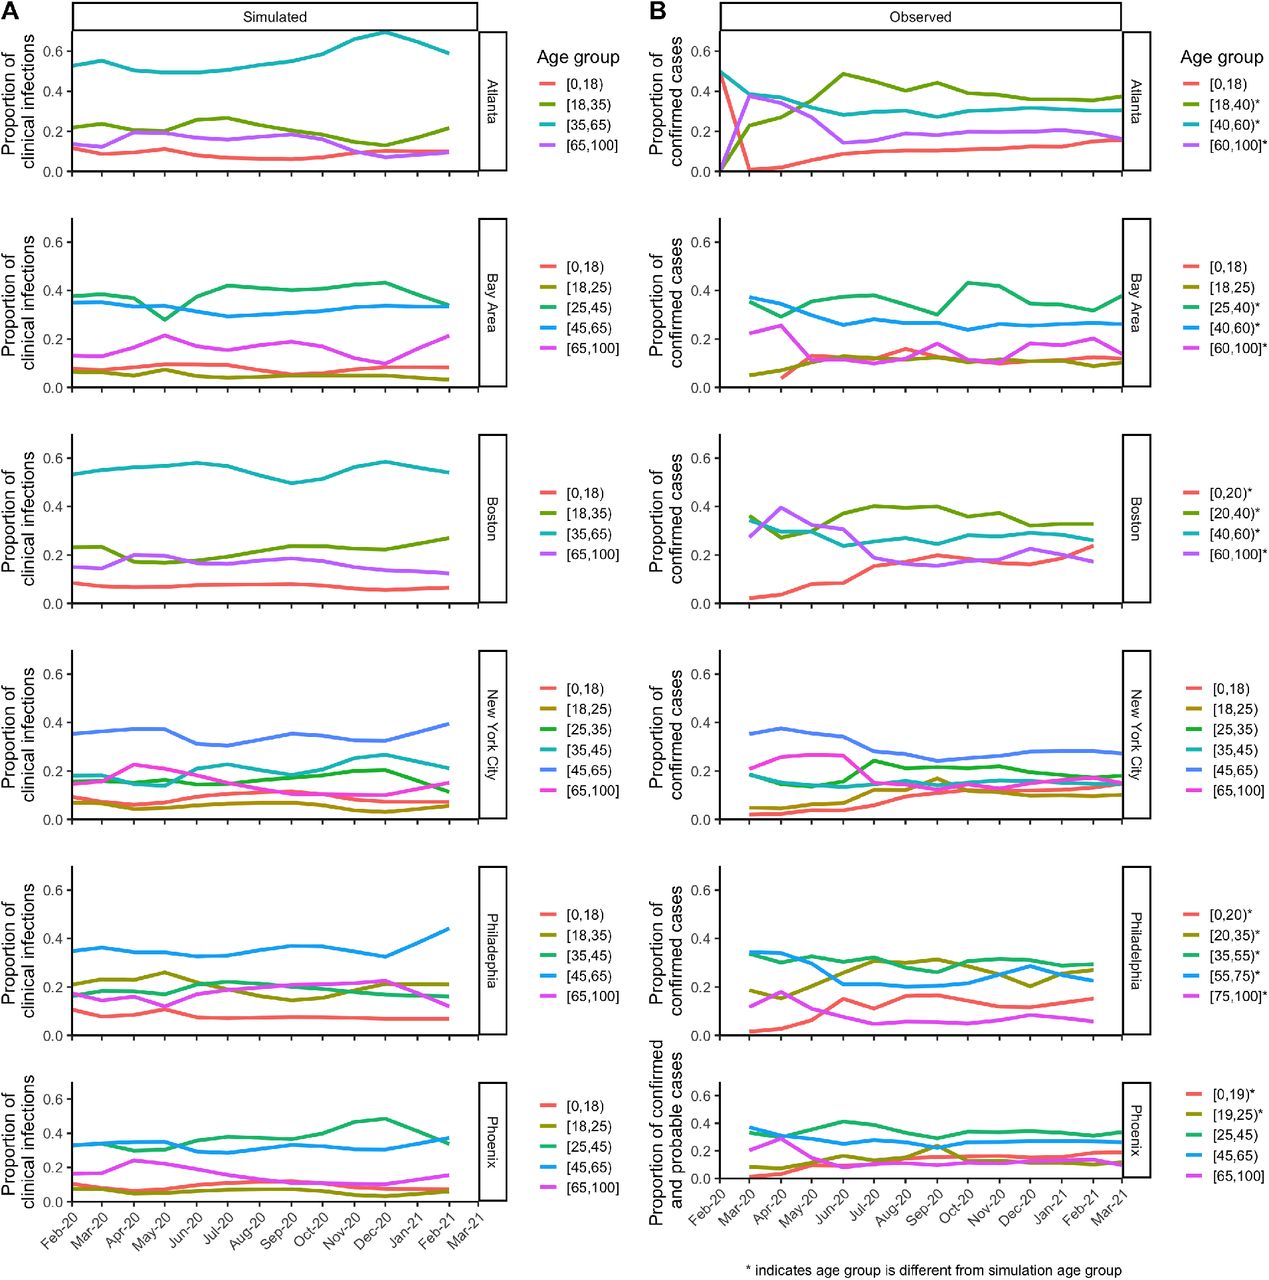
Comparisons of the proportion of clinical infections estimated from the mechanistic model vs. observed data for each DMA. A) Proportion of simulated clinical infections by age group in each DMA, aggregated by month. Note that the age groups presented for each DMA are different in order to align the simulated and observed data as closely as possible. B) Observed proportion of cases by age group in each DMA, aggregated by month. Note that except for New York City, the age groups presented in the observed data do not perfectly match those from the simulation. Data for Atlanta DMA are based on the daily number of new confirmed cases by age group for Georgia state (COVID-19 Status Report, 2021). Data for the San Francisco Bay Area DMA are based on the daily number of new confirmed cases by age group for the city of San Francisco (COVID-19 Cases Summarized by Age Group, 2021).Data for Boston DMA are based on the weekly proportion of positive test results by age group for Massachusetts state (Archive of COVID-19 cases in Massachusetts (COVID-19 Raw Data - March 22, 2021), 2021). Data for New York City DMA are based on the weekly proportion of positive test results by age group for New York City (Coronavirus Data, 2021). Data for Philadelphia DMA are based on the weekly number of confirmed cases per 10,000 population by age group for the city of Philadelphia, which were then combined with demographic data from ACS (Testing data (Trends, Infections by Age), 2021). Data for Phoenix DMA are based on the weekly number of confirmed and probable COVID-19 cases by age group for Maricopa County (Dashboard: Weekly confirmed and probably COVID-19 cases ove2r7 time by age group, 2021). Except for Boston, data were summed over days or weeks to aggregate to months. For Boston, the third week of each month was selected to represent the month’s value.

Mechanistic model results of total incidence for four age groups using alternative contact rate data. Simulated incidence rate ratio (IRR) using total incidence for each DMA and BICS survey wave comparing 18-34, 35-64, and 65+ year olds to the reference age group of 0-17 year olds. 90% uncertainty bounds are estimated from running 1,000 simulations with 1,000 different values of R0. The mathematical model is parameterized using pre-pandemic synthetic contact rate estimates that have been scaled at each BICS survey wave using information from the BICS study.

Mechanistic model results of total incidence for four age groups with varied p0, using BICS contact rate data. Simulated incidence rate ratio (IRR) using total incidence for each DMA and BICS survey wave comparing 18-34, 35-64, and 65+ year olds to the reference age group of 0-17 year olds. Solid colored lines represent results when simulations are seeded with p0 = 0.0001. Lighter colored lines for each age group represent simulations seeded with p0 = 0.00002 and p0 = 0.0005 as sensitivity analyses. The mathematical model is parameterized using empirical contact rate estimates from the BICS study.
Acknowledgments
The authors thank Inga Holmdahl and Rebecca Kahn for their helpful comments and feedback.
References


