
Abstract
Reluctant eye contact and reduced social interactions characteristic of autism spectrum disorder (ASD) are consistent with deficits in oculomotor and face processing systems. We test the hypothesis that these deficits are interrelated ASD.
Eye-tracking and hyperscanning with functional near-infrared spectroscopy (fNIRS) were used to acquire neuroimaging data during live, dynamic eye-to-eye contacts in 17 ASD and 19 typically-developed (TD) adults. Real eye contact conditions were contrasted with conditions where eye gaze was directed at a comparable dynamic face video. These findings were regressed with eye-contact dwell-time, i.e., times when gaze of both partners was in the eye-box of the other, to confirm the relationship between visual sensing and neural coding. Visual fixations and positional variance were also determined.
Average gaze dwell-times in the “eye-box” did not vary between ASD and TD participants but were longer for the Real Eye than Video Eye condition for both groups. However, positional gaze variability, “jitter”, was higher for ASD in both conditions. Neural findings for TD [Real Eye > Video Eye] were consistent with previous findings for interactive face-gaze with activity in right temporal and dorsal parietal regions. However, in ASD ventral temporal regions were observed for this contrast without evidence for dorsal parietal activity. This neural difference was enhanced when regressed by eye-contact dwell-times.
Together findings are consistent with the hypothesis that unstable bottom-up oculomotor signals contribute to deficits in live face processing and reduced dorsal stream activity in ASD.
Significance Eye contact avoidance is a diagnostic feature of autism spectrum disorder (ASD). However, the underlying neural mechanisms are unknown. Using a two-person neural imaging system and a face-to-face paradigm with eye tracking, we found that the neural systems activated by live eye contact differed between typically developed (TD) and ASD groups. In ASD, the ventral occipital parietal systems were engaged, whereas in TD, the dorsal posterior parietal systems were engaged. Positional variation of eye gaze, “jitter”, was higher in ASD than TD. These findings are consistent with the hypothesis that bottom-up variations in visual sensing are components of altered interactive face processing and dorsal stream mechanisms and may contribute to the neural underpinnings of reluctant eye contact behaviors in ASD.
Introduction
Eye contact with another human being is an impactful and fundamental component of in-person social behavior. Intermittent eye-to-eye fixations are widely thought of as particularly potent stimuli. For example, proverbial claims that “the eyes are the window to the soul” are taken as self-evident, and eye-to-eye contact is attributed with literary properties such as the “spark” that ignites a “social synapse” that initiates the sharing of information between two human beings. Wisdom regarding the social significance of eye gaze is long-standing in classical literature and may have its source in a quote from Marcus Tullius Cicero‘s Orator: “Ut imago est animi voltus sic indices oculi” – For as the face is the image of the soul, so are the eyes its interpreters (Cicero, 46 BC). Although there are cultural variations related to the interpretation of interpersonal eye gaze (Matsumoto et al., 2002; Ewbank et al., 2009; Akechi et al., 2013; Uono and Hietanen, 2015), eye contacts generally signal cues such as levels of engagement, emotional status, intention, judgment, and an array of nuanced exchanges of social information including an invitation for interaction. Direct eye-contact with another person is conventionally taken as a significant interaction event, regardless of the cultural norms.
Atypical behavioral responses to eyes, such as reluctance to make eye contact, contribute to the social characteristics associated with autism spectrum disorder (ASD), a pervasive developmental disorder (Bookheimer et al., 2008). For example, variations in patterns of eye-gaze are well documented in ASD (Pelphrey et al., 2002; Pelphrey et al., 2005; Nation and Penny, 2008; Schneier et al., 2009; Senju and Johnson, 2009; McPartland et al., 2011; Jones and Klin, 2013), as well as reduced responses to emotional cues conveyed by facial dynamics and reduced production of facial expressions that signal emotional content (Chawarska et al., 2003; Dawson et al., 2005; Campbell et al., 2006). Consistent with these behavioral characteristics, electroencephalography (EEG) findings in ASD show increased latency of event-related potentials (ERPs) to eye stimuli relative to typically developed (TD) participants (McPartland et al., 2004; McPartland et al., 2010), and these delayed neural responses to eyes are associated with early stages of visual processing. Recently, this latency has been shown to be related to gaze directed to the eyes of a pictured face (Parker et al., 2021). Reduced occipital pole responses to pictured eyes for ASD participants observed by fMRI are also consistent with atypical early visual processing (Tanabe et al., 2012), and gaze at pictured eyes with emotional content has been associated with abnormally high activation in subcortical systems including superior colliculus, pulvinar nucleus of the thalamus, and the amygdala (Hadjikhani et al., 2017). Consistent with these findings, elevated amygdala responses to neutral faces have also been associated with gaze to the eye-region (Tottenham et al., 2014).
While these findings suggest abnormalities in the early stages of neural and visual processes associated with static representation of faces in ASD, there is also evidence for impairment of social-communicative information from later stages of processing, such as expressive faces (Hadjikhani et al., 2007), and other interpretations of social stimuli (Weisberg et al., 2014). Hypoactivation of higher-level and widely distributed brain areas previously associated with face processing in ASD have also been reported, including superior temporal sulcus and face-related dorsal areas consisting of the somatosensory and premotor cortex (Hadjikhani et al., 2007). These prior findings of both atypical lower- and higher-order face processing based on behavioral observations, EEG, fMRI, and fNIRS are consistent with the overarching hypothesis of impacted social-communicative systems in ASD (Golarai et al., 2006). The current study seeks to investigate these interrelated pathways using ecologically valid methods of measuring brain responses and eye-contact behaviors (visual sensing) during natural face-to-face interactions with a real or a dynamic video social partner.
Methods and Materials
TD and ASD adults were compared during gaze at the real eyes of a confederate and at a comparable dynamic face video (instructions were to gaze at the eyes under both conditions). In the real-person interaction condition (Real Eye) participants and a same-sex confederate viewed each other’s faces directly while sitting across a table from one other. Findings were compared with a condition in which participants and their confederate partners viewed the eyes of a size-matched face displayed on a video monitor (Video Eye). Within the framework of the Interactive Brain Hypothesis, the contrast between these two conditions and these two groups tested the hypothesis that neural processes responsive to real eye-to-eye contact are altered in ASD relative to TD. Eye tracking during these conditions was used to test the related hypothesis that gaze characteristics (visual sensing) also varied during face processing between TD and ASD.
Participants
Participants included 17 healthy Autism Spectrum Disorder (ASD) adults (3 female; mean age 25±4.9 years; 12 right-handed, 3 left-handed, and 2 ambidextrous (Oldfield, 1971)) whose diagnoses were verified by gold standard, research-reliable clinician assessments, including the Autism Diagnostic Observation Schedule, 2nd Edition (ADOS-2 (Lord et al., 2012)) (Table S1), and expert clinical judgment using DSM-5 criteria (American Psychiatric Association, 2013); and 19 healthy, typically-developed (TD) adults (mean age 26±5.8 years; 18 right-handed and 1 ambidextrous) (Table S2). Participants were recruited from ongoing research in the McPartland Lab, the Yale Developmental Disabilities Clinic, and the broader community through flyers and social media announcements. Inclusion criteria included age 18-45 years, IQ≥70, and English speaking. Exclusion criteria included diagnosis of bipolar disorder, personality disorder, or schizophrenia spectrum disorder; anti-epileptic, barbiturate, or benzodiazepine medication use; history of seizures, brain damage, or recent serious concussion; alcohol use within 24 hours; recreational drug use within 48 hours; chronic drug abuse; medication changes within two weeks; sensory impairment or tic disorder that would interfere with fNIRS recording; history of electroconvulsive therapy; or genetic or medical condition etiologically related to ASD. Additional exclusionary criteria for TD participants included self-report of any psychiatric diagnosis or learning/intellectual disability; psychotropic medication; or a first degree relative with ASD. All participants provided written and verbal informed consent in accordance with guidelines and regulations approved by the Yale University Human Investigation Committee (HIC #1512016895), and were reimbursed for their participation. Assessment of the ASD participants’ capacity to capacity to give informed consent was was provided by consensus of trained professional staff who monitored the process and confirmed verbal and non-verbal responses. ASD participants were accompanied at all times by a member of the clinical team, who continuously evaluated their sustained consent to participate.
All participants were characterized by gender, age, full scale IQ (FSIQ-4 as estimated by the Wechsler Abbreviated Scale of Intelligence, 2nd Edition (WASI-II) (Wechsler, 2011), and self-reported clinical characteristics on several questionnaires, including the Autism-Spectrum Quotient (AQ (Baron-Cohen et al., 2001)); Broad Autism Phenotype Questionnaire (BAPQ (Hurley et al., 2007)); Social Responsiveness Scale, Second Edition (SRS-2 (Constantino and Gruber, 2012)); Beck Anxiety Inventory (BAI (Beck and Steer, 1991)); State-Trait Anxiety Inventory (STAI (Spielberger et al., 1983)); and the Liebowitz Social Anxiety Scale (LSAS (Fresco et al., 2001)). See Tables S3 and S4 for detailed demographic and statistical comparisons between the two groups. Group comparisons of clinical assessments indicated expected differences on the AQ (p≤0.01); BAPQ (p≤0.01); SRS (p≤0.01); and BAI scales (p≤0.05), and failed to provide evidence for differences on the WASI-II, STAI, and LSAS between the groups. Assessment and diagnostic tests were performed in clinical facilities at the Yale Child Study Center.
Participants were escorted from the clinical environment to the research environment for fNIRS / eye-tracking experiments. An investigator was present during the data acquisition and monitored signs of discomfort during the experiment. All participants were paired with a same-gender TD confederate. One male (27-28 years old over the course of data collection) and one female (22-23 years old over the course of data collection) served as confederates throughout the entire study. Confederates were not informed of the participant’s group membership prior to the experiment. Determination of a sample size sufficient for a conventional power of 0.80 is based on contrasts (Real face > Video Face) observed from a previous similar study (Noah et al., 2020). Using the power package of R statistical computing software (R Core Team, 2018) a significance level of 0.05 is achieved with 15 pairs. Sample sizes of 17 pairs (ASD) and 19 pairs (TD) assure adequate effect sizes.
Experimental Design and Statistical Analyses
Experimental Procedures and Paradigm
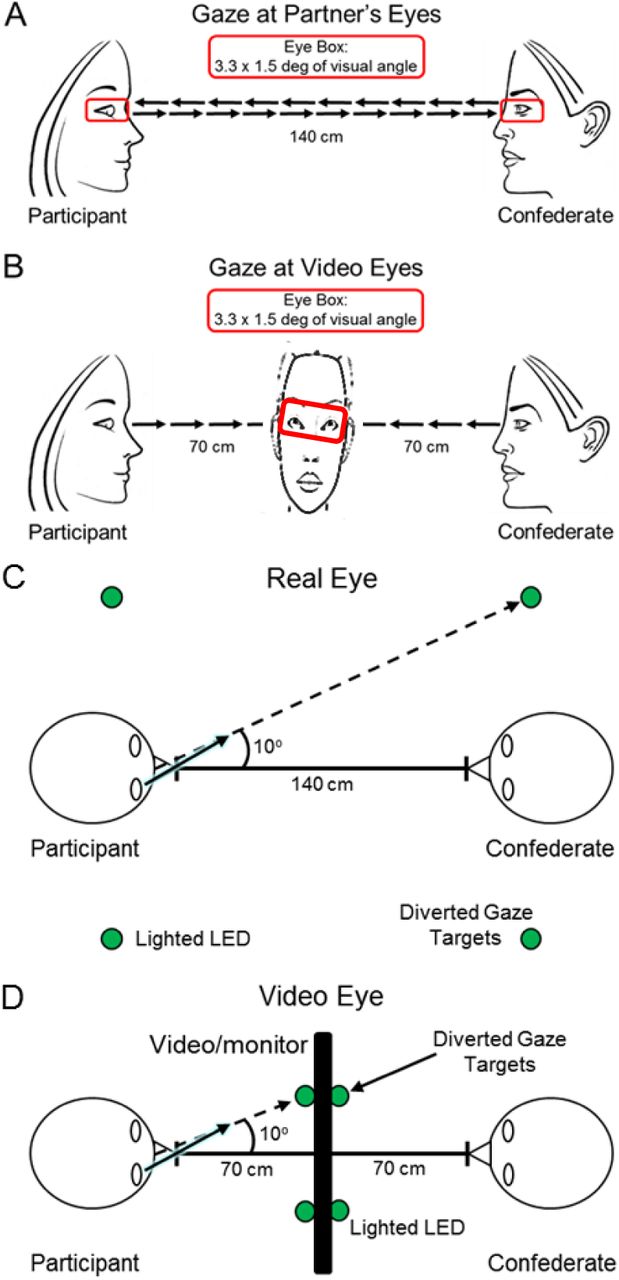
Dyads (participant and gender-matched confederate) were seated 140 cm across a table from each other and set up with an extended head-coverage fNIRS cap and remote eye-tracking. Each participant was instructed to look straight ahead either at their partner or at a monitor adjusted in size to subtend the same visual angles as the real face (Figure 1A and B). In the live “Real Eye” task, dyads were instructed to gaze at each other’s eyes during cued 3-second epochs (1A) and in the video (“Video Eye”) task, dyads were instructed to gaze at the eyes of the face as it appeared in a dynamic video (1B). The illustrative red box enclosing the eyes of the participants in Figure 1 subtended 3.3×1.5° of visual angle and defined the location of the “eye-box,” a region designated as the eye contact zone for each participant. In both tasks, dyads alternated their gaze between the eyes of their (real or video) partner and two small light emitting diodes (LEDs) located 10° to the left and 10° to the right of their partner (Figure 1C and D). The video was a recorded version of a same-sex participant performing the same task while wearing the same optode cap as live participants.

A. Gaze at partner’s eyes: Real Eye condition. Partners viewed each other at an eye-to-eye distance of 140 cm. The eye regions subtended by both the real eyes and the video eyes were 3.3 × 1.5 degrees of visual angle (red boxes). Small green LED indicator lights located to either side of their partner indicated rest and diverted gaze targets. B. Gaze at eyes in video: Video Eye condition. Two 24-inch 16×9 monitors were placed between the participants and a size-calibrated, pre-recorded dynamic video of a face was presented in the same field-of-view as the live interaction. C. Diagram of the Real Eye condition, with participant and confederate sitting 140 cm apart from each other and LED indicator lights placed 10 degrees to the left and right of the Eye. D. Diagram of the Video Eye condition, with monitors arranged between partners. The face and LED sizes and positions were calibrated to subtend the same visual angles in both conditions.
The order of runs was randomly sequenced between viewing a real partner directly or viewing a visual-angle corrected video partner on a 24-inch 16×9 computer monitor placed back-to-back between participants, including a partition to assure that dyads could not see their real partner during video conditions. The face and distance of the video stimuli were calibrated to subtend identical degrees of visual angle in the field of view of the participants and the timing and range of motion of eye movements between partners was the same in both tasks. The time-series and experimental details were similar to prior studies (Hirsch et al., 2017; Noah et al., 2020).
At the start of each task, an auditory cue prompted participants to gaze at the eyes of their real or recorded partner. Subsequent auditory tones alternatingly cued eye gaze between eyes or LED according to the protocol time series. The 15-second active task period alternated with a 15-second rest/baseline period. The task period consisted of three 6-second cycles in which gaze alternated on the partner for 3 s, and then on a lighted LED to either the right or left (alternating) of the participant for 3 s for each of three events. The time series was performed in the same way for all runs. The order of runs was counterbalanced across pairs of participants. During the 15-second rest/baseline period, participants focused on the lighted LED, as in the case of the 3-second periods that separated the eye contact and gaze events. The 15-second activity epoch with alternating eye contact events was processed as a single block.
The experimental paradigm (Figure 2A) employed a classic hemodynamic time series with 15 s of task alternating with 15 s of rest. Run length was 3 m, and included six task-rest cycles. Due to the social discomfort associated with prolonged mutual gaze at another’s eyes, the task epochs were subdivided into events (epochs) that alternated between three 3-second eye-on and 3-second eye-off cycles (see Fig 2A). During the “eye-on” epoch, dyads were instructed to gaze at the eyes of their (real or video) partner, making eye contact as often as possible in natural intervals. An auditory tone signaled the transition between eye-on and eye-off events indicating when participants were instructed to divert their gaze to the LED targets 10° to the right or left.

A. Time course. The duration of the run was three minutes, and each run was repeated twice for both the Real Eye and the Video Eye conditions. Each run included six alternating 15-second task and rest periods. In the task period (blue bars), participants alternated their gaze in three-second epochs between the eyes and the left or right lighted LED (See Fig 1, C and D). During the 15-second rest period, participants looked only at the lighted LED. The task is similar to those used in previous experiments (Hirsch et al., 2017; Noah et al., 2020). B. Eye-tracking traces of eye-to-eye contact. Red traces represent eye movements from an ASD participant; blue traces represent the eye movements of a confederate partner. The eye-tracking data acquired on the Tobii system provides a frame-by-frame (8 ms) binary value that indicates whether or not eye gaze was directed within the eye-box of the partner. The blue dashed line (top) represents the duration of eye gaze (number of frames) that the confederate’s gaze was within the eye-box of the participant. Similarly, the red dashed line (bottom) represents the duration of gaze (number of frames) that the participant’s eye gaze was in the eye-box of the confederate. The green dashed line (middle) represents the length of time (number of frames) that the eyes of both partners were simultaneously focused within each other’s eye-boxes for a minimum of 83 ms. This is taken as a measure of eye-to-eye contact between the participant and the confederate.
Eye Tracking
Two Tobii Pro x3-120 eye trackers (Tobii Pro, Stockholm, Sweden), one per participant, were used to acquire eye tracking data at a sampling rate of 120 Hz. Eye trackers were mounted on the experimental apparatus facing each participant. Prior to the start of the experiment, a three-point calibration method was used to calibrate the eye tracker on each participant. The partner was instructed to stay still and look straight ahead while the participant was told to look first at the partner’s right eye, then left eye, then the tip of the chin. The same calibration procedure for video interactions was performed prior to recording on a still image presented on the monitor 70 cm in front of the participants. Similar “live-calibration” procedures have been used successfully in prior investigations of in-person social attention (Falck-Ytter, 2015; Thorup et al., 2016). As instructed for the eye-movement task, participants alternated their gaze between ≈0° and 10° of deflection. Participants fixated on the eyes of the video (Video Eye Condition) or the eyes of the confederate partner (Real Eye Condition) ±10° deflections to either the left or right. The eye contact portions of the task were 3 s in length, with six per trial, for 18 s of expected eye contact over the trial duration (Figure 2B).
Eye-tracking confirmed compliance with task instructions, as is illustrated in Figure 2B for a confederate (blue trace) and an ASD participant (red trace). The x-axis represents the run time series (180 s), and the y-axis represents the gaze angle, where 0 represents eye-to-eye contact and ±10° indicates left and right deflections respectively. The moments of dyadic eye-contact (gaze is within the eye-box of their partner) are indicated by the green line. The time series of Fig 2A and 2B are synchronized for illustrative purposes. The blue and red dashed lines above and below the eye position trace indicate the times of gaze locations that are within the eye-box of the partner for the confederate and the ASD participant respectively. An “eye-box hit” is defined when the gazes of both partners are within the designated eye-box of the other for a minimum of 83 ms, 10 frames (Dravida et al., 2020). The green colored dots in the figure indicate these 10-frame time points where the gaze of both partners was in the “eye-box” of the other. The eye-contact performance for each participant is illustrated in Figures S2 and S3 where the percentage of time in the eye-box of the confederate is represented by a color bar for the entire run time (180 s).
Functional NIRS Signal Acquisition and Channel Localization
Functional NIRS signal acquisition, optode localization, and signal processing, including global mean removal, were similar to methods described previously (Noah et al., 2015; Zhang et al., 2016; Noah et al., 2017; Piva et al., 2017; Zhang et al., 2017; Dravida et al., 2018; Hirsch et al., 2018) and are briefly summarized below. Hemodynamic signals were acquired using 3 wavelengths of light, and an 80 fiber multichannel, continuous-wave fNIRS system (LABNIRS, Shimadzu Corp., Kyoto, Japan). Each participant was fitted with an optode cap with predefined channel distances. Three sizes of caps were used based on the circumference of the heads of participants (60 cm, 56.5 cm, or 54.5 cm). Optode distances of 3 cm were designed for the 60 cm cap, but were scaled equally to smaller caps. A lighted fiber-optic probe (Daiso, Hiroshima, Japan) was used to remove all hair from the optode channel prior to optode placement.
Optodes consisting of 40 emitters and 40 detectors were arranged in a custom matrix, providing a total of 54 acquisition channels per participant. The specific layout with the coverage of the optode channels is shown in Figure S1. For consistency, placement of the most anterior channel of the optode holder cap was centered 1 cm above nasion. To assure acceptable signal-to-noise ratios, resistance was measured for each channel prior to recording, and adjustments were made for each channel until all recording optodes were calibrated and able to sense known quantities of light from each laser wavelength (Tachibana et al., 2011; Ono et al., 2014; Noah et al., 2015). Anatomical locations of optodes in relation to standard head landmarks were determined for each participant using a Patriot 3D Digitizer (Polhemus, Colchester, VT) (Okamoto and Dan, 2005; Singh et al., 2005; Eggebrecht et al., 2012; Eggebrecht et al., 2014; Ferradal et al., 2014). Montreal Neurological Institute (MNI) coordinates (Mazziotta et al., 2001) for each channel were obtained using NIRS-SPM software (Ye et al., 2009) with WFU PickAtlas (Maldjian et al., 2003; Maldjian et al., 2004).
Statistical Analysis of Eye Contact and Dwell Time
Eye tracking data were exported from the Tobii system to the data processing pipeline and custom scripts in MATLAB were used calculate the mutual eye contact events, accuracy, and latency to targets. Data were not usable on 5 out of 17 ASD participants and 4 out of 19 TD participants due to either calibration or equipment problems (right columns of Tables S1 and S2 summarize the eye-tracking acquisitions). Tobii Pro Lab software (Tobii Pro, Stockholm, Sweden) was used to create areas of interest for subsequent eye tracking analyses run in MATLAB 2014a (Mathworks, Natick, MA). The “eye box” was created manually for each run and each participant for both live and video sequences. For the measures of gaze duration and variability, the horizontal component of gaze trajectories was gated by the eye-to-eye portions of each trial, retaining only samples that were within the eye-box range.
This analysis used only the zero angle (eye contact) intervals to characterize participant eye-contact behavior. The eye-tracking source was the horizontal component of post-processed trajectories converted to units of arc length (tenths of degree). There were 1350 observations of 27 participants (15 TD, 12 ASD). To avoid possible inclusion of the large movements into and out of the valid range, the first and last 200 ms of each eye contact interval were excluded. Two measures were obtained from each interval: Dwell Time, the number of valid retained samples per interval normalized by sampling rate (seconds), and Gaze Variability, the standard deviation of the samples centered over each interval, normalized by the number of retained samples (Figure 3A and B). Linear mixed-effect models were used to assess the fixed effects of group (TD, ASD) and condition (Video Eye, Real Eye), with random intercepts by participant.

(Blue: Autism Spectrum Disorder (ASD) participants; Red: Typically-developed (TD) participants). A. Dwell time duration of eye contact on either the eyes in the video (Video Eye condition) or eyes of the confederate partner (Real Eye condition). B. Standard deviation of horizontal gaze trajectory normalized by duration of contact. Error bars show SEM. ***p≤0.001, *p≤0.05.
fNIRS Signal Processing
Raw optical density variations were acquired at three wavelengths of light (780 nm, 805 nm, 830 nm), which were translated into relative chromophore concentrations using a Beer-Lambert equation (Hazeki and Tamura, 1988; Matcher et al., 1995; Hoshi, 2003). Signals were recorded at 30 Hz. Baseline drift was removed using wavelet detrending provided in NIRS-SPM (Ye et al., 2009). In accordance with recommendations for best practices using fNIRS data (Yücel et al., 2021), global components attributable to blood pressure and other systemic effects (Tachtsidis and Scholkmann, 2016) were removed using a principal component analysis (PCA) spatial global mean filter (Zhang et al., 2016; Zhang et al., 2017) prior to general linear model (GLM) analysis. All analyses are reported using the combined OxyHb and deOxyHb signals. The deOxyHb signal is inverted so that a positive result corresponds to increases in brain activity, similar to the OxyHb signal. The combined signal averages are taken as the input to the second level (group) analysis. Comparisons between conditions were based on GLM procedures using the NIRS-SPM software package. Event epochs within the time series were convolved with the hemodynamic response function provided from SPM8 (Penny et al., 2011) and were fit to the signals, providing individual “beta values” for each participant across conditions. Group results based on these beta values were rendered on a standard MNI brain template (TD-ICBM152 T1 MRI template (Mazziota et al., 2001) in SP8 using NIRS-SPM software (Ye et al., 2009) with WFU PickAtlas (Maldjian et al., 2003; Maldjian et al., 2004).
Code Accessibility
Custom code will be provided upon request at fmri.org.
Results
Behavioral Results
Eye Tracking
Even though natural views of real faces and eye-to-eye contacts tend to be reduced in ASD, in this investigation, we asked our participants to look directly at the face of a confederate in-person and make eye-to-eye contacts during cued 3-second periods. The recorded measures of gaze-time in the “eye-box” did not differ systematically between TD and ASD participants for either the Real Eye or Video Eye conditions, confirming compliance with this task: a t-test of median eye-box dwell time percentages showed t(25)=0.28 n.s. (see Table S5). Gaze dwell time assessed using a linear mixed effects model with fixed effects of Group and Condition and random intercepts by participant showed no group difference or interaction, but dwell time for both TD and ASD groups was significantly longer in the Real Eye condition (t=10.88, p≤0.001). However, gaze variability (assessed as standard deviation of the horizontal component of eye trajectory during the eye contact intervals normalized by their duration) was greater for the ASD than the TD group for both conditions, consistent with increased “jitter” in eye-movement patterns in ASD while viewing eyes in either condition (t=2.08, p≤0.05). Figure 3A shows the marginal means plots for these contrasts.
Neural Findings
[Real Eye > Video Eye]
Neural responses that increased during real eye viewing relative to video eye viewing conditions are presented for TD and ASD in Figure 4A and B, and in Tables 1A and 1B, respectively. Clusters shown on the figures are represented on the tables as MNI coordinates, including t values and levels of significance (p) for each cluster, identification of anatomical regions, Brodmann’s Areas, probability of inclusion, and number of voxels in the cluster indicating the relative size of the active region. The [Real Eye > Video Eye] contrast for TD includes dorsal somatosensory cortex (SSC); dorsal and dorsolateral supramarginal gyrus (SMG); posterior superior temporal gyrus (pSTG); posterior middle temporal gyrus (pMTG); dorsolateral prefrontal cortex (DLPFC); and pre- and supplementary motor cortex (MC), (Figure 4A and Table 1A). These observations are consistent with the main findings of prior studies performed to evaluate effects of face viewing (Noah et al., 2020; Kelley et al., 2021). In the case of the same contrast (Real Eye > Video Eye) for ASD, the neural effects were restricted to the ventral middle and superior temporal gyri as well as the auditory cortex (Figure 4B, Table 1B). These findings suggest that the more dorsal right temporal parietal processes engaged during interactive face processing in TD (Noah et al., 2020) were relatively silent for the same conditions in ASD.

A. Typically-developed (TD) participants. Activity is observed in the right hemisphere: supramarginal gyrus (SMG); posterior superior temporal gyrus (pSTG); posterior middle temporal gyrus (pMTG); somatosensory cortex (SSC); dorsolateral prefrontal cortex (DLPFC); and pre- and supplementary motor cortex (MC). See Table 1A. Findings are consistent with results reported in Noah et al., 2020. Yellow indicates responses corrected for multiple comparisons using FDR at p≤0.05. B. Autism Spectrum Disorder (ASD) participants. Activity observed in the right hemisphere includes MTG, STG, and auditory cortex (AC). See Table 1B. GLM analyses are based on the combined OxyHb and deOxyHb signals.
Modulation of Neural Circuitry by Frequency of Eye-Contact Events
Neural responses to real interactive eyes were modulated by the eye-contact events within each 3 s eye viewing period for both TD and ASD groups. The covariance variable used in the second level (group) analysis was constructed by assigning each subject with the median eye contact time for the 3 s periods where the eye of the partner was viewed. In the case of TD participants, clusters were observed in right dorsal supramarginal gyrus (SMG), somatosensory association cortex (SSAC), and dorsolateral prefrontal cortex (DLPFC); frontal eye fields (FEF); and pre- and supplementary motor cortex (MC), Figure 5A and Table 2A. In sharp contrast to these TD observations, ASD neural responses to eye-to-eye signals modulated by the same measures of eye-contact events were observed in the ventral right supramarginal gyrus (SMG); angular gyrus (AG); extrastriate visual (V3) and visual association cortices (V2); as well as the dorsolateral prefrontal cortex (DLPFC). Neural patterns in TD and ASD participants both demonstrated activity in the DLPFC whereas group response patterns were clearly differentiated in the posterior regions of brain. In the case of TD participants, dorsal parietal regions were responsive to eye-to-eye contact, while in the ASD participants ventral occipital and temporal regions were responsive to eye-to-eye contact.

A. Typically-developed (TD) participants. Activity observed in the right hemisphere: supramarginal gyrus (SMG); somatosensory association cortex (SSAC); dorsolateral prefrontal cortex (DLPFC); frontal eye fields (FEF); and pre- and supplementary motor cortex (MC). See Table 2A. Note: n = 15 rather than 19 (see Table S2) because eye-tracking data could not be acquired on four participants. B. Autism Spectrum Disorder (ASD) participants. Activity observed in the right hemisphere include SMG; angular gyrus (AG); extrastriate visual cortex (V3); visual association cortex (V2); and DLPFC. See Table 2B. Note: n = 12 rather than 17 (see Table S1) because eye-tracking data could not be acquired on five participants. Yellow indicates signals corrected for multiple comparisons at p≤0.05 using FDR. GLM analyses are based on the combined OxyHb and deOxyHb signals.
Discussion
An Integrated Multimodal Approach: Live Face Viewing and Eye Tracking
The coding of information from live faces during natural interactions is presumed to involve highly distributed processes that span early and late, richly integrated social, cognitive, and perceptual systems. Although deficits over a wide range of these processing levels have been proposed in ASD for static and/or simulated faces, the underlying neural mechanisms that code neural responses during live face processing in natural conditions in ASD are rarely addressed. Thus, a mismatch exists between the clinical observation of reduced eye-contacts in natural conditions and the static behaviors that are conventionally investigated. Here, the investigation of brain activity during real eye-to-eye interactions coupled with measures of eye-tracking offer a closer proxy to the behaviors of interest, and thereby advance a broader understanding of the variations in face and eye processing in ASD.
Live Two-Person Interactions in ASD
Neuroimaging based on functional near-infrared spectroscopy (fNIRS) enables simultaneous acquisition of hemodynamic brain signals from two individuals (hyperscanning) dynamically engaged in natural interactions. Eye-tracking, also acquired simultaneously on both participants during face-to-race engagement, enables identification of eye-contact events that occur between the partners. The aim to understand the neural mechanisms that underlie two-person eye-to-eye interactions in TD and ASD people has motivated this multi-modal application of fNIRS and eye-tracking. Prior comparisons of live eye-to-eye conditions relative to dynamic eye-video gaze have revealed neural systems associated with live interaction consistent with the Interactive Brain Hypothesis. These findings highlight right temporal parietal junction (rTPJ (Noah et al., 2020), a region known for processing social context (Carter and Huettel, 2013)). This result was replicated for the TD group in this study but not for the ASD group. The rTPJ, a social nexus region, was not more active in the real eye condition than in the video eye condition for the ASD group. Although consistent with findings of atypical face and eye processing in conventional experimental contexts, these findings suggest that atypical response patterns extend to naturalistic two-person interaction. For example, rather than a cluster of rTPJ activity associated with real live interactive viewing, a small cluster in right superior and middle temporal gyri was observed in ASD, suggestive of an alternative information processing pathway for eye-to-eye contact.
The increased positional variation in ASD eye movements leads to the speculation that information characterizing an interactive face may not have been sufficiently acquired for ASD participants. In ASD, the regions with activity regressed by eye-to-eye contact did not include the dorsal parietal regions (somatosensory association cortex and supramarginal gyrus), as was the case in the TD group. Instead, the ASD group included ventral and lateral occipital and temporal regions, which are more consistent with non-interactive face functions than with interactive functions. In summary, relative to TD participants, neural findings for those with ASD during eye-to-eye contact included reduced activity of right dorsal parietal systems and hyperactivity of ventral visual association cortices and temporal gyri. These results, coupled with the eye-tracking findings, advance a framework for understanding the neural underpinnings of interactive eye-to-eye processing in ASD.
Advantages of a Two-Person Approach
In spite of the biological significance of live interpersonal interactions for survival and social well-being, the underlying neural processes of interactive behaviors are relatively novel targets of investigation. Increasing awareness of this knowledge gap has resulted in frequent calls for studies of two-person interactions (Johnson et al., 2005; Schilbach et al., 2013; Hasson and Frith, 2016; Redcay and Schilbach, 2019). In response, foundational models of dynamic and reciprocal behaviors have emerged for multiple sensory and communication systems, clinical applications, and social behaviors (Hasson et al., 2012; Schilbach et al., 2013; Scholkmann et al., 2013; Babiloni and Astolfi, 2014; Bilek et al., 2015; Hasson and Frith, 2016; Redcay and Schilbach, 2019; Wheatley et al., 2019; Kingsbury and Hong, 2020).
This long-standing experimental paucity of two-person interactive experimental paradigms in social neuroscience, in part, reflects the historical limitations of conventional neuroimaging methods. For example, in functional magnetic resonance imaging (fMRI) solitary confinement in the bore of a scanner with minimal tolerance of head movements constrains/contraindicates investigations of natural, two-person interactions. Fortunately, however, these particular limitations are substantially resolved by recent developments of optical neuroimaging, functional near-infrared spectroscopy (fNIRS), a non-invasive spectral absorbance technique that detects changes in blood oxygen levels in both oxyhemoglobin and deoxyhemoglobin using surface-mounted optical sensors (Jöbsis, 1977; Villringer and Chance, 1997; Strangman et al., 2002; Huppert et al., 2006). Functional NIRS enables simultaneous acquisitions of hemodynamic signals (assumed to be a proxy for neural activity as in fMRI) from naturally interacting dyads and provides simultaneous dyadic measures that contribute to understanding interactive behaviors as opposed to single-subject responses that focus primarily on perceptual and cognitive systems.
Current models of face and eye processing in TD and ASD are based primarily on non-interactive paradigms where data are acquired in single-subject situations rather than dyadic paradigms that include live social interactions. The importance of investigations that include natural and dynamic two-person interactions between individuals is highlighted by a general theoretical framework proposed by the Interactive Brain Hypothesis (Di Paolo and De Jaegher, 2012; De Jaegher et al., 2016), which suggests that live interactions between individuals engage neural functions not activated during similar tasks performed alone, i.e., without interaction. A rapidly emerging neuroimaging literature and theoretical framework of live and natural interactions compared to static single-subject interactions contributes an accumulating body of evidence in support of this hypothesis (Hasson et al., 2012; Redcay et al., 2012; Redcay and Saxe, 2013; Schilbach et al., 2013; Hasson and Frith, 2016; Bolis and Schilbach, 2018; Hirsch et al., 2018). Understanding neural activity during natural interactions is especially critical in ASD, as the defining social and communicative impairments of the condition are often attenuated or absent during explicit laboratory tasks (Rolison et al., 2015).
Unstable, “jittered” Visual Sensing in ASD
A natural in-person encounter typically involves active visual sensing of dynamic face landmarks (Zweifel and Hartmann, 2020). The cascade of synchronized oculomotor behaviors, for example, associated with mutual live eye-to-eye contacts does not occur during passive gaze at an inanimate representation of a real person because dynamic behaviors from both partners are required for a mutual eye contact event or a dynamic face-to-face interaction. Eye-to-eye contacts occur periodically during natural facial viewing interactions and may be orchestrated by shared cues that synchronize the saccadic and fixation events between partners. Guidance systems for visual saccades and fixations are thought to actively “seek” relevant visual information such as social cues that are conveyed in a hierarchical manner to higher levels of neural processing (Schroeder et al., 2010). Abnormalities in oculomotor functions have been previously reported in ASD (Simmons, et al., 2009; Goldberg et al., 2002).
Active sensing models of visual information include the attention-driven gathering of relevant dynamic facial cues by controlled patterns of eye-movement sampling routines including saccade frequency, duration, and target locations (Schroeder et al., 2008; Schroeder et al., 2010). Accordingly, it has been proposed that patterns of eye movements are integral to detection and acquisition processes that lead to subsequent visual coding of information including social cues (Rucci and Victor, 2015). This bottom-up stream of information from face stimuli conveys incoming information to high-level perceptual and social processing. These facial cues are thought to be the raw material for reciprocal social actions and reactions, such as the exchange of dynamic facial expressions (Miyata et al., 2021), joint attention behaviors (Lachat et al., 2012; Redcay et al., 2012; Redcay et al., 2013; Redcay and Saxe, 2013; Koike et al., 2016; Dravida et al., 2020), and regulation of speaker turn-taking (Schegloff et al., 1974; Wilson and Wilson, 2005; Stivers et al., 2009; Liu et al., 2017).
ASD Eye Contact and Emotional Experience
Although natural interpersonal eye-contact moments are typically effortless and emotionally informative, first-hand accounts of eye-to-eye experiences by individuals with ASD report a distinct subjective experience, including a prevalence of unpleasant emotional experiences, fear and anxiety, threat, personal violation, self-consciousness, and confusion (Trevisan et al., 2017). These perceptive experiences are consistent with the hallmark observation that direct gaze at eyes and faces tends to be reduced in those with ASD. Consistent with these reports, activity in the amygdala (emotion processing) and fusiform gyrus (face processing) of TD participants was found to be positively correlated with dwell-time of eye-gaze at pictures of faces during an emotion discrimination task, suggesting that gaze fixation may be associated with heightened emotional responses in ASD (Dalton et al., 2005). In an investigation of eye-tracking during naturalistic interaction, it was shown that TD participants focused on central facial features during natural interactions with the investigator where facial expressions were displayed and communicated suggesting a holistic manner of facial sensing originating from a central-face “landing position”. In contrast, participants with ASD avoided the central-face “landing position” suggestive of less systematic gaze behavior (Schaller et al., 2021).
A model of corrupted input, altered face-processing, and dorsal stream hypoactivity
Within this framework, our findings are consistent with the hypothesis that eye-movements during live eye contact and social processing are altered in ASD, and favor a bottom-up theory for deficits in live eye to eye interactions based on the distorted incoming information that impairs higher order processing associated with face and social interactions. These findings also add support for the “dorsal stream vulnerability” hypothesis in ASD suggesting that mechanisms supporting motion sensitivity such as live face interactions are compromised (Braddick et al.,2003).
Limitations
The advantages of fNIRS are balanced by technical limitations relative to fMRI. The spatial resolution of fNIRS (approximately 3 cm) does not allow for discrimination of small anatomical differences in functional activity between gyri, and the origin of acquired signals does not extend below the superficial grey matter of the cortex of about 1.5-2.0 cm. Thus, findings of this and other investigations based on fNIRS technology are restricted to superficial cortical networks.
Data Availability
The datasets analyzed for this study will be made available upon request at fmri.org/ ENDAR and the NIH Data Archive.
Author Information and Contributions
Full Name: Joy Hirsch, PhD
Postal Address: Yale School of Medicine, Department of Psychiatry, Brain Function Laboratory, 300 George St, Suite 902, New Haven, CT, 06511
Telephone Number: 917.494.7768
Email Address: joy.hirsch{at}yale.edu
Contribution(s): Research design and supervision; data analysis; wrote the paper
Full Name: James C. McPartland, PhD
Postal Address: Yale Child Study Center, Nieson Irving Harris Building, 230 South Frontage Road, Floor G, Suite 100A, New Haven, CT, 06519
Telephone Number: 203.785.7179
Email Address: james.mcpartland{at}yale.edu
Contribution(s): Research design and clinical supervision; edited the paper
Full Name: Xian Zhang, PhD
Postal Address: Yale School of Medicine, Department of Psychiatry, Brain Function Laboratory, 300 George St, Suite 902, New Haven, CT, 06511
Telephone Number: 917.494.7768
Email Address: xian.zhang{at}yale.edu
Contribution(s): Analysis of neuroimaging and eye-tracking data; edited the paper
Full Name: J. Adam Noah, PhD
Postal Address: Yale School of Medicine, Department of Psychiatry, Brain Function Laboratory, 300 George St, Suite 902, New Haven, CT, 06511
Telephone Number: 917.494.7768
Email Address: adam.noah{at}yale.edu
Contribution(s): Performed neuroimaging and eye-tracking research; analyzed neuroimaging data; maintenance of system calibrations and performance; edited the paper
Full Name: Swethasri Dravida, MD-PhD
Postal Address: Yale School of Medicine, Department of Psychiatry, Brain Function Laboratory, 300 George St, Suite 902, New Haven, CT, 06511
Telephone Number: 917.494.7768
Email Address: swethasri.dravida{at}yale.edu
Contribution(s): Performed neuroimaging and eye-tracking research; analyzed neuroimaging data
Full Name: Adam Naples, PhD
Postal Address: Yale Child Study Center, Nieson Irving Harris Building, 230 South Frontage Road, Floor G, Suite 100A, New Haven, CT, 06519
Telephone Number: 203.785.7179
Email Address: adam.naples{at}yale.edu
Contribution(s): Research design and clinical supervision
Full Name: Mark Tiede, PhD
Postal Address: Haskins Laboratories, 300 George St, 9th Floor, New Haven, CT, 06511
Telephone Number: 203.865.6163
Email Address: mark.tiede{at}yale.edu
Contribution(s): Analyzed eye-tracking data
Full Name: Julie M. Wolf, PhD
Postal Address: Yale Child Study Center, Nieson Irving Harris Building, 230 South Frontage Road, New Haven, CT, 06519
Telephone Number: 203.785.5337
Email Address: julie.wolf{at}yale.edu
Contribution(s): Acquired and analyzed clinical data
Funding and Acknowledgements
This research was partially supported by the National Institute of Mental Health of the National Institutes of Health under award numbers 1R01MH111629 (PIs JH and JCM); R01MH107513 (PI JH); 1R01MH119430 (PI JH); U19MH108206 (PI JCM); R01 MH107426 (PI JCM); R01 MH100173 (PI JCM); NIH Medical Scientist Training Program Training Grant T32GM007205 (SD); NRSA 1F30MH116626 (PI SD). The content is solely the responsibility of the authors and does not necessarily represent the official views of the National Institutes of Health. All data reported in this paper are available upon request from the corresponding and first author. The authors are grateful to the participants for their essential efforts to advance understanding of ASD; to our two confederates, CD and IS, for consistent partnership with our participants and the investigators; and to Jen Cuzzocreo for data-base management and graphical representations of the data.
Disclosure of Biomedical Financial Interests and Potential Conflicts of Interest
The authors declare that this research was conducted in the absence of any commercial or financial relationships that could be construed as a potential conflict of interest.
Data Availability Statement
The datasets analyzed for this study will be made available upon request at fmri.org/ENDAR and the NIH Data Archive.
Supplementary Material

Channel layout. Right and left hemispheres of a single rendered brain illustrate median locations (blue dots) for 58 channels per participant. Montreal Neurological Institute (MNI) coordinates were determined for each channel by digitizing emitter and detector locations in relation to anterior, posterior, dorsal, and lateral fiduciary markers based on the standard 10-20 system.

Colors indicate the percentage of time eye gaze is within the eye-region of the partner (dark blue = 0% and bright yellow = 100%) during each epoch of the time-series (x-axis). The vertical axis includes all ASD participants for whom eye-tracking

Colors indicate the percentage of time eye gaze is within the eye-region of the partner (dark blue = 0% and bright yellow = 100%) during each epoch of the time-series (x-axis). The vertical axis includes all TD participants for whom eye-tracking data were acquired.
Demographic information for Autism Spectrum Disorder (ASD) participants. Assessment measures include the Autism-Spectrum Quotient test (AQ, total scores); Broad Autism Phenotype Questionnaire (BAPQ, total scores); Social Responsiveness Scale, Second Edition (SRS-2, raw scores); Beck Anxiety Inventory (BAI, total scores); State-Trait Anxiety Inventory (STAI; total state anxiety scores); Liebowitz Social Anxiety Scale (LSAS, total scores); and the Autism Diagnostic Observation Schedule (ADOS-2, total scores). The Wechsler Abbreviated Scale of Intelligence, 2nd Edition (WASI-II) was administered to estimate full-scale intelligence quotient scores based on four subtests (FSIQ-4). *Indicates data are unavailable.
Demographic information for Typically-Developed (TD) participants. Assessment measures include the Autism-Spectrum Quotient test (AQ, total scores); Broad Autism Phenotype Questionnaire (BAPQ, total scores); Social Responsiveness Scale, Second Edition (SRS-2, raw scores); Beck Anxiety Inventory (BAI, total scores); State-Trait Anxiety Inventory (STAI; total state anxiety scores); and the Liebowitz Social Anxiety Scale (LSAS, total scores). The Wechsler Abbreviated Scale of Intelligence, 2nd Edition (WASI-II) was administered to estimate full-scale intelligence quotient scores based on four subtests (FSIQ-4). *Indicates data are unavailable.
Comparison of Autism Spectrum Disorder (ASD) and Typically-Developed (TD) participant groups by gender, handedness, and age. Groups were similar in terms of age and handedness; however, the ratio of male to female participants was higher in the ASD group than in the TD group. The gender composition of the ASD group is consistent with the estimated 4:1 male:female ratio of ASD diagnosis. This ratio increases to 6 males diagnosed with ASD for every 1 female in people whose cognitive functioning is within or above normal limits, such as those in our sample (Kirkovski, M., Enticott, P. G., & Fitzgerald, P. B. (2013). A review of the role of female gender in autism spectrum disorders. Journal of Autism and Developmental Disorders, 43(11), 2584-2603).
Statistical comparisons (independent t-tests, two-tailed assuming unequal variances) of scores between Typically-Developed (TD) and Autism Spectrum Disorder (ASD) groups are consistent with differences for the Autism-Spectrum Quotient test; Broad Autism Phenotype Questionnaire; Social Responsiveness Scale, 2nd Edition; and the Beck Anxiety Inventory. No evidence was found for differences between the groups for FSIQ-4 (estimated by the Wechsler Abbreviated Scale of Intelligence); State-Trait Anxiety Inventory (state anxiety items only); or the Liebowitz Social Anxiety Scale, and is taken as evidence in favor of matched groups with respect to these metrics.
Group averages and individual median percentages of eye-gaze time within the eye box of partners for Typically-developed (TD) participants (left column) and Autism Spectrum Disorder (ASD) participants (right column) during the Eye-to-Eye Condition. A t-test of these median percentages shows t(25) = 0.28 n.s. See Figures S2 and S3 for a graphical run-by-run representation of eye-tracking performance.
Footnotes
Extended information about authors and contributions are included after main text
References


