
Abstract
Wastewater-based epidemiology (WBE) has been extensively used during the COVID-19 pandemic to detect and monitor the spread of the SARS-CoV-2 virus and its variants. It has also proven to be an excellent tool to complement and support insights gained from reported clinical data. Globally, many groups have developed bioinformatics pipelines to analyse sequencing data from wastewater. Accurate calling of mutations from RNA extracted from wastewater samples is key in supporting clinical data to make informed decisions on the prevalence of variants, as well as in the use of WBE as a molecular surveillance tool. However, wastewater samples can be challenging to extract and sequence, and performance of variant-calling algorithms in this context has, so far, not been investigated. Analysis of the data and assignment of circulating variants depends heavily on the accuracy of the variant caller, particularly given the degraded nature of the viral RNA and the heterogeneous nature of metagenomic samples. To address this, we compared the performance of six variant callers (VarScan, iVAR, GATK, FreeBayes, LoFreq and BCFtools), used widely in bioinformatics pipelines, on 19 synthetic samples with a known mix of three different SARS-CoV-2 variant genomes (Alpha, Beta and Delta), as well as 13 wastewater samples collected in London between the 15th and 18th December 2021. Using the Quasimodo benchmarking tool to compare the six variant callers, we assessed the fundamental parameters of recall (sensitivity) and precision (specificity) in confirming the presence of a variant within the population.
Our results show that BCFtools, FreeBayes and VarScan called the expected mutations with higher precision and recall than iVAR or GATK, although the latter identified more expected defining mutations. LoFreq gave the least reliable results due to the high number of false positive mutations detected, resulting in lower precision. Similar results were obtained for both the synthetic and wastewater samples.
Introduction
On March 11th 2020, the World Health Organisation (WHO) declared a global pandemic following the rapid spread of a novel coronavirus, severe acute respiratory syndrome coronavirus 2 (SARS-Cov-2) [1] which causes coronavirus disease 19 (COVID-19). Since then, wastewater-based epidemiology (WBE) has been shown to be a promising tool to monitor and detect SARS-Cov-2 in wastewater as a proxy for infections within certain regions/communities, and to obtain an early-warning of disease outbreaks [2]. It has been widely used in many countries as a complement to conventional clinical surveillance, which is limited in population coverage, capacity or engagement (e.g., self-testing/reporting) [3]. In this regard, it is evident that WBE can be used to monitor disease prevalence in a community, allowing targeted public health measures to be implemented at relative pace and geographical specificity, in combination with other data. Moreover, WBE is non-invasive and less biased than clinical data, which makes it a valuable molecular surveillance tool [4, 5].
Since the initial outbreak of the pandemic in March 2020, several variants of concern (VOCs), variants under investigation or monitoring (VUIs/VUMs) and variants of interest (VOIs), have circulated globally. According to the World Health Organisation (WHO), there have been five VOCs (Alpha, Beta, Gamma, Delta and Omicron), eight VOIs (Epsilon, Zeta, Eta, Theta, Iota, Kappa, Lambda, Mu) and two VUIs (B.1.640 and XD), as of May 2022 [6]. While the VOCs have transmitted worldwide, VUIs are country-specific, with over 200 that have been reported by individual countries as sub-lineages of the main circulating variants [7].
In England, the Horizon Scanning Programme team [8, 9], part of the UK Health Security Agency (UKHSA), has been monitoring circulating variants which were found by deep sequencing of a large cohort of Covid-19 positive patients by COG-UK (Covid-19 Genomics UK). This accounted for over 2 million patients in the UK alone since the declaration of the pandemic in March 2020 [10]. However, the sequencing datasets generated lacked data from asymptomatic individuals and from individuals that were not sequenced as part of the Programme. The Environmental Monitoring for Health Protection programme, part of the UKHSA, has used reports by Horizon Scanning to monitor the same variants in wastewater. Analysis of SARS-CoV-2 sequences from wastewater samples is more complicated than from clinical samples obtained using nasopharyngeal swabs. Discrepancies between clinical and wastewater samples have been observed, above all the mixed strain nature of wastewater and the more degraded viral genome; these differences are accounted for by the nature of the samples (wastewater vs clinical) and characteristics impacting the ability to extract and analyse the samples, such as virus titre, which is considerably lower in wastewater samples that, in turn, may affect variant calling such as sample preparation, with additional steps such as centrifugation and filtration methods required to purify the samples from chemicals and other sources of contamination and platform dependent sequencing errors [11].
Several bioinformatics pipelines have been developed that can be used to analyse SARS-CoV-2 in wastewater samples, including nfcore/viralrecon [12] and V-PIPE SARS-CoV-2 [13]. Bioinformatics pipelines used during wastewater monitoring of SARS-CoV-2 in England have relied heavily on adaptation of the ARTIC pipeline, which was initially designed to analyse clinical cases. Common sequencing pipelines, including ARTIC, involve the removal of low-quality sequencing reads, followed by read mapping and variant calling to define mutations found in the sample (Single Nucleotide Polymorphisms – SNPs – and INsertions/DELetions) [14]. The same overall approach is used for wastewater samples, except for some deliberate adjustments to reflect the different composition of the samples and to compensate for the effects of degradation by components in the raw sample. The detection of SNPs and Indels allows the assignment of VOC, VUI, VUM and VOI. This is performed by highly specialised tools known as variant callers. The ARTIC pipeline for sequence analysis of clinical samples utilises iVAR, which relies on the samtools mpileup command as its variant calling function [14]. While this has been well documented for clinical studies, very little is known about its utility for wastewater samples. To address this knowledge gap, the EMHP programme in England has adapted this protocol, using VarScan as an alternative, delivering significantly improved results when applied to the wastewater samples [15, 16]. Before screening for sequence changes, VarScan uses the BAM alignment file as the input to score and so each of the reads produced during sequencing. If reads are found to align to multiple locations and/or are of low quality, these are automatically discarded. For the remaining reads, SNPs and Indels are compiled for each of the locations across the viral genome and validated depending on factors such as the overall coverage, number of reads across the site of the mutation and base quality, among others.
Several genomic studies have been published where variant callers were compared showing the impact that caller choice has on the analysis pipeline, including iVAR [14], GATK [17], LoFreq [18] FreeBayes [19] and BCFtools [20]. FreeBayes is a haplotype-based variant caller where variants are called based on the sequences of reads aligned to a particular target, rather than the specific alignment. One of the main advantages of this method is that it bypasses the problem of identical sequences that might align to multiple locations. On the other hand, GATK uses HaplotypeCaller as a tool to call germline SNPs and Indels via local re-assembly of haplotypes [19]. More specifically, it assembles and realigns reads to their most likely haplotypes. Comparison with the reference of choice is used to calculate the likelihoods of each possible genotype and call possible variants. LoFreq is a high-quality and highly sensitive tool to detect variants in heterogeneous samples, such as tumour samples [18]. It was developed under the assumption that it is hard to distinguish true variants from sequencing errors. In this regard, LoFreq is a very robust and sensitive variant caller that uses base-called quality values to accurately call variants. It differs from other callers as it can find SNPs and Indels at a frequency below the average sequencing error. As such, it is not ideal for low-coverage genomes. BCFtools is a collection of several commands, among which call is used for SNP/indel calling [20]. It generates first the mpileup from the BAM alignment reads and then computes the variant calling. This step is the same as VarScan, which generates mpileup using SAMtools. iVar uses the output of the SAMtools mpileup command to call variants same as VarScan and BCFtools, however it is not adapted for use in mixed strain samples, such as those derived from wastewater where mixed populations are found in the same sample [14]. Tools such as InStrain and metaSNV were developed specifically for this, especially samples that contain multiple species in each mixed sample. However, they do rely on the availability of a fully covered genome, which is rarely the case in wastewater samples [21, 22].
The ability of variant callers to identify SNPs and Indels is quantified by the number of true positives (TP), true negatives (TN), false positives (FP), and false negatives per sample (FN). Given a sample being tested for the presence of mutations and a reference with known number of mutations, a true positive is defined as one that was found by the variant caller being tested in both the sample and the reference. A true negative is a lack of a mutation detected by the variant caller that is present in the reference (it is therefore unchanged from the wild-type nucleotide). A false positive is a mutation reported by the variant caller but not present in the original reference, while a false negative is a mutation not detected by the variant caller, but that is found in the reference [23-26]. In this manuscript, we evaluated the performance of six different variant callers and their ability to detect SNPs and indels in samples containing a mixture of synthetic SARS-CoV-2 control variants, as well as wastewater samples collected across Greater London during the pandemic.
Methods
Sample library preparation and sequencing
The synthetic SARS-CoV-2 control variant dataset contained samples that consisted of a mix of three variant genomes: Alpha (Control 15), Beta (Control 16) and Delta (Control 23) synthesised by TWIST Biosciences, USA (Table 1). For each sample in the synthetic dataset, three of these genomes were mixed in different ratios up to a total concentration of 200 genome copies per μL, ranging from 0 to 100% of each synthetic genome, in quadruplicates. The mutation profile of each of the synthetic genomes is provided in Supplementary Table 1. Wastewater samples were collected between the 15–18th December 2021 in eight locations across the city of London, UK. Most of these samples were found to be positive for both the Delta and Omicron variants using the bioinformatics pipeline developed by EMHP (data not shown). Wastewater samples were clarified, concentrated and RNA extracted according to the Quantification of SARS-CoV-2 in Wastewater General Protocol V1.0 (https://www.cefas.co.uk/media/offhscr0/generic-protocol-v1.pdf). Sequencing libraries (tiled amplicons) were generated using the EasySeq™ SARS-CoV-2 WGS Library Prep Kit (Nimagen, The Netherlands) and the Nimagen V3 (wastewater samples) and V4 (synthetic samples) primer schemes, following the Wastewater Sequencing using the EasySeq™ RC-PCR SARS-CoV-2 (Nimagen) V2.0 protocol [31]. The libraries were sequenced on an Illumina NovaSeq 6000 (2x 150 bp) at the University of Liverpool sequencing centre (synthetic samples) or an Illumina NextSeq 500 (2x 150 bp) at the University of Nottingham sequencing centre (wastewater samples).
List of synthetic genomes by Twist Biosciences used for the comparison test. Defining mutation patterns were taken from ref [8]
Read pre-processing, mapping, primer trimming and variant calling
The ARTIC pipeline (ncov2019-artic-nf; Illumina workflow) [32] was used to process the raw Illumina reads. Briefly, amplicon reads were pre-processed using Trim Galore v0.6.5 [33], mapped to the reference SARS-CoV-2 genome (NCBI Genbank Accession MN908947.3) using BWA v0.7.17 [27], followed by primer trimming using iVar v1.3 and bed files containing the genome positions of the primers used to generate the amplicons (Nimagen V3 and V4 primer schemes for wastewater and synthetic samples, respectively). The resulting BAM files were sorted and subsequently indexed using SAMtools v1.13 [20] before analysis with six different variant callers; iVar v1.3.1, LoFreq v2.1.3.1, BCFtools v1.13, GATK Haplotypecaller v3.8, VarScan v2.4.4 and FreeBayes v0.9.21. The ARTIC pipeline outputs a list of mutations (SNPs and indels) detected for each variant using iVar, but this was re-run separately after matching the parameters across the various callers being investigated. All parameters are described in Supplementary file 1. To compare the sensitivity (recall) and specificity (precision) of the different tools, variant calling parameters were adjusted to mirror the parameters used by VarScan, as utilised by the EMHP bioinformatics pipeline. The sorted, indexed and primer-trimmed BAM files were used directly to run variant calling with FreeBayes, iVar, BCFtools and VarScan, while LoFreq and GATK Haplotypecaller required first pre-processing of these BAM files. Since LoFreq required indel quality information in the BAM file to process indel calls, we used the LoFreq command indelqual to insert quality score for each indel, based on the dindel algorithm (Albers et al., 2010). GATK Haplotypecaller, requires reads to be grouped (using AddOrReplaceReadGroups from Picard) and duplicates (MarkDuplicatesSpark from GATK) were marked before variant calling. All the variant callers generated outputs in the variant call format (vcf) files except iVar, which reported outputs as tsv (tab-separated values) files. A python script (ivar_variants_to_vcf.py) provided as part of the nf-core/viralrecon pipeline [12] was used to convert the tsv file to vcf format.
VCF file processing and analysis
QuasiModo is a tool designed to identify variants in mixed strain samples [28]. It does this by taking vcf files generated from the different variant callers and two genomic reference files, the first being the reference against which samples were mapped in the BAM file-generating process, and the second reference being a ground-truth genome known to be found in the mixed strain samples. QuasiModo [23] was used to evaluate the performance of the different variant callers by comparing lists of mutations identified by each of the variant callers to a second reference genome (for ground truthing). The reference SARS-CoV-2 genome sequence was downloaded from NCBI Genbank (Accession No. MN908947.3) and the SARS-CoV-2 variant genomes were obtained from GISAID: Alpha (EPI_ISL_601443), Beta (EPI_ISL_678597), Delta (EPI_ISL_1544014), Omicron (EPI_ISL_6841980) and Gamma (EPI_ISL_792683). Briefly, sequences from each sample were aligned to the reference genomes using MUMmer4 [28] to identify SNPs and indels that are present in the ground-truth genome and each variant call event was categorised as either TP, FP, or FN. These values are used to calculate the recall and precision, also known as sensitivity and specificity respectively:

In addition, once recall and precision are calculated, a ratio of the two can be derived, known as the F1 score [23]:

For the synthetic control samples, 455 vcf files (generated for 19 synthetic samples (quadruplicates) from six variant callers, with one failed replicate for GATK) were analysed using the MN908947.3 reference file as the mapping genome and each of the SARS-CoV-2 variant reference genomes (Alpha, Beta, Delta, and Gamma) to evaluate the presence of the variant genome being tested. Similarly, for wastewater samples, QuasiModo was run with 77 vcf files (generated for 13 unique samples from six variant callers, with one failed sample for GATK), using the MN908947.3 reference and each of the SARS-CoV-2 variant genomes (Alpha, Beta and Delta, Omicron (Hong Kong), Omicron (Australia) and Omicron (England) and Gamma; Table 1). The Gamma (P1) variant reference file (Table 1) served as a negative control in our bioinformatics analysis, as it was not included in the synthetic mixtures nor found in the wastewater samples. QuasiModo generated a benchmark table with calculated values for each of the vcf files, from which recall and precision were plotted as a point plot/graph using RStudio, ggplot2 package [29]. Output from all the vcf files was used by vcfstats from the vcflib package to generate variant statistics for each of the vcf files. vcfstats generates a two-column output for each vcf file, with counts for SNPs, MNPs (multiple nucleotide polymorphisms), Indels and various other parameters. The number of SNPs, Indels and MNPs for each vcf file were plotted using RStudio, ggplot2 package [30].
Results
Performance of six variant callers across mixed synthetic genome samples
We ran VarScan, GATK, iVar, FreeBayes, LoFreq and BCFtools across 19 mixed ratio synthetic samples, in quadruplicates. Basic sequencing statistics for all the samples are summarised in Supplementary file 3. For each of the samples, QuasiModo was used to assess the presence of the variant being investigated and to calculate recall and precision. Figure 1A-C shows the performance of each caller by plotting recall versus precision for each of the variants in the mix, for all the synthetic samples. The results show that there are differences between the callers, with LoFreq resulting in much lower precision compared to the other five callers. This was observed for all three variants under investigation, Alpha (1A), Beta (1B) and Delta (1C), respectively. Specifically, we observed that mixed ratio samples close to zero, thus with low concentration of a variant, tended to cluster together with low recall and low precision, as expected. Those with higher ratio, and therefore with more mutations to be detected across several variants, are distributed across the plot to reflect the increased recall, and for some callers, higher precision. As expected, the Gamma variant used as a negative control did not yield meaningful results. Based on this initial observation, GATK, VarScan and Freebayes had the highest precision, while iVAR had the highest recall.

A-D Point plots of precision vs recall for synthetic samples, grouped and colored by variant caller and a linear regression for each. A, Alpha variant reference, B. Beta variant reference, C. Delta variant reference and D. Gamma variant reference. The figure shows the low precision recorded by LoFreq compared to the rest of the variant callers while is higher for VarScan, FreeBayes, BCFtools and GATK. Interestingly, trend lines overlap for Freebayes and BCFtools.
Variant callers correctly identify the proportion of a specific lineage in the mix
We calculated recall and precision for each of the samples to investigate whether the ratio was correctly identified in the mix. For this, we plotted each variant separately for each variant caller. In Figure 2A-D we show in more detail how each variant caller identifies the mixed content of each variant from 0% to 100%, as described in Table 2. Results show that all the variant callers correctly call each of the lineages in the mix. Because it is complicated to compute this simultaneously for the four variants in each sample, we only investigated the correct identification of the percentage by analysing the variants separately. In general, greater the concentration of a variant (close to 100%), the greater the chances these will be called correctly. Indeed, in Figure 2A-C, VarScan and GATK are those that correctly called the increased ratio of Alpha compared to the remaining variants in the mix. A similar trend was observed for BCFtools and FreeBayes, where towards higher concentrations we observe a plateau, while iVar and LoFreq had a trend line where the increased concentration of the variants could not be observed as clearly as in the other callers, showing instead a lower precision. As expected, our negative control P1 (Figure 2D) did not yield any significant results, with all samples having a very low precision and recall for every caller assessed.

A-D Point plots of precision vs recall for synthetic samples, grouped and faceted by variant caller, colored by percentage present in the mix (dark blue, 0%, bright red, 100%). A linear regression for each plot is also present. A. is comparing the synthetic samples to the alpha variant reference, B. Beta variant reference, C. for Delta variant reference and D. for Gamma variant reference. As there was no mixed ratio for the Gamma variant, no gradient was applied. Except for LoFreq and iVAR, all the callers show a high precision and recall.
Mixed synthetic samples used to compare the 6 variant callers. The samples with * were also used for comparison of technical replication
These trends can be observed in more detail in Supplementary Figure 1A-D, where we plotted each sample from Table 2 and highlighted the variant caller. For each variant, we can observe that the lower the concentration, the lower the precision/recall ratio. As the concentration of a sample rises in the mix, we observe more noticeably the difference between the six variant callers, with each sample differently distributed across the plot, to highlight the different calling capabilities. This was observed for all four variants analysed.
Replicate synthetic samples show consistent results among the callers
All synthetic samples were prepared in quadruplicates. While we used the median of these to generate plots in Figures 1-3, here we also assessed if the technical replicates were called consistently among the variant callers. Figure 3A-F shows the distribution of three samples, which only contained only 100% of one specific variant in the mix, namely Alpha, Beta or Delta, as shown in Table 2 marked by *. The figure plots each of the callers either against recall or precision, shown as the F1 score. It shows that all the four replicates yielded similar results for each of the samples, validating the technical replicates. When comparing the six variant callers, each of these called the replicates consistently, with very minor differences across the samples, and, in some cases, with replicates yielding the same precision and recall. In Figure 3 we show that each of the expected variants found at 100% (only one variant in the mix) was correctly identified in the mix with a higher precision and recall (red) compared to the other genomes (0%, blue). In addition, as shown in Figures 1-2, we found consistently that LoFreq showed the lowest F1 score for all three variants tested, followed by iVAR.

Plot of F1 score vs callers for three synthetic samples (1) 100% alpha (2) 100% Beta and (3) 100% Delta as listed in Table 2 (samples with *). Each plot represents caller in relation to either the precision or the recall, expressed as the F1 score. The figure shows that all the replicates (filled circle) have similar recall and precision, suggesting that no major differences are observed. As shown in Figure 1 and 2, LoFreq shows the lowest F1 score compared to the rest of the callers, followed by iVAR. FreeBayes and VarScan, showed similar results, while GATK had the highest F1 score, followed by BCFtools.
Wastewater sample analysis from London
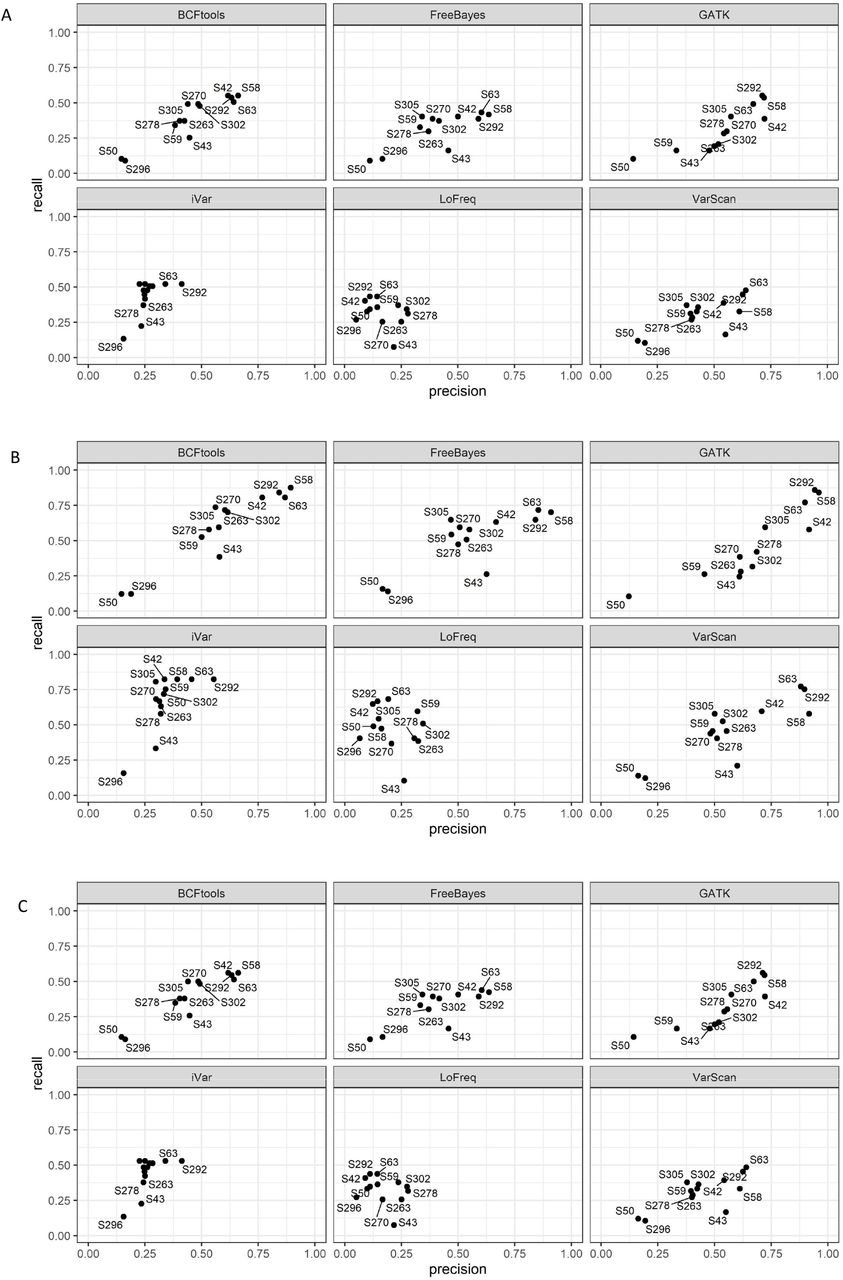
We used wastewater samples collected between the 15–18th December 2021 from Greater London to assess whether the variant callers could identify the mutations with the same precision and recall as observed with the synthetic samples. Table 3 shows the list of the samples, dates and predicted variants known to be found in those samples. Samples were known to contain a mix of both the Omicron and Delta variants, as they were collected during the period in which the UK observed a decline in the Delta variant and a rise in the new Omicron variant (data not shown). Figure 4A-B-D shows that none of the variant callers recognised mutations that could be identified as Alpha, Beta or Gamma variants, as expected, since these were not expected to be found in the samples. When testing if the Delta variant could be found as shown in Figure 4C, we noticed a slight increase in the precision, as well as the total number of mutations called, which suggests that those samples did contain SNPs and/or Indels that could be identified as being part of the Delta variant in some of the samples analysed. However, we also observed that for the same variant callers, some samples had different values for recall and precision. This was also observed in some of the samples in which Delta was known to be present (Figure 5A-B). To assess which samples were called correctly based on the presence or absence of the Delta variant, we plotted these by variant caller. Figure 5A-B shows in more detail how samples are called by each of the variant callers when tested against a Delta reference. Consistent with the data in Table 3, some of the samples were found to not contain a Delta variant (sample S43 for example), while other samples with a low recall and precision did contain a mix of both Omicron and Delta (samples S58, S292, S63), which as expected will direct the calling towards either of the two variants. As shown for the synthetic samples, LoFreq was the only variant caller that calls with the lowest precision, followed by iVar. GATK. BCFtools, VarScan and FreeBayes yield similar recall and precision trends in this analysis.
List of wastewater samples collected across London between the 15th and 18th December 2021. Samples in bold were also used to generate upset plots in Figure 9A-F

A-D Point plots of precision vs recall for wastewater samples, colored by variant caller. A, Alpha variant reference, B. Beta variant reference, C. Delta variant reference and D. Gamma variant reference. The figure shows that variants not found in the mix such as Alpha, Beta and Gamma have low precision and recall. Some of the samples are known to be positive for the Delta variant therefore the latter will have a higher precision and/or recall.

A-B Point plots of precision vs recall for wastewater samples for the Delta variant, faceted by variant caller. A. Comparison of real wastewater samples to the Delta variant reference and B. with labelled samples to better identify which samples had low recall and low precisions (thus, not containing any Delta variant). As shown in Figure 4C, some samples such as S296 and S50 are those containing a Delta variant in the mix, compared to S43 seen to be negative for all the variant callers. As shown previously for the synthetic data, LoFreq has the lowest recall and precision
Similarly, we tested the wastewater samples for the presence of the Omicron variant. We used three different references representative of this variant, namely, England, Hong Kong, and Australia. As shown in Figure 6A-C, all three variants under analysis were found in our wastewater samples and at a higher level than that at which the Delta variant was detected (Figure 5A-B). The degree to which each variant caller recognises the mutations varied, with LoFreq again returning the lowest recall and precision values compared to the other callers. This was consistent with the results obtained with the synthetic data. We plotted these samples across the variant callers to confirm whether the Omicron variant was indeed correctly identified (Figure 7A-C). This showed that samples did tend to vary in terms of precision and recall. We labelled these to better understand if there was a trend across the samples and identified that samples S50 and S296 were consistently yielding low recall and precision with the three Omicron reference sequences. Based on the detection indicated in Table 3, these samples were identified to have a Delta variant (S296) and a mix of Delta and Omicron (S50), respectively. Compared to the other variant callers, we also observed that LoFreq did have a different distribution of the samples and that GATK did not call S296.

A-C Point plots of precision vs recall for wastewater samples for the Omicron variant, grouped and colored by variant caller and a linear regression for each. A, Omicron England variant reference, B. Omicron Hong Kong variant reference, C. Omicron Australia variant reference. Since the wastewater samples are known to contain the Omicron variant, samples do show a higher precision and recall compared to the negative controls used to generate Figure 4 A-B-D.

A-C Point plots of precision vs recall for real wastewater samples for the three Omicron variants, faceted by variant caller. A. Omicron England variant reference ; B. Omicron Hong Kong variant reference; C. Omicron Australia variant reference. Since the wastewater samples are known to contain the Omicron variant, samples do show a higher precision and recall compared to the negative controls used to generate Figure 4 A-B-D. In particular, samples S63, S58, S42 and S292 had the highest precision and recall for BCFtools, Freebayes, GATK, iVar and VarScan, while LoFreq did not call with the same efficiency. S50 and S296 had the lowest precision and recall for all the callers. Notably, GATK did not call S296.
Known variant defining mutations found in synthetic and wastewater samples by the six callers
We calculated the total number of known SNPs, Indels and MNPs (multi nucleotide polymorphisms) as described by PHE for each variant and compared these with those found in our synthetic samples by each of the callers (Figure 8A-F, Supplementary Figure 2A-F and Supplementary file 2). Given the high number of samples analysed, we used UpSet plots to show TP for a subset of both synthetic and wastewater samples. For the synthetic samples we chose the three samples with 100% of a variant and one with a mix of the three (sample12 from Table 2). Among the wastewater samples, we chose six samples, representative of both Omicron and Delta variants. As shown in Figure 8A-F, and in concordance with the data presented above, LoFreq did call a much higher number of mutations compared to all the other variant callers in all the synthetic samples analysed. When looking in more detail at how many of those were the defining mutations for each of the reference genomes (Table 1), we found that all callers identified the majority of the expected mutations for the variants being investigated, except LoFreq which only found 11/28 mutations for Alpha, 14/25 for Beta, and 20/37 for Delta (Figure 8A-B-C, Supplementary file 2). In addition, a set of 3 mutations was not detected by any of the variant callers for Alpha and Beta variants and 4 mutations for the Delta variant. The detailed number of defining expected mutations for all the callers are described in Supplementary file 2.

A-C Upset plots showing the common set of mutation found in (A) Alpha reference genome and sample containing 100% alpha synthetic genome (B) Beta reference genome and sample containing 100% beta synthetic genome (C) Delta reference genome and sample containing 100% delta synthetic genome. (D-F) Upset plots showing common mutation between sample mix (50% Alpha, 25% Beta and 25% Delta synthetic genome) and (D) Alpha reference genome (E) Beta reference genome and (F) Delta reference genome for 6 different variant callers. A = ALPHA; B=BETA; C=DELTA; D= mixed sample 12 ALPHA; E= mixed sample 12 BETA; F= mixed sample 12 DELTA
For the synthetic mixed strain sample (Table 2, sample 12) we tested the presence of the defining mutations for Alpha, Beta and Delta (Figure 8D-E-F, respectively and Supplementary file 2) which were mixed in a 50:25:25 ratio, respectively. As summarised in Supplementary file 2, GATK called the lowest number of expected mutations for all the three variants, followed by LoFreq and VarScan. On the other hand, we found that GATK and iVAR were the callers with the highest number of expected mutations for the Delta variant. Five mutations for the Alpha variants, 3 for the Beta and 8 for the Delta variant were not found by any of the callers.
Similarly, we called variants for the wastewater samples (in bold Table 3) and observed the same pattern, although LoFreq called more than 200 mutations in just six out of 13 samples compared to the synthetic samples, where all the samples had a high number of mutations called (Supplementary Figure 2A-F). The majority of these were mutations that did not necessarily define the variant, as observed for the synthetic samples, and as shown in Figure 9A-F. More specifically, we investigated how many of the Delta, Omicron BA.1 and BA.2 defining mutations were detected by each of the variant callers. We found that, of all the mutations detected in the wastewater samples, 13/20 mutations for BA.2 were not detected by any of the variant callers ((Supplementary file 2), yielding to a very low number of defining mutations found by each caller (between 1 to 7 total mutations). For BA.1, all mutations were called across the callers, with different degrees. For example, LoFreq called the least number of expected mutations for sample S58 (7/17) and S263 (6/17). Sample S296 failed the analysis by GATK. All samples showed a degree of difference in calling the expected mutations, yet LoFreq proved to be the caller with the smallest number of expected mutations, and the one with the highest number of unique (not shared with other callers) mutations. iVar had the highest number of expected mutations compared to callers: it detected all the 17 mutations for BA.1 in all samples. It also performed well for the Delta variant where it called the highest number of expected mutations, same as for GATK, except for sample S292 where all callers did not perform as expected towards the expected mutations (Supplementary file 2).

A-F Upset plots of wastewater samples showing the common set of defining mutations found between Delta, Omicron BA.1 and Omicron BA.2 and wastewater samples (A) S42 (B) S58 (C) S63 (D) S292 (E) 296 and (F) S263 for 6 different variant callers. A=S42, B=S58, C=S63, D=S292, E=S296 – GATK failed, F=S263
Similarly, bar plots showing the number of Indels and MNPs across the samples for the six variant callers were also calculated. As shown in Supplementary Figure 2A-F, for both synthetic and the real wastewater samples, VarScan was the caller consistently with the fewest number of Indels, while GATK and iVar seem to be calling similar numbers of Indels. As observed with the SNPs, LoFreq still has a high number of Indels. Interestingly, not all the variant callers were able to recognise MNPs. As shown in Supplementary Figure 2E-F only FreeBayes and iVar found this type of mutations across both synthetic and real wastewater samples.
Discussion
In this paper we have analysed six variant callers commonly used in bioinformatics data analysis to empirically quantify their ability to identify mutations across mixtures of synthetic samples with known mutations as well as a set of wastewater samples with an unknown number of mutations. Our results suggest that iVAR identified the highest number of expected defining mutations in both synthetic and wastewater samples. The variant callers that showed the highest precision as well as recall were BCFtools, VarScan and FreeBayes. The remaining variant callers exhibited differing degrees of performance with LoFreq being the least sensitive, presenting numbers of mutations that are magnitudes larger than the rest, and subsequently with a lower precision. This also was reflected in the least number of defining mutations detected across all samples, both synthetic and wastewater, which we refer to as true positives.
Wastewater-based epidemiology (WBE) has been used for many years to monitor key pathogens such as polio [31-35]. However, it has undergone a renaissance during the SARS-CoV-2 pandemic, with many tools and software specifically designed to detect the virus in wastewater being developed in the wake of WBE monitoring [36-40]. As such, tools used to detect the virus in clinical samples were used as templates, but in many cases, these did not reflect the composition of the wastewater samples accurately, e.g., the mixed strain nature as well as degradation of the viral RNA in the environment. These nuances impact and should inform downstream analysis at the bioinformatics level: sequences will only be a fraction of the genome, as the samples are highly degraded [41, 42]. Subsequently variant analysis is limited to a shorter region. For this reason, a variant caller that adapts to the type of data available is very important.
The six callers analysed in this paper have many aspects in common as well as significant differences. For example, of all the callers LoFreq is the only one that requires base quality information to call variants, making this method much more stringent and robust than the others, but similarly prone to call many more mutations than expected [18], as seen in our results. In addition, it has been reported that LoFreq can efficiently recognise sequencing errors from expected mutations in non-environmental samples, however, it seems that it did not behave as efficiently in our wastewater samples nor with the synthetic samples. Although for some samples the recall was correct, the precision was lower indicating the lower efficiency. Indeed, LoFreq is a fast and sensitive variant caller that calls many mutations that, however, are not true positive, hence low recall and precision as found in our results. We suggest that this tool is more suited for shorter viral sequences, and more likely in samples with higher coverage. Similarly, GATK was designed to detect genomes across a range of sample sources, but not environmental, and this is reflected in the highly comprehensive set of parameters available to efficiently analyse the datasets [17]. Most of GATK parameters are not applicable to wastewater datasets. These aspects also highlight the difficulty in using these two tools for wastewater data, in contrast to FreeBayes, BCFtools or VarScan, which are functional and easy to apply in non-clinical settings. Nevertheless, we found that compared to most of the callers analysed, GATK did find the majority of the expected mutations (TP). All the callers did identify more mutations that are not variant defining, nevertheless not necessarily false positive.
The selected variant callers have been extensively used in other fields for comparison purposes. For example, a recent paper comparing the efficiency of different mappers and callers in plant NGS data found that GATK was the best caller among those tested, suggesting that the type of data greatly affects not only the results but also the choice of tools used to analyse the datasets [43]. This is in agreement with our own results where GATK showed a higher precision and recall compared to VarScan or BCFtools, as well as a higher number of expected mutations. We suggest these results are valid given the diversity of the datasets; namely, the plant genome being of better quality and not containing mixed strains compared to the wastewater, secondly, the fact that not always the expected mutations are known, thus many more mutations will account as TP or FP. This is independent of the pathogen studied, since most of the tools are widely applicable in different fields. Similarly, another study looking at exome sequencing also found that among the variant callers analysed, GATK UnifiedGenotyper performed best [44]. We suggest that looking at shorter regions of a genome, such as exons, has its advantage since it allows us to work with a relatively smaller and highly covered region. In addition, compared to the above paper, we used GATK Haplotypecaller, which is known to have a different algorithm for calling variants than GATK UnifiedGenotyper.
It should also be noted that many of the parameters within each of these variant callers were left in default in our analysis. In fact, the wide choice of parameters poses a risk on its own when comparing different tools as it introduces biases. In an ideal setting, the correct procedure will imply that all parameters are tested and those reflecting an outcome that is expected are then chosen. In this paper we did not assume a certain output as we did not use all the possible parameters and also because we were not expecting similar results between the callers. Indeed, a small test using FreeBayes showed us that changing certain key parameters yielded to different outputs, all of them being acceptable results (data not shown). Because these parameters are not shared or found in other callers, the comparison could not be achieved, as it would have introduced an advantage or disadvantage for some callers. Clearly, a direct consequence of this is that many results across our data would have had a different outcome. Indeed, LoFreq results might differ enormously if we had considered and adjusted all the parameters accordingly, irrespective of whether these were common to other variant callers.
We therefore suggest that callers such as GATK, Varscan, BCFtools are overall preferable, particularly when mutations are not known as they call with higher specificity and sensitivity. Where possible, these can be improved in their calling capability by adjusting their parameters to increase the specificity of the mutations called.
Data Availability
All data produced in the present study are available upon reasonable request to the authors
Author statements
Funding
Acquisition of the financial support for the project leading to this publication: This work was supported by the UK Health Security Agency, the Natural Environment Research Council (NERC) Environmental Omics Facility (NEOF), and NERC grant NE/V010441/1 to Terry Burke.
Conflicts of interest
The authors declare no conflict of interest.
Funding information
This work was supported by the UK Health Security Agency, the Natural Environment Research Council (NERC) Environmental Omics Facility (NEOF), and NERC grant NE/V010441/1 to Terry Burke.
Data availability
Sequencing data is available upon request.
Acknowledgements
We are grateful to Dr Isabelle Bennet from UKHSA for helpful discussions and comments, Rachel Tucker and Tom Holden from NERC Environmental Omics Facility, Ecology and Evolutionary Biology, School of Biosciences, University of Sheffield for technical assistance


