
Abstract
Introduction The assessment of multiple sclerosis (MS) lesions on follow-up magnetic resonance imaging (MRI) is tedious, time-consuming, and error-prone. Jazz is a deep-learning based software dedicated to enhance the radiologist in this task. We evaluate Jazz for the assessment of new, slowly expanding, and contrast-enhancing MS lesions in three centers, and compared the reported lesions with the lesions described in the standard report.
Methods In three separate centers, 120 MS follow-up MRIs were independently analyzed using Jazz by 2 blinded neuroradiologists. The reading time was recorded. The ground truth was defined in a second reading by side-by-side comparison of both reports from Jazz and the standard clinical report. The number of described new, slowly expanding, and contrast-enhancing lesions described with Jazz was compared to the lesions described in the standard clinical report.
Results A total of 96 new lesions from 41 patients and 162 slowly expanding lesions (SELs) from 61 patients were described in the ground truth reading. A significantly larger number of new lesions were described using Jazz compared to the standard clinical report (63 versus 24). No SELs were reported in the standard clinical report, while 95 SELs were reported on average using Jazz. A total of 4 new contrast-enhancing lesions were found in all reports. The reading with Jazz was very time efficient, taking on average 2min33sec ± 1min0sec per case.
Discussion The quality and the productivity of neuroradiological reading of MS follow-up MRI scans can be significantly improved using a dedicated software such as Jazz.
Introduction
Multiple sclerosis (MS) is an autoimmune, potentially disabling demyelinating disease of the central nervous system (CNS), with clinical onset typically in the young adult. 1 MS patients require at least yearly monitoring with magnetic resonance imaging (MRI) of their CNS lesions to evaluate for disease evolution impacting treatment decisions. These follow-up scans involve the tedious, time-consuming, and error-prone manual comparison and counting of the patient’s demyelinating lesions. Given time constraints and the fact lesion burden can reach hundreds in severe cases, neuroradiologists can be forced to grossly compare the lesion load, and relevant disease evolution might remain unnoticed for some time. Further, neuroradiological MRI reports of MS are often sparse and not standardized, despite the advantages of standardization of clinical data for MS monitoring being well recognized. 2 Structured reports of MRI in patients with MS have been shown to provide more adequate information for clinical decision making than nonstructured reports. 3 Improvement in the digitization of real-world patient data should foster new insights into the epidemiology and pathophysiology of the disease, and are ultimately necessary to achieve truthful personalized patient care.
Jazz4 is a dedicated deep-learning based software for the follow-up assessment of magnetic resonance images and is particularly suited for MS. Jazz preprocesses the images before displaying them, including contrast recognition and coregistration of all images from current and previous exams to optimize the reading time of the radiologist. The software permits efficient, single click navigationto compare images with previous exams and to toggle among different MRI sequences. The coregistration of all images permits rapid lesion comparison “without eye movements”, maximizing efficiency and minimizing errors. (Fig 1) Jazz includes a semi-automatic lesion annotation tool, permitting the user to easily save all relevant information in a lesion list. This ability allows the user separate the assessment of each lesion into distinct steps, again maximizing efficiency and minimizing errors (for example in case of external interruption during the reading). Corrections to lesions in the lesion list can be done easily as well. (Fig 1) By digitizing the findings, Jazz allows generation of a standardized, editable report, including overview figures of the lesions saving time for the radiologist.

Main features of the software. (A) Automatic contrast recognition and (B) image coregistration for fast “single-click” lesion comparison and evaluation. (C) Lesion locking, which permits the evaluation of the lesion in another plane with a “single-click”. (D) Integrated deep-learning-based automatic anatomic localization and lesion tracking permits ultra-fast lesion navigation. The pre-populated pickers allow for fast corrections of lesion characteristics. From the lesion list, the software counts the lesions, summarizes the findings, and generates a report automatically, which permits an additional gain in time.
In this retrospective study, we evaluate Jazz for the assessment of new, expending, and contrast-enhancing MS lesions in three centers, and compared the reported lesions with the lesions described in the standard clinical report.
Methods
The following analysis was performed in three separate centers in a fully blinded and independent manner.
Dataset
A set of 120 (40 from each of the 3 centers) current and prior magnetic resonance examinations of patients diagnosed with MS were obtained. 3D FLAIR, pre- and post-Gad T1-weighted 3D sequences, as well as the corresponding clinical report, were analyzed (Table 1). All data were anonymized.
Number of patients with true positive new lesions.
Jazz Software Tools Description
The cases were loaded in Jazz. In a pre-processing step, Jazz automatically coregistered the images to one another and recognized their contrast. An efficient navigation user interface then permitted switching between exams and contrasts using single click operations or using keyboard short-cuts. An efficient lesion annotation tool permitted marking observed lesions with a single click, wherein the software automatically recognized the anatomical lesion location. An interactive lesion list with picker menus permitted an efficient correction of the lesion description if necessary. (Figure 1)
Case Reading
In each center, two neuroradiologists evaluated independently all 40 cases using the Jazz software (center 1: 12 and 8 years of experience, center 2: 15 and 2 years of experience, center 3: 5 and 3 years of experience). The new lesion and the slowly expanding lesions (SELs) were assessed on the 3D FLAIR, and the contrast-enhancing lesions were assessed by comparing the pre- and post-GAD T1-weighted 3D sequences. Reading time was recorded.
Ground Truth
A ground truth was defined by reevaluating, using side-by-side comparison, all lesions described in the standard clinical reports and the reports generated by Jazz. The ground truth reading was done by either the most experienced reader of both readers (in two centers), or by a third experienced reader (third center, 8 years of experience). Reported new lesions, SELs, and contrast-enhancing lesions in each report were then counted, and classified as true positive, false negative, or false positive.
Statistical Analysis
Statistical significance was assessed using the Mann-Whitney U test between the average reading time with Jazz and generating the standard report. Significance level was set to α < 0.05. Inter-reader agreement between the readers using Jazz was assessed using Cohen’s Kappa.
Results
Patient Population
39 cases were included from center 1 (mean age 55.5 ± 10.6 y, female / male = 30 / 9; one case was excluded because the lesions were very confluent, rendering the comparison of separate lesions difficult). 40 cases were included from center 2 (mean age 48.3 ± 12.8 y, female / male = 31 / 9). 38 cases were included from center 3 (mean age 35.4 ± 9.8 y, female / male = 20 / 18; one case was excluded because the follow-up MRI was done for hydrocephalus evaluation without dedicated description of the MS lesions, and one case was excluded because the 3D FLAIR was missing in one of the exams).
Reading time
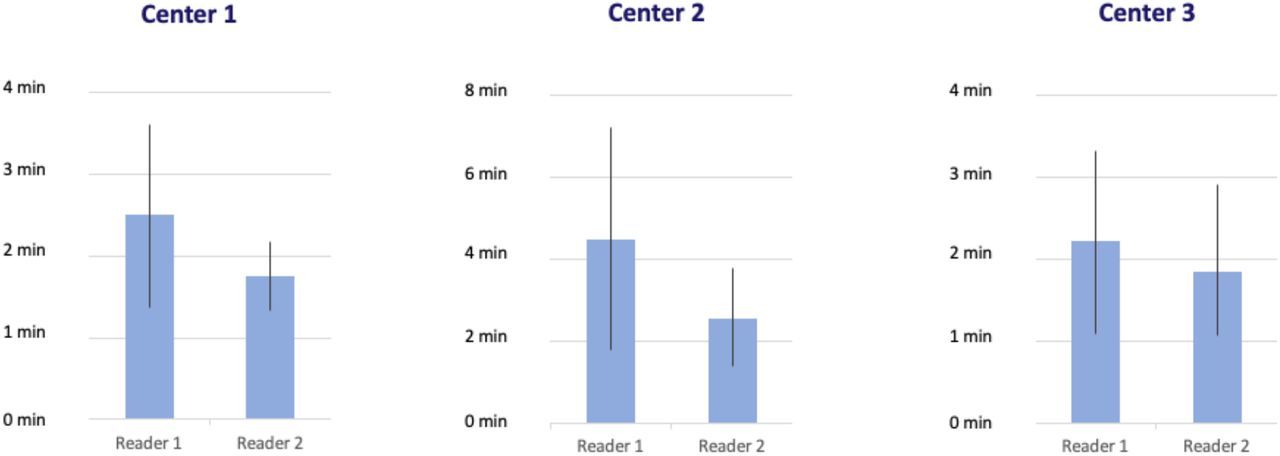
Reading time using Jazz took on average 2 min 33 sec ± 1 min 0 sec per case for all readers (Figure 2). In center 1, reading using Jazz took 2 min 29 sec ± 2 min 15 sec per case for reader 1, and 1 min 45 sec ± 51 sec for reader 2. In center 2, reading using Jazz took 4 min 30 sec ± 2 min 42 sec per case for reader 1, and 2 min 33 sec ± 1 min 12 sec for reader 2. In center 3, reading using Jazz took 2 min 12 sec ± 1 min 7 sec per case for reader 1, and 1 min 51 sec ± 1 min 4 sec for reader 2.

Average reading time (+/- standard deviation) by each reader in the three centers using Jazz.
New Lesions on 3D FLAIR
In all three centers, the ground truth reading reported an average of 0.83 ± 0.08 new lesions per case (a total of 96 lesions from 41 patients, out of a total of 117 patients). The standard clinical reports reported 24 true positive new lesions from 13 patients, 72 false negative, and 5 false positive new lesions. The Jazz report reported on average (average of 2 readers) 63 true positive lesions from 30.5 patients, 33 false negative, and 18 false positive new lesions (p < 0.05; Figure 3 and Table 1).

Number of new and SELs described in the three centers on the standard clinical report and with Jazz (average of two readers; center 1: 39 cases included; center 2: 40 cases included; center 3: 38 cases included).

Examples of missed lesions on the standard report, detected by both readers with the Jazz software.

Examples of SELs not described on the standard clinical report, but described by both readers with the Jazz software.
Slowly Expanding Lesions on 3D FLAIR
In all three centers, the ground truth reading reported an average of 1.39 ± 0.72 SELs per case (a total of 162 lesions from 61 patients, out of a total of 117 patients). The standard clinical reports reported no growing lesions at any center. The Jazz reports reported on average (average of 2 readers) 95 true positive growing lesions from 45 patients, 67 false negative, and 38.5 false positive SELs (p < 0.05; Figure 3 and Table 2).
Number of patients with true positive SELs.
Contrast-enhancing Lesions
In center 1, all patients were administered intravenous contrast, and no contrast-enhancing lesions were described in any report. In center 2, 11 patients were not administered intravenous contrast; in the remaining 29 patients, 4 new contrast-enhancing lesions were described, consistently in all reports, and 1 false positive contrast-enhancing lesion was described on the standard clinical report only. In center 3, all patients except one were administered intravenous contrast; one contrast-enhancing lesion was described, consistently in all reports.
Inter-reader Agreement
Overall inter-reader agreement for new lesions between the readers using Jazz was moderate, with kappa = 0.5 (center 1: 0.45, center 2: 0.51, center 3: 0.54) and for SELs it was slight, with kappa = 0.08 (center 1: −0.3, center 2: 0.3, center 3: 0.22).
Discussion
This study shows that a significantly larger number of new and SELs are reported when using the dedicated software Jazz compared to the standard clinical reporting method. In other words, the use of an ergonometric software design as the one used in Jazz can significantly improve human-based MS lesion detection. In addition, the reading with this software is very time efficient, and permits a significant gain in productivity. The automation of multiple repetitive tasks, such as image contrast recognition and coregistration, lesion counting and report generation, as well as an efficient navigation and lesion annotation tools, as implemented in Jazz, frees the radiologist to concentrate on the lesion assessment, reducing the number of missed lesions.
Jazz uses a particularly potent neurophysiological mechanism to attract the attention of the reader to new and evolving lesions. Interestingly, attention is a selective process and is physiologically necessary, because there are severe limits on our capacity to process visual information. 5 A fascinating theory suggests that attention is imposed by the fixed amount of overall energy available to the brain, and that because of the high-energy cost of neuronal activity, only a small fraction of the machinery can be engaged concurrently. 5 As a consequence, stimuli have to compete for limited resources, 6 a notion that is supported by electrophysiological, neuroimaging and behavioral studies. 7,8 Of the several visual stimuli that are known to capture attention, the sudden appearance of a new object and the sudden changes of an object are known to be particularly potent and to influence priority in visual search. 9–11 This mechanism is exploited in the dynamic switching tool of Jazz, compared to a standard side-by-side comparison method.
This study also shows that at least one SEL was described in more than half of all patients, while none were reported in the standard clinical reports. The inter-reader agreement was low though, showing that this assessment remains particularly difficult and prone to subjectivity. The use of objective criteria defining SELs might help to improve this aspect. SELs can be easily overlooked, and are particularly difficult to detect in a standard DICOM viewer. There is substantial interest in SELs as a potential marker of chronic but active MS lesions 12–14 which may have diagnostic, prognostic and treatment implications. SELs were found to be more prevalent in patients with primary progressive MS (PPMS) compared with patients with relapsing-remitting MS (RRMS). 13 The proportion of SELs and their microstructural tissue abnormalities were associated with a higher risk of MS progression and secondary progressive MS (SPMS) conversion. 15 In SPMS, SELs were found to represent almost one-third of T2 lesions, associated with neurodegenerative MRI markers and related to clinical worsening. 16 Therefore the number and volume of SELs are a promising biomarker to predict a more active, progressive disease course and could become a new target for therapeutic intervention. This is particularly interesting, because recent advances in our understanding of the mechanisms that drive SELs have fueled optimism for improved treatment of this condition. 17
Prior to the availability of the disease-modifying therapies, roughly 50% of those diagnosed with RRMS would transition to SPMS within 10 years, and 90% would transition within 25 years, with a median time of about 19 years. 18 Early intervention with high efficacy disease modifying therapy has recently been shown to delay the onset of SPMS, particularly with high-efficacy disease modifying therapies. 19 The diagnosis of SPMS is most often established retrospectively, years after the actual progression started. 20 This delay, which could be on average 3 years, 21 is caused by the difficulties by the clinicians and the patients to interpret the initial symptoms indicating early progression, as they can be subtle and fluctuating. 20 A robust tool to gather SELs on magnetic resonance images, such as the one described in this work, might help to detect patients with progressive disease earlier and more systematically. The importance of this has further increased with the recent availability of approved new therapies for progressive MS, such as the anti-CD20 monoclonal antibody Ocrelizumab 22 or the selective sphingosine-1-phosphate receptor modulator Siponimod.23
Fully automated neuroradiological reporting of MS lesion load evolution would be of great interest, but current methods have limited practicality given they are far from error free. Reported lesion-wise true positive rate ranges between 0.15 and 0.57, and the lesion-wise false positive rate ranges between 0.08 and 0.68. 24–33 Those numbers are extremely low, given that every single new lesion or SEL on a follow-up control can be considered a marker of disease progression requiring a re-evaluation of the patient’s current therapy. There are several good reasons why this is unlikely to radically change in the near future. Deep learning methods need very large datasets of annotated images to be trained adequately. While large datasets would be available in hospitals, access to them is often very restricted due to medico-legal and various conflict-of-interest raisons. Medical image annotation is extremely tedious and requires a high-level of expertise. Medical image contrast, in particular from magnetic resonance, is rooted in non-linear quantum mechanical laws with very complex behavior. Due to various image acquisition parameters and different properties of the various scanners and receiver coils, magnetic resonance images can be extremely heterogenous between institutions. Finally, and importantly, the medical images are constantly evolving. For example, new pathologies can appear or become more predominant in the disease process itself, treatments can modify the characteristics of the lesions, and images quality improves through constant technical developments. Even the patients’ characteristics significantly evolve over time through collective changes in habits and environment. Fully automated methods should only be used in therapeutic decision-making processes if it can be demonstrated that they are practically error-free.
This study suffers from several limitations. Only three relatively large centers were included, and our results may not generalize to other centers. The reading using the Jazz software was not under identical conditions to the reading employed to generate the standard report, which was done during the standard clinical routine and might have included more distracting events. The reading of the standard clinical reports included at least a first reading and a second reading through a supervisor, and discussion with, and comments from the referring clinicians might have occurred. The reading with the Jazz software only included a single reading from a single reader.
Finally, no standardized method was used to define the SELs, as the evaluation was left to the subjective appraisal of each reader.
In conclusion, this study shows that the quality and the productivity of neuroradiological reading of follow-up MS MRI scans can be significantly improved using a dedicated software such as Jazz.
Data Availability
All data produced in the present study are available upon reasonable request to the authors
References


