
Abstract
Background Magnetic resonance imaging (MRI) enables direct measurements of muscle volume and quality, allowing for an in-depth understanding of their associations with anthropometric traits, and health conditions. However, it is unclear which muscle volume measurements: total muscle volume, regional measurements, measurements of muscle quality: intermuscular adipose tissue (IMAT) or proton density fat fraction (PDFF), are most informative and associate with relevant health conditions such as sarcopenia and frailty.
Methods We developed a pipeline to automatically segment and extract image-derived phenotypes (IDPs) including total and regional muscle volumes and measures of muscle quality, and applied it to the neck-to-knee Dixon images in 44,520 UK Biobank participants. We further segmented paraspinal muscle from 2D quantitative MRI to quantify muscle PDFF and iron concentration. We defined sarcopenia based on grip strength below sex-specific cut-off points and frailty based on five criteria (weight loss, exhaustion, grip strength, low physical activity and slow walking pace). We used logistic regression to investigate the association between muscle volume and quality measurements and sarcopenia and frailty.
Results Muscle volumes were significantly higher in male compared with female participants, even after correcting for height while, IMAT, (corrected for muscle volume) and paraspinal muscle PDFF were significantly higher in female compared with male participants. From the overall cohort, 7.6% (N = 3,261) were identified with sarcopenia, and 1.1% (N = 455) with frailty. Sarcopenia and frailty were positively associated with age and negatively associated with physical activity levels. Additionally, reduced muscle volume and quality measurements were associated with both sarcopenia and frailty. In sarcopenia, muscle volume IDPs were most informative, particularly total muscle exhibiting odds ratios (OR) of 0.392 and 95% confidence intervals (CI) = 0.361 - 0.426, while for frailty, muscle quality was found to be most informative, in particular thigh IMAT volume indexed to height squared (OR = 1.396, 95% CI = 1.374 - 1.418), both with p-values below the Bonferroni-corrected threshold (p < 8.6 × 10⁻⁵).
Conclusions Our fully automated method enables the quantification of muscle volumes and quality suitable for large population-based studies. For sarcopenia, muscle volumes particularly those including greater body coverage such as total muscle are the most informative, whilst, for frailty, markers of muscle quality were the most informative IDPs. These results suggest that different measurements may have varying diagnostic values for different health conditions.
Introduction
Direct population-scale measurements of muscle have been relatively limited, most studies have used measures of fat-free mass (FFM) by bioelectrical impedance analysis (BIA), or measures of lean body mass (LBM) from dual-energy X-ray absorptiometry (DXA) [1,2]. Unlike direct muscle measures, FFM contains all nonfat components of the body, while LBM additionally contains significant and disparate contributions from organs, skin, bones, body water, and essential fat [3]. On the other hand, magnetic resonance imaging (MRI) enables the direct quantification of both muscle mass and quality, with the latter, generally related to levels of muscle fat infiltration [4,5].
Until recently, measurement of total body muscle volume and distribution by MRI has been typically limited to relatively small cohorts, due to the cost and time-consuming requirements of image acquisition and analysis. The lack of automated techniques led researchers to rely on the measurement of single or multiple cross-sectional areas as an index of overall muscle mass, with a single slice at the third lumbar vertebra (L3) [6], individual muscles groups such as the iliopsoas [7] or anatomical groupings such as the ‘thigh muscles’ [5] being among the most popular approaches. The extent to which proxies of muscle volume can provide sufficient information to discern the overall impact of muscle volume and quality on health is yet to be fully ascertained. Additionally, there is a lack of consensus regarding whether muscle measurements should be used independently, as ratios or whether these should be indexed to height [8].
Ageing and morbidity-related declines in physical function, common in sarcopenia and frailty [9], are associated with a loss of muscle mass, strength and reduction in quality [10]. While sarcopenia and frailty are typically associated with ageing, it is increasingly demonstrated that multiple long-term conditions increase the risk of sarcopenia and frailty at a relatively younger age [11,12]. Recent MRI studies have shown the combination of low muscle mass and high levels of muscle fat infiltration to be a predictor of all-cause mortality, suggesting that muscle fat infiltration could contribute to the definition of sarcopenia [13]. However, much of this work has been limited to specific anatomical regions such as the thigh muscle. While the UK Biobank imaging protocol does not encompass the entire body, including only the neck-to-knee region, it is still possible to derive meaningful muscle measures including overall muscle volume within that region, specific muscle groups including iliopsoas muscle, thigh muscles, paraspinal muscles, as well as intermuscular fat content.
In this study, we report both MRI muscle mass and quality measurements for 44,520 UK Biobank participants. We further assess which IDPs related to muscle and fat, both in their unadjusted form and after adjusting for the most common allometric scaling (height squared), are most informative and associate them with anthropometric factors and relevant health conditions including sarcopenia and frailty.
Methods
Data
A total of 44,520 UK Biobank participants were included in this analysis. Participant data from the cohort was obtained through UK Biobank Access Application number 44584. The UK Biobank has approval from the North West Multi-Centre Research Ethics Committee (REC reference: 11/NW/0382). All measurements were obtained under these ethics, adhering to relevant guidelines and regulations, with written informed consent obtained from all participants. Researchers may apply to use the UK Biobank data resources and the results generated in this study, by submitting a health-related research proposal that is in the public interest. More information may be found on the UK Biobank researchers and resource catalogue pages (https://www.ukbiobank.ac.uk).
Image processing and MRI measurements
Full details of the UK Biobank MRI abdominal protocol have previously been reported [14]. The data included in this paper focused on the neck-to-knee Dixon MRI acquisition and separate single-slice multiecho MRI acquisition for the liver. All data were analysed using our dedicated image processing pipelines for the Dixon and single-slice multiecho acquisitions, with deep learning algorithms employed to segment organs and tissue [15]. Proton density fat fraction (PDFF) and R2* were calculated from the Phase Regularized Estimation using Smoothing and Constrained Optimization (PRESCO) method [15].
Our pipeline generates more than 30 image-derived phenotypes (IDPs) from the Dixon MRI data, the subset of IDPs included in this study are primarily muscle volumes, including total muscle (within neck-to-knee volume), thigh (left+right) muscle volume and iliopsoas (left+right) muscle volume. For training the deep learning model, we utilised 108 manual annotations of total muscle and 151 annotations of the iliopsoas muscles. The Dice similarity coefficients on 20% out-of-sample testing data were 0.94 for total muscle and 0.95 for the iliopsoas muscle segmentations. The thigh muscle volumes were derived from the total muscle segmentations using anatomical landmarks from the femur. Together with these IDPs, to avoid any bias of height we also analysed a 10cm image slab, placed at the midpoint of the length of the femur on each leg. This is referred to as the mid-thigh region throughout the text.
In addition to muscle IDPs several adipose tissue depots were extracted, including abdominal subcutaneous adipose tissue (ASAT), visceral adipose tissue (VAT) and intermuscular adipose tissue (IMAT) volumes [15]. We also obtained a measure of intramyocellular fat stored in the paraspinal muscles, referred to as PDFF to avoid confusion. We finally extracted a measure of paraspinal muscle iron concentration by transforming the R2* to iron concentration in mg/g [16]. For model training, we had 195 manual annotations of the Iterative Decomposition of Water and Fat with Echo Asymmetry and Least-Squares Estimation (IDEAL) paraspinal muscles and 187 manual annotations of the gradient echo (GRE) paraspinal muscles. The Dice similarity coefficient on 20% out-of-sample testing data was 0.81 and 0.86 for the paraspinal muscle segmentations in IDEAL and GRE acquisitions, respectively.
To account for the potential confounding effect of height on muscle and fat volumes, IDPs were indexed to the commonly used allometric scaling, height squared [8]. Muscle volume was defined from all muscle IDPs whereas muscle quality was defined from all fat measurements including thigh IMAT volume, mid-thigh IMAT volume and paraspinal muscle PDFF however, to determine a muscle quality measurement related to IMAT, we corrected for muscle volume in the mid-thigh, represented as follows: mid-thigh IMAT/muscle ratio = (mid-thigh IMAT volume / (mid-thigh IMAT volume + mid-thigh muscle volume)) * 100.
Quality Control
IDPs with insufficient anatomical coverage were reported as missing values and a visual inspection of the MRI data was performed to determine potential extreme values in the IDPs to confirm exclusion. To ensure the full anatomical coverage of the organs a threshold was defined as follows:
Total muscle volume: 5 L < total muscle < 60 L. No participants were identified above or below this threshold.
Thigh muscle volume: 1 L < thigh muscle < 15 L. A total of 25 participants were identified and removed from all subsequent analyses.
Thigh IMAT volume: thigh IMAT > 50 ml. One participant was identified and removed from all subsequent analyses.
Images from all excluded participants were subsequently visually inspected to confirm the original finding.
A total of 87 participants were excluded from the volumetric analysis of the Dixon MRI data due to missing values. We excluded 1,547 participants for the muscle and fat volume index analyses, mainly due to missing standing height data. From the single-slice multiecho data 319 participants were excluded from the PDFF and iron concentration analysis in the paraspinal muscle due to missing values.
Phenotype definitions
Anthropometric measurements including age, body mass index (BMI), waist and hip circumferences and hand grip strength (HGS) were taken at the UK Biobank imaging visit. Ethnicity was self-reported at the initial assessment visit and was categorised as follows: White (any British, Irish or other white background); Asian (any Indian, Pakistani, Bangladeshi or any other South Asian background); Black (any Caribbean, African or any other Black background); Chinese and Others (mixed ethnic background including White and Black Caribbean, White and Black African, White and Asian, and other ethnic groups). Sex was self-reported and included those recorded by the NHS and those obtained at the initial assessment visit. The Townsend deprivation index was calculated immediately prior to participants joining the UK Biobank.
Participant’s excess metabolic equivalents of task (MET) in hours per week were computed by multiplying the time in minutes spent in each activity, including walking, moderate and vigorous activity, on a typical day by the number of reported days doing the exercise and the respective MET scores using the methods previously described [17]. Excess METs scores were at 2.3, 3 and 7 for walking, moderate and vigorous activity, respectively [17]. The total physical activity MET was computed by taking the sum of walking, moderate and vigorous MET in hours per week. Any activity lasting less than 10 minutes on a typical day was recorded to 0 for any of the three categories of activity (walking, moderate and vigorous activity). Additionally, for each of the three categories of activity, values exceeding 1260 minutes per week (equivalent to an average of 3 hours per day) were truncated at 1260 minutes [18]. In our following analysis total MET will be referred to as MET. All physical activity measures, alcohol intake frequency and smoking status were self-reported at the UK Biobank imaging visit.
Relevant conditions of interest including probable sarcopenia and frailty were defined according to published criteria:
Probable Sarcopenia was defined as low muscle strength with HGS below 27 kg in male participants and below 16 kg in female participants [11,19]. The HGS used was that of the dominant hand. If participants reported using both hands, the mean of the right and left hand was utilised. Initially, we planned a stricter definition of sarcopenia including low muscle quality as recommended by EWGSOP2 [20] which combines both HGS and DXA-measured appendicular lean mass (ALM)/height²: 6.0/7.0 kg/m² (females/males). However, due to the limited availability of UKBB DXA data, (only 4,683 participants had available DXA measurements) resulting in only 0.3% (78M / 22F) of the cohort meeting the full sarcopenia criteria. Hence, our analysis was focused only on probable sarcopenia. In our analysis probable sarcopenia will be referred to as sarcopenia.
Frailty was defined using the criteria adopted by Hanlon et al. [12], to be used with self-reported UK Biobank questionnaire responses which required the presence of 3 out of 5 indicators. These indicators included weight loss, exhaustion (more than half the days or nearly every day), no or only light (once a week or less) physical activity in the last 4 weeks, slow walking speed, and low HGS (supplementary Table S1). All the frailty indicators were taken at the UK Biobank imaging visit. Additional classifications included pre-frailty (1 or 2 of the 5 indicators), and not frail (none of the indicators).
Statistical Analysis
All summary statistics, hypothesis tests, regression models and figures were performed in R software environment version 4.1.3. Figures were produced using the ggplot2 package [21]. All descriptive characteristics are presented as means with standard deviations (SD) for quantitative variables and as percentages for categorical variables. Spearman’s rank correlation coefficient (ρ) was used to assess monotonic trends between variables. The Wilcoxon rank-sum test was used to compare the means between two groups. One-way ANOVA was used to compare multiple groups.
We explored the association between muscle and fat IDPs and sarcopenia by performing a logistic regression analysis model adjusting for age, sex, ethnicity, alcohol intake frequency, smoking status, Townsend deprivation index, MET and the muscle and fat IDPs including total muscle volume, thigh muscle volume, mid-thigh muscle volume, iliopsoas muscle volume, thigh IMAT volume, mid-thigh IMAT volume, mid-thigh IMAT/muscle volume, paraspinal muscle PDFF and paraspinal muscle iron concentration. We further applied an ordinal logistic regression model to investigate the association between muscle and fat IDPs on frailty given it has multiple ordered categories (not frail, pre-frail, and frail). Ordinal logistic regression models were adjusted for all the variables used in the above logistic regression models. The ordinal logistic regression models were performed using the R MASS package [22]. Because muscle and fat IDPs are associated with body composition measurements such as waist-to-hip ratio and BMI, adjustment for these categories might result in over-adjustment bias [23]. Furthermore, HGS was excluded from logistic models since it is used in the definition of sarcopenia. In all models iliopsoas muscle, thigh muscle, thigh IMAT volumes, and indices are shown as the sum of left and right volumes). All anthropometric variables and IDPs were standardised prior to inclusion in the logistic regression models.
Summaries of the logistic regression model are reported as odds ratios (OR) with 95% confidence intervals (CIs). To assess the performance of each logistic regression model we used the following metrics: Akaike Information Criterion (AIC), the area under the curve (AUC) of the receiver operating characteristic (ROC) with corresponding CIs for sarcopenia and concordance index (c-index) for frailty. Lower AIC values indicate a better model fit, while higher AUC and c-index values suggest better discrimination between cases. AUC was calculated using the pROC R package [24], while the c-index was computed using the rms R package [25]. The Bonferroni-corrected threshold for statistical significance was 0.05/583 = 8.6 × 10⁻⁵.
Results
Typical images showing muscle and fat IDPs generated from each participant are shown in Figure 1. Image datasets were available from 44,520 individuals, with all required IDPs being successfully derived for each participant. Summary statistics for the study population are provided in Table 1, 51.7% were female with similar average age to male (female 63.54 ± 7.58 years and male 64.93 ± 7.83 years). The average BMI for females and males were 26.02 ± 4.72 kg/m2 (range 13.4 to 62.0 kg/m2) and 26.95 ± 3.90 kg/m2 (range 16.4 to 58.1 kg/m2) respectively. HGS in the dominant hand was 38.82 ± 8.85 kg in males and 23.98 ± 6.12 kg in females and the MET was reported as 24.03 ± 17.51 hours/week from female participants and 25.16 ± 17.47 hours/week from male participants (Table 1). The overall ethnic distribution for the cohort was 96.7% White, 1.1% Asian, 0.7% Black, 0.3% Chinese and 1% Others (see methods for details).

Segmentations from the UK Biobank abdominal MRI of a participant showing: A) the total muscle (dark red) overlaid on the coronal view of a neck-to-knee scan, B) the paraspinal muscle (green) in 2D quantitative MRI, C) the thigh muscles (yellow), thigh IMAT (blue), thigh SAT (purple) overlaid on the coronal view, and D) 3D renderings of the muscle segmentations for the following structures: mid-thigh muscle (yellow), mid-thigh IMAT (blue), mid-thigh subcutaneous adipose tissue (purple), paraspinal muscles (green), iliopsoas muscles (red) and total muscle (white).
Total muscle in female and male male participants were 14.04 ± 1.95 L and 21.80 ± 3.00 L (p < 8.6 × 10⁻⁵) respectively, with a mean difference between the sexes of 7.76 ± 3.60 L, or 43% (Table 2). Similar proportional sex differences were observed for all other muscle IDPs. We also observed significant differences between left and right muscle volumes for the thigh, mid-thigh, and iliopsoas muscles in both female and male participants (supplementary Table S2). Mid-thigh IMAT volumes, reflecting reduced muscle quality, were higher in male than female participants (55.19 ± 50.27 ml vs 48.19 ± 38.40 ml, respectively) (Table 2). However, this trend was reversed when IMAT was corrected for muscle volume in the mid-thigh, represented as mid-thigh IMAT/muscle ratio. In this context, female participants exhibited a percentage of 2.48 ± 1.86 %, whereas male participants demonstrated 1.97 ± 1.84 % (p < 8.6 × 10⁻⁵) (Table 2). Paraspinal muscle PDFF, was 7.84 ± 4.03 % in female and 6.88 ± 3.64 % in male participants (p < 8.6 × 10⁻⁵), while iron content showed a small but significant difference between sexes (supplementary Table S2).
Associations between sarcopenia and frailty and muscle health
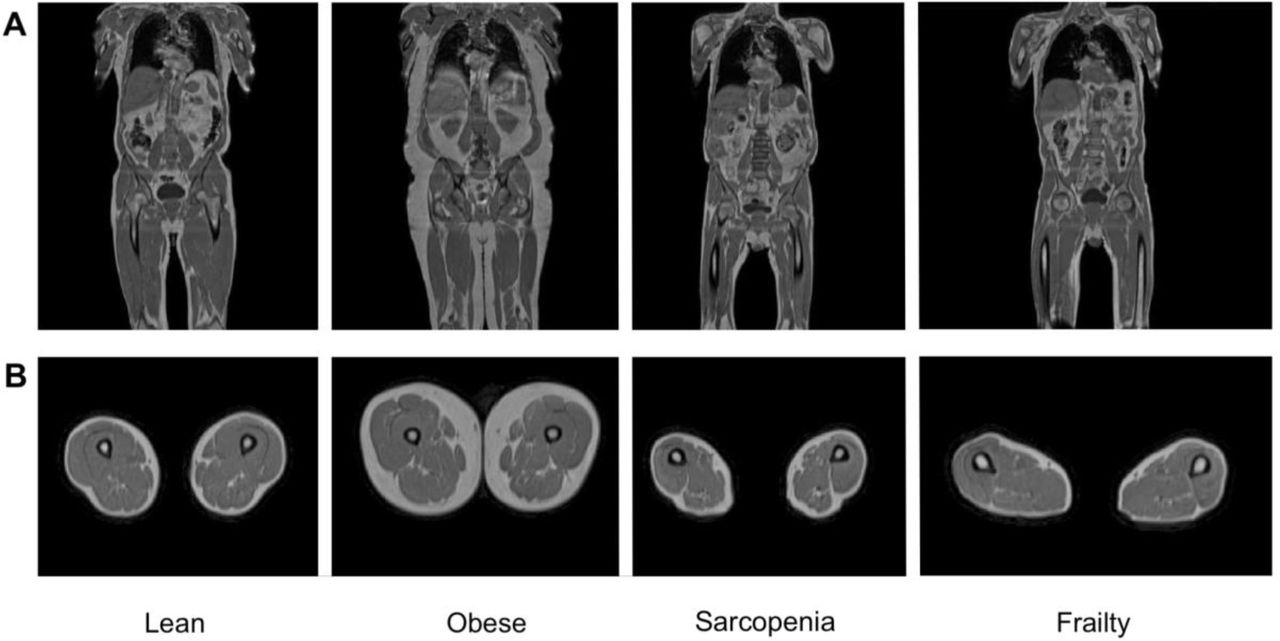
From the overall cohort of 44,520 participants 3,261 (7.6%) were classified as having sarcopenia, and 455 (1.1%) were classified as frail (supplementary Table S3). Representative examples of MRI images from these subgroups are shown in Figure 2. The characteristics as well as the summaries of muscle and fat IDPs of sarcopenia and frailty participants are presented in supplementary Tables S4-S7. In summary, participants with and without sarcopenia were aged 67.96 ± 7.17 and 63.86 ± 7.69 years old, respectively. Not-frail, pre-frail and frail participants were 63.65 ± 7.59, 64.94 ± 7.79 and 66.56 ± 8.04 years old, respectively. Participants with sarcopenia also had lower physical activity levels and a higher waist-to-hip ratio (p < 8.6 × 10⁻⁵). Similar results were observed for frailty. The average total muscle volume for participants without sarcopenia was 17.92 ± 4.64 L whereas for participants with sarcopenia was 16.49 ± 4.20 L (p < 8.6 × 10⁻⁵). For participants without frailty and with pre-frailty, the average total muscle volume was 17.95 ± 4.67 and 17.70 ± 4.57 L, respectively, while frail participants had an average total muscle volume of 16.59 ± 4.13 L. Additionally, muscle quality measurements such as the mid-thigh IMAT/Muscle ratio was higher in participants with sarcopenia and frailty (2.19 ± 1.84 for no sarcopenia; 2.71 ± 2.17 % for sarcopenia; 1.98 ± 1.59 for not-frail; 2.49 ± 1.93 for pre-frail and 3.73 ± 2.86 % for frail). Furthermore, there was a significant correlation between dominant HGS and muscle IDPs among participants without sarcopenia for both males and females, showing the highest correlation with total muscle volume (male: ρ = 0.35; female ρ = 0.38, both p < 8.6 × 10⁻⁵), however, this relationship lost significance in the presence of sarcopenia (supplementary Figure S1).

Representative samples of A) coronal and B) axial MRI views obtained from lean, obese, sarcopenic and frail participants from the Dixon acquisition.
To determine which IDPs were associated with sarcopenia and frailty, we created logistic regression models, adjusting for age, sex, ethnicity, alcohol intake frequency, smoking status, Townsend deprivation index and MET. Our findings reveal that both sarcopenia and frailty were positively associated with age while displaying negative associations with alcohol and MET in all models. However in models including muscle IDPs only sarcopenia displayed a positive association with males (Table 3 and Table 4). Additionally, smaller muscle volume IDPs and larger muscle fat IDPs were associated with the presence of sarcopenia and frailty. Specifically, sarcopenia and frailty were negatively associated with total muscle volume (OR = 0.392 95% CI 0.361 - 0.426, p < 8.6 × 10⁻⁵, for sarcopenia; OR = 0.894 95% CI 0.854 - 0.935, p < 8.6 × 10⁻⁵, for frailty). In contrast, thigh IMAT volume index demonstrated a positive association with increased odds ratios for sarcopenia (OR = 1.129 95% CI 1.091 - 1.168, p < 8.6 × 10⁻⁵) and frailty (OR = 1.410 95% CI 1.388 - 1.432, p < 8.6 × 10⁻⁵). Paraspinal muscle PDFF was also significantly associated with sarcopenia and frailty showing increased odds ratios (OR = 1.094 95% CI 1.059 - 1.130, p < 8.6 × 10⁻⁵, for sarcopenia; OR = 1.350 95% CI 1.327 - 1.372, p < 8.6 × 10⁻⁵, for frailty) while, paraspinal muscle iron concentration was not significantly associated with any of these conditions.
Performance evaluation
Performance judged by the model with the lowest AIC (Akaike’s Information Criterion) and the highest AUC and c-index (Table 3, Table 4 and supplementary Table S8), showed that for sarcopenia, total muscle (AUC = 0.707 (0.698, 0.716 95% CI)) and total thigh volume (AUC = 0.707 (0.697, 0.716 95%CI)) were the most informative IDPs (Table 3), with muscle quality IDPs providing the least information. Interestingly, the indexed volumes demonstrated a relatively poor fit in their associations with sarcopenia. Conversely, for frailty, measures of muscle quality including thigh IMAT volume index (c-index = 0.621) and mid-thigh IMAT/Muscle ratio (c-index = 0.618) were the most informative, with muscle volumes IDPs providing less information (Table 4 and supplementary Table S8).
Discussion
In the present study we have utilised an automated deep-learning technique to accurately measure muscle volumes and quality in a large prospective cohort of middle-aged and older adults in the UK Biobank. We have confirmed and expanded on previous studies looking at the impact of age, sex, and lifestyle factors on muscle strength and have identified muscle volume and quality measurements being strongly associated with sarcopenia and frailty, respectively [26].
Muscle volumes were significantly higher in male compared with female participants, even after correcting for height. We further show that total thigh IMAT content was significantly higher in male compared to female participants, however when presented as the mid-thigh IMAT/muscle ratio, this relationship was reversed, with higher levels of mid-thigh IMAT/muscle found in female participants. Similarly, paraspinal muscle PDFF was significantly higher in female participants. This clearly highlights the impact of the type of measurement on possible outcomes. Previously studies have reported higher whole-body and thigh IMAT levels in men [4,27], but these were generally not corrected for muscle volume. Although, correcting for muscle mass negated reported sex differences in IMAT [28].
The prevalence of sarcopenia (7.6%) and frailty (1.1%) were relatively low in our cohort, in agreement with reports that the UK Biobank cohort is a comparatively healthy population [29]. In this study, we defined sarcopenia based solely on low muscle strength [11], without including reduced muscle mass/quality and/or reduced physical performance. Across all models incorporating muscle volume measurements, this definition of sarcopenia showed a strong positive association with men. Additionally, participants with both sarcopenia and frailty demonstrated strong positive associations with age and lower physical activity level in all models, confirming earlier literature reports [30].
Our study further aimed to identify which of our measured muscle IDPs were associated with these health conditions, and which would potentially provide the best prognostic tool for identifying this population. We found that sarcopenia was associated with reduced muscle volume and increased levels of mid-thigh IMAT/muscle and paraspinal PDFF. Notably, for sarcopenia, the most informative muscle volume measurements were those with a greater proportion of body included such as total muscle or the entire thigh. On the other hand, for frailty markers of muscle quality, particularly thigh IMAT volume index to height squared and mid-thigh IMAT/Muscle were the most informative IDPs. This suggests that different IDPs may have different diagnostic values for different conditions. Interestingly, we observed that the muscle volumes indexed to height squared demonstrated a relatively poor fit in their associations with sarcopenia. Previous studies investigating associations between low muscle mass, malnutrition and sarcopenia with cancer in the UK Biobank [31], found that in participants with obesity, only the BMI-adjusted muscle mass identified cases of low muscle mass and sarcopenia. They also reported that BMI-adjusted methods may be more suitable for determining these cases of malnutrition and sarcopenia; however, height-adjusted muscle mass showed a higher risk of these conditions occurring. Furthermore, in a previous study, Linge et al, [8] reported that body size adjustments led to unnormalized correlations between muscle volume and body size. However, they also report that adjustments considering the distribution of height-adjusted measurements for each body size value significantly strengthened the associations between muscle volume and both functional and health outcomes. Future work using longitudinal data may provide better insights into which muscle volume and quality measurement can best associate with or even predict these health conditions.
Our study is not without limitations. The UK Biobank is a large cross-sectional study that is subject to selection bias with a “healthier” than the wider UK population, excludes younger participants and potentially more severe clinical cases [32]. Furthermore, as the UK Biobank study includes a predominantly White population, future work is needed to further investigate imbalanced population data. Also, given the UK Biobank neck-to-knee acquisition, measurement of whole-body muscle volume could not be achieved, thus limiting direct comparisons with some literature values [33]. We estimate that the current protocol lacks c.a. 9.75% of total muscle, corresponding to both arms and lower calves. However, as our findings were robust to the selection of muscle volume or quality measure, we consider it unlikely that results with a whole body measure would be dramatically different.
Conclusions
We have presented a fully automated method that enables the measurement of muscle volumes and quality suitable for application to large population-based studies. We have reported that while the choice of muscle measurement may have an impact on the ability to identify disease, most provide consistent differences relating to the detection of the impact of age, sex, and clinical conditions on muscularity.
Declarations
Competing of Interests
M.C., R.S, and E.P.S. are employees of Calico Life Sciences LLC. Y.L. is a former employee of Calico Life Sciences LLC. M.T., N.B., B.W., J.D.B. and E.L.T. declare no competing interests.
Ethics approval and consent to participate
The data resources used in this study have approval from ethics committees. Full anonymised images and participants metadata from the UK Biobank cohort was obtained through UK Biobank Access Application number 44584. The UK Biobank has approval from the North West Multi-Centre Research Ethics Committee (REC reference: 11/NW/0382), and obtained written informed consent from all participants prior to the study. All methods were performed in accordance with the relevant guidelines and regulations as presented by the relevant authorities, including the Declaration of Helsinki https://www.ukbiobank.ac.uk/learn-more-about-uk-biobank/about-us/ethics.
Consent for publication
Not applicable.
Availability of data and materials
The UK Biobank resource is available to bona fide researchers for health-related research in the public interest. All researchers who wish to access the research resource must register with UK Biobank by completing the registration form in the Access Management System (AMS - https://bbams.ndph.ox.ac.uk/ams/).
Funding
This study was funded by Calico Life Sciences LLC.
Author Contributions
J.D.B., E.L.T., M.T. and M.C. conceived the study. J.D.B., B.W., E.L.T., N.B. and M.T. designed the study. M.T., N.B., B.W., Y.L., E.P.S. and M.C. implemented the methods and performed the data analysis. M.T. defined the disease categories. M.T. performed the statistical analysis. E.L.T., B.W., M.T., J.D.B., R.S. and N.B. drafted the manuscript. All authors read and approved the manuscript.
Data Availability
The data that support the findings of this study are available from the UK Biobank (https://www.ukbiobank.ac.uk), but restrictions apply to the availability of these data, which were used under license for the current study, and so are not publicly available. Data are however returned by us to the UK Biobank where they will be fully available on request.
Acknowledgements
This research has been conducted using the UK Biobank Resource under Application Number 44584.
Footnotes
Removed figure 2 nd 3 and added tables showing Regression coefficients between sarcopenia and frailty and the anthropometric covariate and muscle and fat IDPs.


