
Abstract
United States’ jurisdictions implemented varied policies to slow SARS-CoV-2 transmission. Understanding patterns of these policies alongside individual’s behaviors can inform effective outbreak response. To do so, we estimated the time-varying reproduction number (Rt), a weekly measure of real-time transmission using US COVID-19 cases from September 2020-November 2021. We then assessed the association between Rt and policies, personal COVID-19 mitigation behaviors, variants, immunity, and social vulnerability indicators using two multi-level regression models. First, we fit a model with state-level policy stringency according to the Oxford Stringency Index, a composite indicator reflecting the strictness of COVID-19 policies and strength of pandemic-related communication. Our second model included a subset of specific policies. We found that personal mitigation behaviors and vaccination were more strongly associated with decreased transmission than policies. Importantly, transmission was reduced not by a single measure, but by various layered measures. These results underscore the need for policy, behavior change, and risk communication integration to reduce virus transmission during epidemics.
Introduction
As SARS-CoV-2 began to spread globally in early 2020, early estimates of the basic reproduction number (R0), a metric of the average number of cases infected by each infectious person in a fully susceptible population, indicated that the virus was more transmissible than influenza (1) with a median R0 estimate of 2.79 (2). With limited knowledge about transmission dynamics and no vaccines to mitigate viral spread, governments began to implement travel restrictions and stay-at-home orders to reduce contact between individuals and opportunities for transmission. These non-pharmaceutical intervention (NPI) policies rapidly evolved and eventually encompassed a spatially and temporally diverse range of policies, such as non-essential business closures, limiting operational hours of bars and restaurants, cancellation of large events, limiting the size of social gatherings, shutting down workplaces and schools, or mandating the use of masks in public spaces.
Published evidence showed that NPI policies, such as stay-at-home orders and closure of public facilities, slowed SARS-CoV-2 spread throughout the world during the early phase of the pandemic (3–5). Extensive evidence has also accumulated about the effectiveness of other specific NPI policies, such as limiting the size of gatherings and closing schools or universities, and their combinations being more effective than stay-at-home orders (3, 5). Changes in behavior that were not explicitly linked to policies, as well as climatic and sociodemographic factors, also appeared to affect transmission dynamics. For example, social structure dramatically influences SARS-CoV-2 transmission dynamics by affecting how people interact. Within the United States (US), it became evident that physical distancing by staying home from work was a policy option available to more wealthy and White individuals rather than frontline, essential worker populations (6), who are more likely to have a lower socioeconomic status and belong to racial minoritized communities (7, 8). Additionally, SARS-CoV-2 testing sites may have been disproportionately available in areas that had a greater proportion of White residents (9–11). In other words, the opportunity to know one’s infection status and limit interactions with others, if necessary, was only available to a privileged subset of the population. Moreover, weather factors added further complexity to these dynamics. For example, the literature suggests that SARS-CoV-2 transmission decreases as temperature and specific humidity increases (12); potentially by weakening the viral envelope (13) and impacting when people spend time indoors and under conditions more favorable to viral transmission. Additionally, as the pandemic progressed, the role of post-infection and post-vaccination immunity and the role of viral evolution also became apparent. Whether COVID-19 mitigation policies effectively reduced transmission thus requires an assessment within the broader context of behavior, social factors, and weather conditions.
The US COVID-19 epidemic provides an opportunity to assess the contribution of many of these factors to SARS-CoV-2 transmission. Diverse COVID-19 mitigation policies were heterogeneously implemented over time and across jurisdictions (14). Overall, 55 million cases and over 820,000 deaths were reported in the United States by December 31, 2021 (15), patterned by existing demographics and health disparities within each jurisdiction. Given the heterogeneity in case and death patterns and the overall success of NPI policies in other countries, we seek to understand spatial and temporal impact of COVID-19 mitigation policies on US SARS-CoV-2 transmission. We do so by first estimating the time-varying reproduction number (Rt) in each US jurisdiction between September 2020 and November 2021. We then model the ecological associations between Rt and time-varying mitigation policies, explicitly adjusting for factors that directly or indirectly affect or modify community transmission, including personal COVID-19 mitigation behaviors, the circulation of key SARS-CoV-2 variants, weather data, indicators of immunity, and COVID-19 vulnerability indicators.
Results
Between September 2020 and November 2021, Rt estimates exhibited spatiotemporal variability across the United States (Figure 1). All jurisdictions experienced sustained increases in transmission (Rt > 1) in late 2020, followed by a period of fluctuations until the Delta wave in the summer of 2021, when many had their highest Rt estimates. Despite some consistency in trends, our results reveal that Rt dynamics differed substantially between jurisdictions, such as the timing and rate of the transmission increases in late 2020 during the Alpha wave. The lowest mean estimated Rt over this period was for Vermont in May 2021 (Rt=0.66) and the highest value was for the District of Columbia (DC) in November 2021 (Rt=1.62).

The jurisdiction-specific weekly COVID-19 time-varying reproduction number (Rt), 90% confidence intervals in grey, and time periods reflecting implementation of specific non-pharmaceutical interventions (NPIs). State-wide implementation of stay-at-home orders are in red, restrictions on gatherings in yellow, cancellation of public events in dark blue, and universal masking when physical distancing was not possible in light blue. The solid vertical line represents January 1, 2021 and the dashed horizontal line reflects an Rt value of 1.0.
Stay-at-home orders, gathering limitations, cancellation of public events, and mask mandates all exhibited spatiotemporal variability (Figure 1) and moderate correlation (maximum: 0.47, Supplemental Figure 1B). Hawaii, Illinois, Rhode Island, and Virginia implemented all four of these policies at least once, while other jurisdictions, such as Alaska, Florida, Iowa, Missouri, Montana, Oklahoma, and South Dakota, did not implement any of them. Overall, stringency of mitigation policies dipped slightly in October 2020 and decreased substantially between March and June 2021 (Figure 2A). Variation in policy stringency across jurisdictions persisted throughout the study period, with the lowest median value in South Dakota (0.09; range: 0.06 to 0.21) and the highest median value in Hawaii (0.66; range: 0.44 to 0.76).

A. Distribution of time-varying covariates, including the Oxford Stringency Index (OSI), personal COVID-19 behaviors, proportion of key SARS-CoV-2 variants in circulation, weather, and immunity to SARS-CoV-2. Lines reflect jurisdiction-level observations over time, with the median values across jurisdictions depicted by the bold line. The solid, black vertical line represents January 1, 2021. B. Average of the three selected Community Covid-19 Vulnerability Index (CCVI) indicators for each jurisdiction.
Personal COVID-19 mitigation behaviors also varied over time and space (Figure 2A). Reductions in national airline travel and individual mobility showed similar patterns over time, though individual mobility also varied by jurisdiction. Reductions in both were substantial and relatively static until March 2021, at which point airline travel and mobility began to return closer to pre-pandemic levels. Across jurisdictions and time periods, self-reported mask use and gathering attendance among survey respondents were highly negatively correlated (−0.83, Supplemental Figure 2), indicating that both are likely indicators of personal risk reduction behaviors. Because of the high correlation, we focused on a single variable, self-reported mask use, as an indicator of personal protection measures for further analyses. Reported mask use was also positively correlated with local mobility (Supplemental Figure 1A, R2 value of 0.68) but had distinct patterns. For example, the weekly proportion of respondents that self-reported wearing a mask remained above 75% in most jurisdictions until May 2021, when it declined sharply. In August 2021, all three mitigation behavior indicators increased, with new reductions in national airline travel and local mobility, as well as increased reported mask use (Figure 2A).
The increased personal mitigation behaviors in August 2021 coincided with the rapid increase in prevalence of the Delta variant (Figure 2A, Supplemental Figure 1A). Expansion of the Alpha variant in early 2021 was generally slower, more heterogeneous, and not correlated with increased mitigation behavior. In addition to potential direct effects on transmission, increased temperature (highly correlated with absolute humidity, Supplemental Figure 3) was associated with decreased personal mitigation behaviors and increased rates of vaccination (Supplemental Figure 1).
There was high heterogeneity in jurisdictional SARS-CoV-2 seroprevalence throughout the analysis period. By the end of November 2022, seroprevalence ranged from 0.10 in Vermont to 0.46 in Wyoming (Figure 2A). The proportion of the population that was fully vaccinated with an initial vaccine series increased across all jurisdictions beginning with the vaccination distribution in early 2021 and ranged from 0.47 (Alabama) to 0.75 (Vermont) at the end of November 2021. Increased seroprevalence and vaccination coverage were correlated with each other (0.69, Supplemental Figure 1A), with long-term decreases in the mitigation behavior indicators (−0.48 to -0.98), and with the prevalence of the Delta variant (0.52 and 0.83, respectively).
Community COVID-19 Vulnerability Index (CCVI) indicators showed high heterogeneity across all jurisdictions (Supplemental Figure 5A) and some correlation with temperature, vaccine coverage, and personal mitigation practices (Supplemental Figure 5B). Average vulnerability across the five indicators showed higher vulnerability in southern jurisdictions (Figure 2B), with the highest average vulnerability in Texas (0.80), Arizona and California (0.72, respectively). Vermont had the lowest average vulnerability (0.15), followed by New Hampshire (0.22) and Montana (0.27).
We fitted two regression models to assess the spatiotemporal relationship of each of these factors with the dynamics of Rt on the logarithmic scale over time in all jurisdictions: the Oxford Stringency Index (OSI) Model using OSI as the only policy indicator and the Individual Policy Model, using four specific policies: cancellation of public events, restriction of gatherings, stay at home orders, and mask mandates (See Supplement Figure 6). For both models, we assessed alternative spatiotemporal model structures and found that a model with independent random effects for time and state provided the best fit to the data (see Supplement 8). We also adjusted for other factors described above that potentially contribute to Rt: individual behavior, the prevalence of specific variants, immunity, weather, and community risk factors (i.e., the CCVI indicators). Fixed effect intercepts for both models indicate average expected Rt values well above 1.0 without any mitigation behaviors or policies. With moderate values for CCVI indicators (0.5 each) and temperature (12°C), estimated Rt in the absence of mitigation was 2.6 for the OSI Model (95% Credible Interval [CI]: 1.9-3.5) and 2.5 (95% CI 1.9-3.4) for the policy model.
While some policies and behavior indicators were moderately correlated, such as restrictions on gathering sizes and reduced mobility (R2 = 0.53, Supplemental Figure 1), we included both types of covariates in the regression models to assess the relative strength of their associations with Rt. Overall stringency, some of the specific individual policies, and each of the behavioral components were associated with decreased Rt (Figure 3). Implementation of half of the strictest policies (i.e., OSI at 50%) relative to no policies (OSI at 0%) was estimated to decrease Rt by 6.7% (95% CI: 5.1-8.3%). In the model with individual policies, cancellation of public events decreased Rt by 2.6% (95% CI: 1.4-3.7%), restrictions on gathering sizes by 1.2% (95% CI: 0.1-2.2%), and stay-at-home orders by 2.6% (95% CI: 0.3-4.8%). Mask mandates had a mean estimate corresponding to a 0.7% reduction in Rt but did not reach statistical significance (95% CI: -1.5-0.2%). Strong associations were also observed for personal mitigation behaviors in both models. For the OSI Model, Rt was estimated to decrease by 22% (95% CI: 18%-26%) if there were a 50% reduction in national airline travel, 2.9% (95% CI: 2.4-3.3%) if local movement to recreation and retail locations decreased by 10%, and 14% (95% CI: 12-15%) if self-reported mask use reached 50%. Sensitivity analysis showed consistent estimates for policy impacts even when personal mitigation behaviors were excluded (Supplement 10).

Percent change in the COVID-19 time-varying reproduction (Rt) number from policies, personal COVID-19 behaviors, proportion of key SARS-CoV-2 variants in circulation, weather, immunity to SARS-CoV-2, and variables affecting underlying trends in transmission. The results from two different linear regression models are shown below. Model one, in pink, included the Oxford Stringency Index (OSI). Model two, in purple, included a subset of policies used to comprise the OSI. Both regression models were gaussian with log link function and had jurisdiction and time specific intercepts.
In both models, a 50% increase in the proportion of Alpha variant in circulation had a likely positive but not significant association with Rt (95% CI: -0.20-0.10%, OSI Model), while a 50% increase in the proportion of Delta among current variants was associated with a 0.1% (95% CI: 0.01-0.02%, OSI Model) increase (Figure 3). Seroprevalence and vaccination were both associated with reduced Rt in each of the models, a 30% (95% CI: 28-32%, OSI Model) and 22% (95% CI: 18-26%, OSI Model) estimated reduction if half of the population had been previously infected or fully vaccinated, respectively. Increased temperature was associated with a 4.0% (95% CI: 3.0-5.0%, OSI Model) decrease in Rt per 10°C increase in mean weekly temperature. Among sociodemographic factors, we found that greater population density and greater racial and ethnic diversity were associated with increased Rt in both models. Coefficients were similar in direction for both models, with or without informative priors (see Supplement 6), and with alternative estimates of Rt (see Supplement 9), minor differences in magnitude were observed in our sensitivity analyses (Supplement 9).
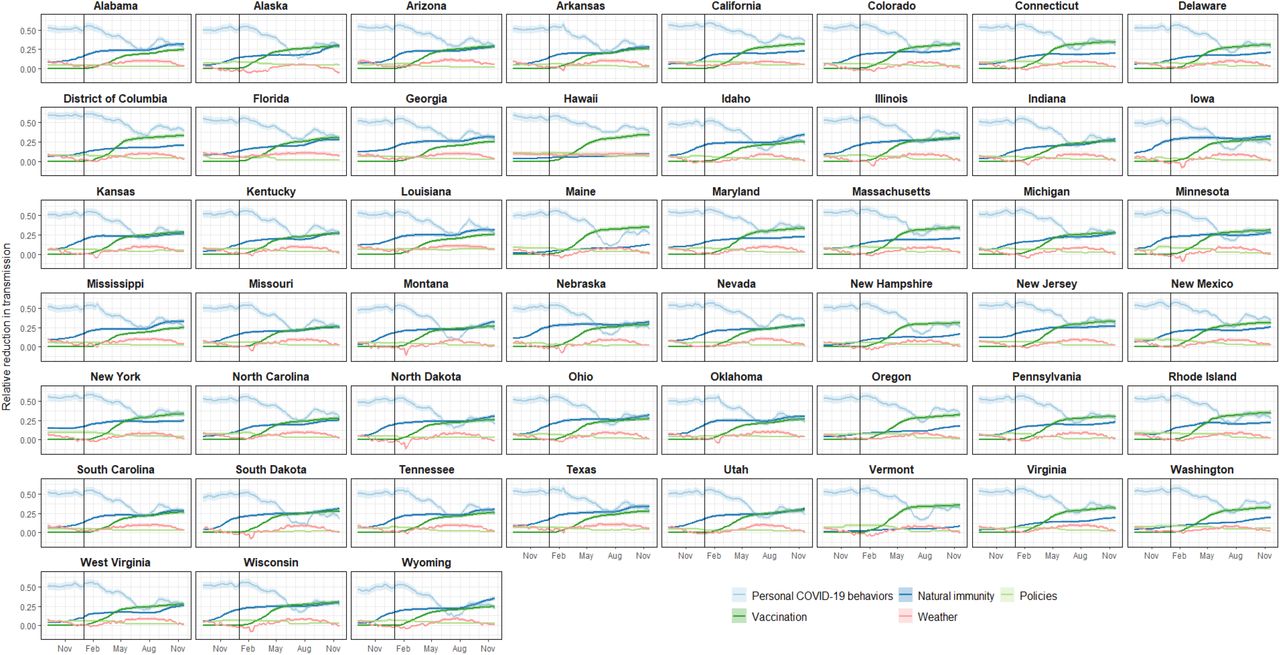
We estimated the proportional reduction associated with each time-varying component individually and combined for each jurisdiction and nationally over time using the OSI Model estimates (Figure 4, Figure 5, and Supplemental Figure 7). Over the entire study period, personal mitigation behaviors were associated with the largest proportional transmission reductions in all jurisdictions before vaccine implementation and remained an important or leading contributor to reduction thereafter (median combined reduction over time across locations: 44%, range: 10-62%) (Figure 5). Immunity was the second most important contributor overall and of growing importance as more people were infected and vaccination coverage increased. These patterns, however, were starkly different across the United States (Figure 4 and Supplemental Figure 7). For example, in November 2021 many jurisdictions had higher estimated reductions associated with previous infections than vaccination (e.g., Wyoming). Meanwhile other jurisdictions with lower seropositivity or more vaccinations had higher estimated reductions associated with vaccination (e.g., Vermont). At the end of the study period, SARS-CoV-2 seroprevalence and vaccination were associated with a wide range of reductions across jurisdictions (8-35% and 24-36%, respectively). Policies and weather were also associated with changes in transmission but with less overall estimated magnitude than the effects of behavior and immunity.

Estimates for jurisdiction-level proportional reductions in the COVID-19 time-varying reproduction number (Rt) over time for the Oxford Stringency Index (OSI) regression model. Colored lines depict the relative reduction for select sets of covariates and the solid vertical line represents January 1, 2021.

Average relative contribution of observed covariates on fitted COVID-19 time-varying reproduction number (Rt) across all jurisdictions from the OSI model. The highest values over time (i.e., the top of the pink band) represent Rt estimates including only the effects of local vulnerability and variants. The pink band represents reductions in Rt associated with changing weather. The blue bands represent reductions in Rt associated with infection-acquired immunity (dark blue) and with behavior modification (i.e., masking use, mobility, and national airline travel, combined and depicted with light blue). The green bands represent reductions in Rt associated with policies (light green) and vaccination (dark green). The fitted values from the regression model are represented with the top of the black band. The solid vertical line represents January 1, 2021.
Discussion
Deciphering SARS-CoV-2 transmission drivers throughout the pandemic can inform development of policies and interventions for mitigation of respiratory pathogens. Our analysis integrates spatial and temporal patterns of potential transmission determinants to assess associations between those determinants and SARS-CoV-2 transmission. The findings presented here are derived from large scale data and are statistically supported, but they cannot establish causality due to the limitations of each dataset and the many known and unknown potential confounders. Nonetheless, two important insights for mitigation strategies were elucidated. First, while both general and specific policies and behavior were associated with reduced SARS-CoV-2 transmission, masking wear and reduced airline travel were associated with greater transmission reductions. Second, throughout the study period multiple factors contributed to limiting transmission; personal mitigation behavior had large impacts early on while the importance of previous infection and vaccination increased as population-level immunity increased over time. As these effects are considered multiplicative in the model, the findings imply that combinations of behavioral mitigation were critical to limiting transmission throughout the study period.
Early COVID-19 mitigation strategies in US jurisdictions focused on physical distancing (e.g., stay at home orders, cancelation of public events, restricting gathering sizes) and masking policies. Our estimates suggest that physical distancing policies reduced SARS-CoV-2 transmission, with an estimated mean reduction of 1-3% for individual policies and an estimated total reduction of approximately 6% if sets of policies tracked by the OSI reach 50%. These reductions are in line with other, short term, national-level assessments of NPI policies and showed reductions in COVID-19 cases (16–19), transmission (20–22), and deaths (17); there was some reduction in effectiveness for policies with longer durations (17). In contrast to our null results for masking policies, jurisdiction-specific studies show short-term effectiveness of mask mandates at reducing cases (23) and hospitalization growth rates (24). Importantly, most of these early evaluations focused on the period in which the NPIs were in effect and did not assess long-term effects or periods when the NPI was not implemented, as was done here. There is some evidence of limited prolonged reduction in COVID-19 outcomes when NPI policies were lifted (25), with more socially disadvantaged communities experiencing greater rebounds in COVID-19 burden than other communities (26). Overall, the association between individual policies and reductions in transmission was strong but accounted for only a modest overall reduction in transmission risk. This finding is due to the model’s inclusion of related factors like NPI policy implementation stringency and proxies for adherence to the policies via personal mitigation behaviors.
The relationships underlying policy implementation and behavior are complex and reflect personal characteristics, community characteristics, and social structure. Like others, we found indicators of behavior such as local mobility, national airline travel, and self-reported mask use to be associated with significant reductions in Rt although not necessarily temporally aligned with the corresponding policies (27). For example, analysis of early mobility data showed that movement patterns in the United States changed drastically even before the implementation of most physical distancing policies (28), with continued reductions in movement after policies were in place (29). It is plausible that broad agreement within the physical distancing policies early in the pandemic (30) influenced personal choices to stay home. Similarly, mask use increased, and local mobility decreased rapidly as the Delta wave grew even though updated recommendations stated that vaccinated individuals could resume pre-pandemic activities without wearing a mask, once again, indicating a behavioral response that was independent of policy. Conversely, one example of temporal alignment between policy and behavior was immediately following the May 2021 guidance update when there was a rapid decrease in reported mask use and increases in local mobility, likely an effect of individuals returning to activities that had previously stopped due to the pandemic.
Prior to the Delta wave, vaccination rates across the United States were steadily rising, with varying geospatial, socioeconomic, and race and ethnic patterns of vaccination coverage (31, 32). Many jurisdictions had also experienced substantial transmission in 2020 and early 2021, resulting in greater infection-acquired immunity in their populations. While we did not adjust for waning immunity (33), changing vaccine effectiveness with time from vaccination and with the appearance of new variants (33, 34), we found associations of both infection-acquired immunity and vaccination with decreased transmission. It is plausible that if we adjusted our model estimates for waning immunity, the strength of the immunity-related associations would be attenuated. In most states, the relative impact of either infection-acquired immunity or vaccination was estimated to be as high as the decreasing impact of behavior change by November 2021, when the impact of vaccination was estimated to be higher than the impact of infection-acquired immunity. There were also distinct differences across states, with some states showing comparable impact by late 2021 (e.g., Alabama, Arkansas) and others showing much higher impact from vaccination than infection-acquired immunity (e.g., Connecticut, Hawaii). Additionally, we did not adjust our model for COVID-19 testing, which may have a non-linear relationship with seropositivity since testing availability and behaviors changed over time.
Social structure drives transmission patterns for all pathogens and the US COVID-19 epidemic highlighted existing social fault lines that influenced not only who in society was more likely to get infected, but also who was more likely to benefit from mitigation measures (35, 36). Here, we accounted for multiple social vulnerability indicators and found national-level evidence of higher transmission rates in states with higher population density and greater racial and ethnic diversity. Our findings are in line with several results from county level analyses. For example, higher rates of SARS-CoV-2 transmission occurred in low-income and racial minoritized communities (37). Additionally, counties with higher social vulnerability were more likely to become a COVID-19 burden hotspot (38), that is a geographic area with elevated disease incidence (39). Because structural racism is part of the intersectional factors comprising social vulnerability, it is unsurprising that hotspots were common in US counties with a greater percentage of non-White residents (40–42). These findings highlight the importance of incorporating social markers of risk in infectious disease transmission models (43).
Our findings are limited to associations and not causal relationships. Establishing causality between mitigation measures and transmission is complicated by a variety of risk factors, from the emergence of SARS-CoV-2 variants and changes in human behavior to environmental conditions–all of which fluctuate over time and space. First, many of the important determinants of SARS-CoV-2 transmission are correlated and have complex interactions. To partially address this limitation, we removed highly correlated variables that measured similar factors when possible. However, we did choose to retain some highly correlated variables. For example, COVID-19 vaccination and the recovery of national airline travel had a strong correlation (correlation coefficient: -0.94 between vaccination and travel reductions) largely driven by increased travel in early 2021 which occurred at the same time as the expansion of vaccine availability and uptake. Increased national travel likely has some direct relationship with vaccination due to increased willingness or interest in travel for vaccinated individuals; however, other factors, such as decreased case numbers, increased numbers of people with infection-acquired immunity, or changing risk perceptions, likely also contributed. Second, we applied a regression framework, which assumes log-linear independence between covariates that does not account for the observed correlation between variables. Overall, the potential causal pathways between the predictors and Rt are not individually identifiable at this scale. We encourage caution in interpretation of any single association general insight into SARS-CoV-2 transmission patterns in the US.
Related limitations apply for our assessment of policies, many of which were correlated and did not capture all potentially important details of each policy. For example, we used state level policy indicators that may differ substantially from policies implemented at a county or city level. Additionally, many different variations of policies were implemented (e.g., some jurisdictions required masks universally, whereas others only in certain locations or where physical distancing was not possible), even within jurisdictions, and those variations were not captured here. Instead, we opted to use a limited set of policy classifications and assigned those to the entirety of each jurisdiction. Use of the composite policy indicator, the OSI, is a complementary approach to the same challenge but is also a necessary over-simplification of the diversity of policies implemented.
Our analysis found that diverse efforts had substantial associations with SARS-CoV-2 transmission across the United States in 2020-2021. Ideally the wealth of data and diversity of interventions in the United States could be used to develop specific recipes for control. However, that diversity and correlation between many contributing factors makes precise estimates of specific interventions and combinations of intervention infeasible. Here, we focused on an ecological scale analysis of key types of strategies and found evidence that personal mitigation behaviors (e.g., masking, physical distancing) were more strongly associated with decreased transmission than policies. While most policies may not be sufficient to control COVID-19 on their own, a combination of policies and communication efforts that promote, support, and reinforce behavior change may be an essential pathway for control. The other most impactful intervention was vaccination, a nationwide intervention that was not available early on but became as important as behavior modification for controlling transmission in most jurisdictions by mid to late 2021 (29). Importantly, at all time points, transmission was reduced not by a single measure, but by various layered measures indicating that no single measure is likely to control SARS-CoV-2 on its own. Even with high rates of post-infection immunity or vaccination, behavior change (e.g., mask use, physical distancing) may be needed to control transmission. These findings demonstrate the complexity of the COVID-19 response and SARS-CoV-2 transmission and illustrate the ongoing importance of layered mitigation approaches integrated across the public health, government, and communities.
Materials and Methods
Experimental Design
We sought to measure the association between Rt and time-varying COVID-19 mitigation policies. To accomplish this, we first modeled Rt from September 6, 2020 to November 27, 2021 (64 weeks) in fifty-one jurisdictions (all US states and DC). We then modeled the association between jurisdiction-specific Rt and policies using Bayesian hierarchical models, explicitly adjusting for factors that directly or indirectly affect or modify community transmission, including personal COVID-19 mitigation behaviors, the circulation of key SARS-CoV-2 variants, weather data, indicators of immunity, and COVID-19 vulnerability indicators.
The analysis period was selected based on the availability of data. U.S. territories and affiliated jurisdictions were excluded from the analysis as equivalent data for policies, behaviors, SARS-CoV-2 variants, immunity, and vulnerability were not available.
COVID-19 Time-varying Reproduction Number Estimation
We estimated Rt, a weekly measure of real-time transmission in each US jurisdiction, using COVID-19 case data reported to the Centers for Disease Control and Prevention (CDC). For each reported case, an onset date was sampled from the time-specific onset-to-report delays distribution in the national line list data set. To estimate Rt, onset dates were back projected from case report dates using time-specific delays; infection dates were sampled using a log-normal distribution for the incubation periods [log mean = 1.63 and log standard deviation = 0.5 based on published data (44)]. We then generated 10 bootstrapped samples of each jurisdictional time series using a centered 14-day moving window to account for variability in daily reporting when estimating Rt. Finally, for each trajectory we estimated Rt using the methods described in Cori et al (45). We used a 7-day window and an uncertain serial interval (SI) (mean: 5 days, standard deviation: 1 day), with 5 samples from the SI distribution and 5 samples of the Rt posterior for each SI value (46). We thus generated 250 Rt samples for each time point and jurisdiction and used the mean estimate on each Wednesday as the outcome for subsequent analyses.
Covariate data
We included data on mitigation policies, personal mitigation behaviors, the circulation of key variants, weather, indicators of immunity, and vulnerability indicators described below and in the Supplemental Text. We assessed correlation between covariates by estimating the median pairwise R2 with bivariate regression models (see Supplement 1).
COVID-19 mitigation policies
Standardized policy data were obtained from the Oxford COVID-19 Government Response Tracker (47). The dataset includes a composite indicator (OSI) of the overall strictness of COVID-19 policies and strength of pandemic-related communication (details in Supplement 1). We used a smoothed, daily time series of jurisdiction-level OSI, rescaled the values to range from 0 to 1, and calculated a jurisdictional weekly mean.
We also used jurisdiction-level time series for three individual policies included in the OSI indicator (cancellation of public events, restrictions on gathering sizes, and stay at home orders) and mask mandates from the Oxford COVID-19 Government Response Tracker (not included in OSI). We chose to examine these four policies because they were commonly implemented across the United States and represented key, distinct mitigation measures. We dichotomized all policy variables into the strictest policy versus all other implementations/no policy. Data management processes for these data are described in the Supplemental Text.
Personal COVID-19 mitigation behaviors
Jurisdiction-level, personal behavior data were collected from a variety of sources. Self-reported mask use in public (previous 5 or 7 days) and attendance at gatherings (in the past 24 hours) were collected from the COVID-19 Trends and Impact Survey of Facebook users (48, 49) (See Supplemental Figure 2); mobility data were collected from Google’s COVID-19 Community Mobility Reports (50); and national travel estimates were collected from the Transportation Security Administration (51). From the Community Mobility Report data, we included the proportional reduction in weekly median mobility to retail and recreation locations relative to baseline mobility from January 3-February 6, 2020. We also included the weekly median reduction in national airline travel relative to maximum weekly travel in 2019. We set the reference to the maximum weekly travel in 2019 to ease interpretation of the coefficients in the final model.
Circulation of key SARS-CoV-2 variants
We estimated the weekly proportion of Alpha (B.1.1.7) and Delta (B.1.617.2) SARS-CoV-2 variants in circulation by fitting sequence data to a multinomial logistic regression model, which included normalized survey weights to account for reporting patterns within and between jurisdictions (52).
Weather data
We pulled temperature (°C) data from weather stations included in the National Oceanic and Atmospheric Administration’s Integrated Surface Database (53), using the package “worldmet” (54). From station level data, we calculated the weekly median temperature in each jurisdiction. Given the role of humidity in respiratory virus transmission (55, 56), we also assessed associations with relative humidity and absolute humidity to guide our modeling (Supplemental Figure 3).
Indicators of immunity
We included infection-acquired and vaccine-derived immunity to SARS-CoV-2 indicators in our models. As a proxy measure of infection-acquired immunity, we modeled jurisdiction-level seroprevalence, adjusting estimates for reduced percent of positive assays based on waning immunity using methods described by García-Carreras and colleagues using data from national SARS-CoV2 serosurveys (57). For vaccination, we used the weekly jurisdictional percentage of individuals with a completed primary series of COVID-19 vaccine (58).
COVID-19 vulnerability indicators
We included variables that represent static underlying components that influence transmission, which were developed as part of the CCVI (59) and range from 0 to 1 across all jurisdictions: 1) Racial and Ethnic Diversity 2) Percentage of Population Working or Living in Environments with High COVID-19 Infection Risk, 3) Socioeconomic Status, 4) Housing type, Transportation, Household Composition and Disability, and 5) Population Density (see Supplemental Figure 4 for Pearson correlation coefficients for CCVI indicators, and Supplemental Figure 5 for spatial distribution and correlation with time-varying covariates).
Statistical Analysis
We assessed the association between Rt and selected determinants with Bayesian Gaussian multi-level regression models, using a log-link function and jurisdiction- and time-specific intercepts (as random effects to account for spatiotemporal autocorrelation). We assessed two models. The first focused on general government response, using the overall OSI. The second model focused on the impact of the four individual policies: cancelation of public events, restrictions on gathering sizes, stay at home orders, and mask mandates. Both models were adjusted for the aforementioned covariates (Supplemental Text for model statements). For each model, we ran four Markov chains at 2,500 iterations each, with a burn in period of 1,250 iterations. We specified priors for an expected negative association for all components likely to decrease transmission (OSI, all individual mitigation policies, mobility, masking, reduced airline travel, cumulative COVID-19 cases, vaccination, and temperature) or expected positive association for those which may increase transmission (variants and each CCVI indicator). Priors were specified on the log-scale. For each coefficient with an expected negative association, we used a normal distribution with a mean of -0.7 and standard deviation of 0.1, approximating a 50% decrease with a 95% CI of 40-60%. We used a normal prior with a mean of 0.4 and a standard deviation of 0.1 for covariates with expected positive associations, approximating a 50% increase with a 95% CI of 20-80%. The intercept prior had a normal distribution with a mean of 1.1 and standard deviation of 0.1, reflecting an expected Rt without any mitigation behaviors or policies from 2.5 to 3.7 (95% CI). Model convergence was assessed using the Gelman-Rubin convergence diagnostic  and model fit was evaluated from the predictive posteriors. Jurisdiction-specific results for the OSI model are presented in Supplemental Figure 7.
We conducted several sensitivity analyses. First, we compared these models to the same two models with naïve priors via leave-one-out (LOO) cross-validation (60) (Supplemental Figures 6) and compared models with different structures for temporal correlation (Supplemental Figures 8). Second, we re-ran the primary models using publicly available Rt estimates from the Centre for Mathematical Modeling of Infectious Diseases COVID modelling group (61) and compared the model results to those presented here (Supplemental Figures 9). Third, we re-ran the individual policy model without the behavior covariates (Supplemental Figures 10).
Analyses were conducted using R (version 4.2.1), with the rstanarm package used for primary analyses. R code is available in a public repository (https://github.com/cdcepi/COVID-19-Mitigation_Rt).
This activity was reviewed by CDC and was conducted consistent with applicable federal law and CDC policy1§.
CDC disclaimer
The findings and conclusions in this report are those of the authors and do not necessarily represent the official position of the U.S. Centers for Disease Control and Prevention.
Data Availability
All data produced in the present work are contained in the manuscript
Funding
None.
Author contributions
Conceptualization: VKL, MAJ
Methodology: VKL, MAJ, SK, JMH
Investigation: VKL, SK, PVP, TC
Visualization: VKL
Supervision: MAJ, RSB, MB
Writing—original draft: VKL
Writing—review & editing: VKL, SK, PVP, TC, BLC, JMH, RBS, MB, MAJ
Competing interests
All other authors declare they have no competing interests.
Data and materials availability
All data are available in the main text or the supplementary materials. COVID-19 case data are available upon request at https://data.cdc.gov/Case-Surveillance/COVID-19-Case-Surveillance-Restricted-Access-Detai/mbd7-r32t. All other data are in the public domain and referenced in the Supplemental Text. R code is available in a public repository (https://github.com/cdcepi/COVID-19-Mitigation_Rt).
Acknowledgments
This research is based on survey results from Carnegie Mellon University’s Delphi Group. Thank you to Prabasaj Paul for his thoughtful comments and review of this manuscript.
Footnotes
↵1§ See e.g., 45 C.F.R. part 46, 21 C.F.R. part 56; 42 U.S.C. §241(d); 5 U.S.C. §552a; 44 U.S.C. §3501 et seq.
References


