
ABSTRACT
Over three percent of people carry a dominant pathogenic mutation, yet only a fraction of carriers develop disease (incomplete penetrance), and phenotypes from mutations in the same gene range from mild to severe (variable expressivity). Here, we investigate underlying mechanisms for this heterogeneity: variable variant effect sizes, carrier polygenic backgrounds, and modulation of carrier effect by genetic background (epistasis). We leveraged exomes and clinical phenotypes from the UK Biobank and the Mt. Sinai BioMe Biobank to identify carriers of pathogenic variants affecting cardiometabolic traits. We employed recently developed methods to study these cohorts, observing strong statistical support and clinical translational potential for all three mechanisms of variable penetrance and expressivity. For example, scores from our recent model of variant pathogenicity were tightly correlated with phenotype amongst clinical variant carriers, they predicted effects of variants of unknown significance, and they distinguished gain- from loss-of-function variants. We also found that polygenic scores predicted phenotypes amongst pathogenic carriers and that epistatic effects can exceed main carrier effects by an order of magnitude.
INTRODUCTION
With the rapidly increasing use of exome sequencing in clinical practice, and with over three percent of the population carrying a pathogenic variant in genes associated with autosomal dominant disease, predicting which carriers will develop disease (penetrance) and how that disease will manifest (expressivity) are central questions for the practice of genomic medicine (Figure 1A).1–5 Addressing the full spectrum of clinical genotypes associated with liability to diseases would improve preventative and targeted approaches prior to disease onset. However, the causes of incomplete penetrance and variable expressivity are largely unknown, making it difficult to determine which patients will require clinical interventions and what degree of intervention will be needed.5,6 In this study, we examine three potential sources of this heterogeneity in the context of clinical metabolic traits: differing pathogenic variant effects within a gene, variable polygenic background amongst carriers, and genetic epistasis modifying the impact of carrier effects (Figure 1B).

(A) We illustrate “penetrance” and “expressivity” with this cartoon. “Penetrance” is the fraction of carriers with disease and “expressivity” is the severity of the phenotype within carriers. (B) Our study focuses on three potential genetic factors that cause incomplete penetrance and variable expressivity: heterogeneous effect sizes of pathogenic variants, polygenic background, and genetic epistasis.
Mounting evidence suggests that each of these factors contribute to incomplete penetrance and variable expressivity. For example, loss-of-function (LOF) variants within the MC4R gene cause monogenic obesity; however, other missense variants in the same gene that are gain-of-function (GOF) are associated with protection against obesity.7 Recently, Goodrich, et al.4 and Fahed, et al.8 found that polygenic risk scores (PRS) are associated with phenotype amongst carriers in several monogenic diseases. Finally, case reports have identified direct genetic epistatic modifiers that are protective in highly penetrant monogenic disorders.9 Here, we employ recently developed statistical genomics methods in combination with phenotypes and exomes from 200,638 UK Biobank (UKB)10 participants (Table 1), as well as 28,817 participants from the Mt. Sinai BioMe Biobank11, to comprehensively study these factors in genes with mutations known to affect several cardiometabolic traits: high LDL cholesterol or familial hypercholesterolemia, low LDL cholesterol or familial hypobetalipoproteinemia, high HDL cholesterol or familial hyperalphalipoproteinemia, high triglycerides or familial hypertriglyceridemia, monogenic obesity, and mature-onset diabetes of the young (MODY) (Table 2).
Summary statistics of participant background and phenotypic distributions for the studied cardiometabolic traits.
Autosomal dominant pathogenic clinical variants that affect cardiometabolic traits were previously curated across listed monogenic genes. Pathogenic variants were grouped by the associated monogenic disorder; the minimum and maximum allele frequency of these variants in gnomAD exomes are reported, as is the total number of pathogenic variant carriers identified in the UKB.
First, to study effect size heterogeneity, we leverage our recently developed method for variant pathogenicity prediction based on the ESM1b protein language model.12 The effect sizes of rare missense variants within protein-coding genes are often classified as variants of uncertain significance (VUS), or grouped into coarse categories such as “pathogenic” or “benign”.5 This critically limits studies of effect size heterogeneity as well as the prognostic power of genomic medicine for many patients.13 Our model produces numerical scores for any possible amino acid change in any protein, which we demonstrate are tightly coupled to phenotype for many genes.
Next, to examine polygenic background, we employ polygenic risk scores (PRS), which combine variant effects from genome-wide association (GWAS) study loci, to measure a person’s comprehensive genetic load for the phenotypes included in this study.14 We improve upon previous studies by binning individuals into finer-grained PRS quantiles to identify the threshold at which PRS-risk exceeds that of established clinical, pathogenic variants.
Finally, we employ our recent method, FAst Marginal Epistasis test (FAME), that quantifies the impact of genetic epistasis on modification of individual variant’s effects.15 With this method, we previously showed that genetic background modifies the effect of many common GWAS variants, with epistatic effects sometimes exceeding marginal effects by an order of magnitude across diverse traits. Here, we extend this work to study the impact of epistasis on autosomal dominant rare variants.
We find that the variant effect heterogeneity, polygenic risk, and genetic epistasis all contribute to phenotype expressivity and penetrance in these traits. Importantly, a variant’s ESM1b scores are predictive of phenotype expression in six out of ten monogenic genes (Table 2) included in this study. ESM1b outperforms other existing variant prediction methods, even for variants at rare allele frequencies. Furthermore, we show for the first time that our score differentiates between GOF and LOF missense variants. These results indicate that contemporary variant pathogenicity prediction methods may be able to move beyond binary pathogenic/benign classification to provide more nuanced prognoses. In our PRS analyses, we find that the upper quantiles of risk often exceed the effect size of clinical variants, further supporting translational utility of PRS. Moreover in carriers, PRS was significantly associated with phenotype for four of the six monogenic diseases examined in this study, demonstrating that polygenic background underlies components of penetrance and expressivity. Finally, we show that genetic epistasis significantly modifies carrier phenotype in carriers of high triglycerides, high LDL, and MODY variants, and that inclusion of epistasis in prediction of carrier phenotype could improve predictive accuracy by as much as 170%.
METHODS
Cohort information
200,632 participants with exomes in UKB were included to identify the number of carriers and the penetrances of the monogenic diseases in this study. We restricted PRS and genetic epistasis analyses to individuals of similar genetic ancestry who are unrelated. Field 22006 was used to identify individuals who self-identify as White British and have similar genetic ancestry. To identify unrelated individuals, common array SNPs were extracted from individuals, KING16 kinship coefficients were estimated, and individuals were pruned to the third degree of kinship. All individuals with exomes available were included in the missense variant analysis. Information about phenotype curation is provided in Supplemental Methods.
Gene and variant list curation
There are several terms used interchangeably to describe variants that have high effect and are associated with monogenic disease (e.g., “pathogenic”, “monogenic”, “clinical”). We focus on pathogenic variants as defined by ACMG/AMP criteria.17 We examined pathogenic variants for monogenic forms of low LDL (PCSK9, APOB), high LDL (LDLR, APOB), high HDL (CETP), high triglycerides (APOA5, LPL), monogenic obesity (MC4R), MODY (GCK, HNF1A, HNF4A) curated in Goodrich et. al4 and Mirashahi, et al18 (Table 2). We consider several classes of variants to identify monogenic variant carriers: “curated”, where variants undergo stringent review to be considered pathogenic; “ClinVar-weak”, where variants have at least one submission of likely pathogenic or pathogenic, but may also contain conflicting reviews in the ClinVar database19; and “ClinVar-strong”, where variants have only likely pathogenic or pathogenic submissions. Variants that did not fall under “ClinVar-strong” or “curated” categories were considered to have unknown effect as variants of uncertain significance (VUS).
“Curated” monogenic variants were identified by Goodrich et. al4 by applying ACMG/AMP criteria and blinded testing by reviewers for variant curation. Curated variants from Mirashahi, et al.18 were identified with the following protocols. Rare protein-truncating variants in HNF1A, HNF4A, and GCK outside of the last exon of each gene were classified as pathogenic due to haploinsufficiency of these genes is sufficient to cause disease. Missense variants within these genes were also identified as pathogenic for MODY if the missense variants were classified as likely pathogenic/pathogenic by ACMG/AMP guideline, were rare (minor allele frequency, MAF<1.4E-05), and were also subjected to blinded manual review. ClinVar variants were identified based on the “CLIN_SIG” field from the Variant Effect Predictor (VEP).20
Exome sequencing quality control and variant filtering
UKB exome-sequencing and analysis protocols were published in Szustakowski et al.21 and are also displayed at https://biobank.ctsu.ox.ac.uk/showcase/label.cgi?id=170. Exome variants were called in monogenic disease genes by using PLINK version 1.9 function extract on UKB exome PLINK files.22 Anyone carrying at least one pathogenic variant was identified as a “carrier”; otherwise, those not carrying pathogenic variants were labeled as “non-carriers”. All variants were annotated using Variant Effect Predictor (VEP) version 10720 in GRCh38.
Penetrance calculations
We define penetrance to be the proportion of carriers that meet certain disease or phenotype thresholds based on previous studies. In MODY carriers, penetrance was based on how many carriers were pre-diabetic. For the other monogenic disorders, the following cutoffs were used to calculate penetrance: high LDL or familial hypercholesterolemia - direct LDL greater or equal to 190 mg/dl23, low LDL or familial hypobetalipoproteinemia - direct LDL less than or equal to 80 mg/dl24, high HDL or familial hyperalphalipoproteinemia - direct HDL greater than or equal to 70 mg/dl25, high triglycerides or familial hypertriglyceridemia - direct triglycerides greater than or equal to 200 mg/dl23, and monogenic obesity - obese BMI (BMI greater or equal to 30 kg/m2.)
Missense variant pathogenicity prediction scores
ESM1b is a protein language model that was previously trained on human protein amino acid sequences and generates a score for single amino acid changes (missense variants).12 This model does not take into account genetic changes that result in a truncated protein. The ESM1b model was used to calculate the scores for any single amino acid change for the protein resulting from the canonical transcript of the monogenic disease genes included in this study. Here, we define the canonical transcript to be the longest known mRNA transcript for each gene. Using the predicted protein change of the genetic variant effect generated by VEP, we compared the ESM1b scores for every potential missense variant of established cardiometabolic disease genes to the phenotypes of carriers for those missense variants.
We tested if ESM1b predicts mean phenotype of carriers of the same missense variants for all genes included in this study, restricting this analysis to single missense variant carriers from any ancestry. We define single missense variant carriers as individuals with one missense variant in the gene, and any other gene variation is restricted to intronic, synonymous, or untranslated region effects. Single missense variant carriers were grouped by the missense variant carried, mean phenotype of this group was measured and associated with the missense variant’s ESM1b score. We then identified significant Pearson correlations between mean phenotype and ESM1b score via correlation testing; to account for covariates, we regressed age, sex, and the first 10 genetic PCs from the phenotype and then used the remaining residuals to test for correlation with ESM1b values.
Polygenic risk scores (PRS)
PRS weights for BMI were previously generated using LDpred26 and were downloaded from Cardiovascular Disease KP Datasets on Feb 10, 2022. PRS weights for LDL were previously generated using PRS-CS27 and were downloaded Feb 22, 2022 from the Global Lipids Genetics Consortium Results. PRS weights for HDL and triglycerides were previously generated using PRS-CS28 and downloaded from the PRS Catalog29 on May 6, 2022. PRS weights for T2D were previously generated using LDpred30 and were downloaded from the PRS Catalog on May 29, 2023. PRSs were then calculated for every UKB participant of European ancestry within UKB using PLINK version 2.0 function score. Scores were then centered and scaled to have a mean of 0 and standard deviation of 1. All PRS weights chosen excluded UKB participants in generation of GWAS training data.
Testing for genetic epistasis occurring between genetic background and monogenic genes
Testing for genetic epistasis, or gene-by-gene interactions, is a challenging task that is computationally expensive to scale to large datasets like biobanks. FAst Marginal Epistasis Estimation (FAME) is a scalable method that tests the marginal epistasis of a target feature on a trait.15 It jointly estimates the variance explained by the additive component (σG2) and by the marginal epistasis component (σGxG2), where the marginal epistasis is defined as the pairwise interaction between the target feature and all other SNPs of interest. The algorithm is based on a streaming randomized method-of-moments estimator that has a linear computational time to the feature dimension and a sub-linear computation on the sample size.31 FAME requires the input information of the target feature (Xt), and all the other features that potentially interact with the target feature (X-t). We modify the method so that target feature Xt becomes a binary carrier status indicator variable, and X-t are all the SNPs in the whole-exome sequencing data except the gene block region corresponding to the target monogenic disease.
When we estimated the marginal epistasis effect of the pathogenic variants, we first excluded its additive effect together with the other covariates (top 20 PCs, sex, and age). Then we applied FAME to jointly estimate the additive SNP effect and the marginal epistasis effect on 300K quality-controlled unrelated White-British UKB individuals.
RESULTS
Incomplete penetrance and variable expressivity of monogenic CMT variants
To establish the full spectrum of genetic contributions to “monogenic” diseases, we sought to determine the penetrance and expressivity across a subset of cardiometabolic traits within the UK Biobank (UKB). Cardiometabolic traits are pervasive quantitative phenotypes available within electronic health record (EHR) systems and have been previously associated with rare monogenic variants and common genetic variation. In the UKB, we identified a total of 1,356 carriers of monogenic variant carriers that affect cardiometabolic phenotypes (Table 2) and established that the penetrance for disease within these carriers is higher, but incomplete compared to noncarriers using current clinical thresholds defined in the Supplemental Methods (Figure 2A). The monogenic trait with the highest penetrance was high triglycerides, where 56.10% (115/205) of carriers had triglycerides levels greater than 200 mg/dl; the monogenic trait with the lowest penetrance was low LDL, where 42.28% (137/324) carriers had LDL levels less than 80 mg/dl.

(A) Penetrance thresholds were defined based on clinical definitions of disease. Relative to noncarriers (blue), carriers (pink) have higher penetrances (95% confidence intervals) for disease across all cardiomet-abolic phenotypes included in this study. Carriers also show incomplete penetrance of disease across all monogenic disorders. (B) Within pathogenic variant carriers, the distributions of phenotypes vary, consistent with variable expres-sivity.
Penetrance is also dependent on the gene that the variant was carried in; for example, penetrance of low LDL pathogenic variants (LDL<80 mg/dl) overall was 42.28%, but was only 12.89% (21/163) in PCSK9 pathogenic variants compared to 72.05% (116/161) in APOB pathogenic variants. Concomitantly, underlying phenotypes are variable amongst variant carriers of different genes (Figure 2B). GCK MODY carriers have a narrower range of HbA1c, a measurement of blood glucose concentration32, in comparison to HNF1A and HNF4A MODY carriers who have a wider range of values. Across traits and genes, this diversity of variant effect spans negligible to clinically actionable. We therefore examine the underlying factors that affect this incomplete penetrance and variable expressivity.
Expressivity of monogenic missense variants is predicted by ESM1b scores
We first consider the possibility that effect size heterogeneity across amino acid changing variants within a gene contributes to phenotypic heterogeneity of known autosomal dominant cardiometabolic traits (Table 2). Specifically, we employed ESM1b derived protein language scores12 to predict the pathogenicity of known clinical pathogenic missense variants as well as VUSs across the 10 genes considered in this study. ESM1b defines likely pathogenic missense variants with a score less than −7.5.33 While we and others have previously shown that variant pathogenicity predictors can help classify variants as pathogenic versus benign33,34, we find that ESM1b predicts the mean phenotype of missense variant carriers with p<0.05 for six of the ten genes considered (Figure 3; binomial enrichment p=2.76E-06). Two of these gene ESM1b-mean phenotype correlations are remarkably strong with correlations exceeding 0.25 and are significant after Bonferroni correction. Filtering to rarer variants further increases predictive power; an additional gene ESM1b-mean phenotype gains significance after filtering for rarer variants (Table S2).

Single missense variant carriers for MC4R (A & B), LDLR (B), PCSK9 (C), APOA5 (E), LPL (F), and GCK (G) were identified and mean phenotype per each missense carrier group was measured. Pearson correlations between mean phenotype and ESM1b scores are reported after regressing out age, sex, and first 10 genetic PCs from phenotype. ESM1b scores distinguish gain-from loss-of-function MC4R missense variants in UKB (A) and replicate in Mt. Sinai’s BioMe biobank (B).
We first explored MC4R, a single exon gene where missense variants have either LOF or GOF effects7 leading to either monogenic obesity or protection from obesity, respectively. We identified carriers of both curated4,18 and ClinVar-strong missense variants and quantified the association of these variants with their ESM1b scores. We found that ESM1b scores of these known pathogenic missense variants are significantly associated with carrier BMI after adjusting for age, sex, and the first 10 genetic PCs in UKB (Pearson r=-0.47, p=0.034). ESM1b also predicts phenotype in carriers of missense VUS (Figure 3A), allowing for more accurate classification in the absence of molecular functional data. We extended our analysis to 14,135 individuals in UKB harboring a single missense variant in MC4R (134 unique missense variants). ESM1b score was significantly correlated with mean BMI of corresponding carriers after adjusting for covariates (r=-0.29, p=8.76E-08). Finally, we found that ESM1b separates MC4R GOF (pink) from LOF (navy) missense variants (Figure 3A); (t-test p=1.42E-04). We replicated these results in an ancestrally diverse cohort of patients from the BioMe biobank (Figure 3B). In 1,456 individuals that carry a single MC4R missense variant out of a total 28,817 individuals, ESM1b was significantly correlated with mean BMI (r=-0.23, p=0.036).
We next examined ESM1b scores for LDLR and PCSK9 missense variants in relationship to LDL levels (Figure 3C & 3D). LDLR encodes for the LDL receptor; pathogenic/LOF variants account for 90% of monogenic high LDL cases35 and disrupt LDLR’s ability to remove LDL from the bloodstream leading to elevated LDL blood levels.24 The ESM1b scores of known pathogenic missense variants are significantly associated with LDL after adjusting for age, sex, and first 10 genetic PCs (n=298, r=-0.46, p=1.28E-3). ESM1b accurately classifies the curated missense LOF variants (navy, Figure 3C) as likely pathogenic; 23/24 (95.83%) had an ESM1b score<-7.5. Interestingly, the remaining pathogenic missense variant, with a score>-7.5, also had lower LDL levels compared to the other pathogenic missense variants. ESM1b was also able to predict phenotype in carriers of LDLR missense VUSs. In all 21,362 individuals carrying a single missense LDLR variant, representing 346 unique missense variants, ESM1b was significantly correlated with mean LDL (Pearson r=-0.49, p=9.59E-22, Figure 3C). We observed similar significant correlations between PCSK9 missense variants and LDL levels, but in the opposite direction (r=0.20, p=0.018, Figure 3D). Interestingly, there was no significant difference in LDL levels of carriers reported36 PCSK9 GOF and LOF variants (Figure S2), highlighting complexities in reporting based on existing annotations.37,38
Similar associations between ESM1b pathogenicity scores and phenotype were found in known clinical and VUS missense variants for additional genes and traits. APOA5 and LPL LOF variants are associated with hypertriglyceridemia yet few missense variants are associated with these clinical phenotypes. We found that ESM1b scores are a predictor of triglyceride levels in missense variant carriers of both APOA5 (r=-0.19, p=0.015) and LPL (r=-0.19, p=0.013). ESM1b scores also predicted HbA1c levels in GCK single missense variant carriers. GCK encodes for glucokinase, an enzyme that regulates insulin secretion.39 Variation in GCK has been associated with both hyperglycemia and hypoglycemia.40 ESM1b predicted the mean HbA1c levels of 401 single GCK missense variant carriers in Figure 3G (r=-0.29, p=7.7E-03).
We repeated these analyses using SIFT41, CADD42, PolyPhen243, PrimateAI44, and EVE45 scores and found that these methods do not classify the pathogenic missense variants as accurately as ESM1b, show weaker correlations between variant score and mean BMI compared to ESM1b, and do not differentiate between GOF and LOF missense variants (Figure S1, Table S1). We also found that ESM1b scores remain predictive of carrier phenotype at missense mutations with small allele frequencies (Table S2). Collectively, these results suggest that effect sizes of clinical variants within a gene are heterogeneous and therefore contribute to variability in penetrance and expressivity. They also indicate that ESM1b has the potential to reclassify thousands of variants that have conflicting classifications or are of uncertain significance.
Polygenic background in carriers and non-carriers of pathogenic variants
Phenotypic heterogeneity exists even amongst carriers of the same genetic variant. We therefore hypothesized that the common genetic variants spread throughout the genome (polygenic background) could affect carrier phenotype independently of pathogenic variant effects. To evaluate this hypothesis we leveraged polygenic risk scores (PRS), a weighted sum of common variant effects with weights determined by results from GWASs.46 PRSs for hundreds of traits have been widely studied, many are strongly correlated with complex traits, and there is ongoing evaluation for clinical translational potential.47 Here we computed PRS for each trait of interest (Table 2), restricting to the unrelated white British population to reduce confounding from population structure48 (see Methods).
Consistent with previous studies, we confirm that each PRS was significantly correlated with the corresponding traits (Figure 4). Then, to compare polygenic and monogenic risk, we contrast the phenotypes of noncarriers within the tails of 1000th-tiles (0.1%) bins of the PRS to the phenotypes of pathogenic variant carriers. We first replicate a previous finding4 that individuals within the tails of the obesity PRS have a more extreme phenotypic expression than pathogenic variant carriers for monogenic obesity. We then test the remaining phenotypes and find that individuals in the tails of PRS for HDL and triglycerides have phenotypes larger than those of known clinical variant carriers (Figure 4A, 4B, and 4C). Across all three traits we observe that hundreds to thousands of individuals have a polygenic load that results in a more extreme phenotype than currently reported clinical variants. Exact PRS thresholds at which non-carrier phenotypes exceed those of carriers are reported in Table S3 and are denoted in red in Figure 4. These findings replicate that individuals within the tails of PRSs are at equivalent or greater risk of disease than pathogenic variant carriers.4,49 While individuals in the tails of the current LDL and Type 2 Diabetes (T2D) PRS do not have phenotypes exceeding those of clinical variant carriers, this will likely change as PRS become more accurate and larger cohorts are studied.

Europeans without pathogenic variants were ordered by PRS, and then binned into 1000 quantiles for each trait: BMI (A), HDL (B), triglycerides (C), LDL (D), and T2D (E). Pathogenic variants were aggregat-ed into four groups: Curated - an expert curated set of pathogenic variants; ClinVar-weak - variants with ClinVar likely pathogenic/pathogenic reports with additional conflicting reports; ClinVar-strong - variants with ClinVar reports of only likely pathogenic/pathogenic; VUS with an ESM1b score less than −7.5 - additionally predicted patho-genic variants from ESM1b. We plot phenotypes (mean phenotype and 95% confidence intervals) of each carrier group as well as each PRS quantile; quantiles exceeding the curated variant phenotype are denoted in red. Individu-als in these upper PRS quantiles have more extreme phenotypes than carriers of currently reported clinical pathogenic variants.
We examined several different sets of potentially pathogenic variants when making these comparisons: a curated set of variants, ClinVar-weak/strong annotations, and VUSs with ESM1b scores exceeding the recommended pathogenicity threshold of −7.5 (see Methods). For all traits examined, the curated variants had the most extreme phenotypes while carriers of ClinVar’s current set of weak and strong variants often had substantially more moderate phenotypes (Figure 4B, 4C, and 4E). ClinVar variants for LDL did not distinguish between high or low LDL effects and therefore were not included in Figure 4D. We found that ESM1b could be used to identify additional pathogenic variants: ESM1b annotated pathogenic VUS missense variants had phenotypes equivalent to or more severe than ClinVar variant carriers for some genes (Figure 4A and 4C).
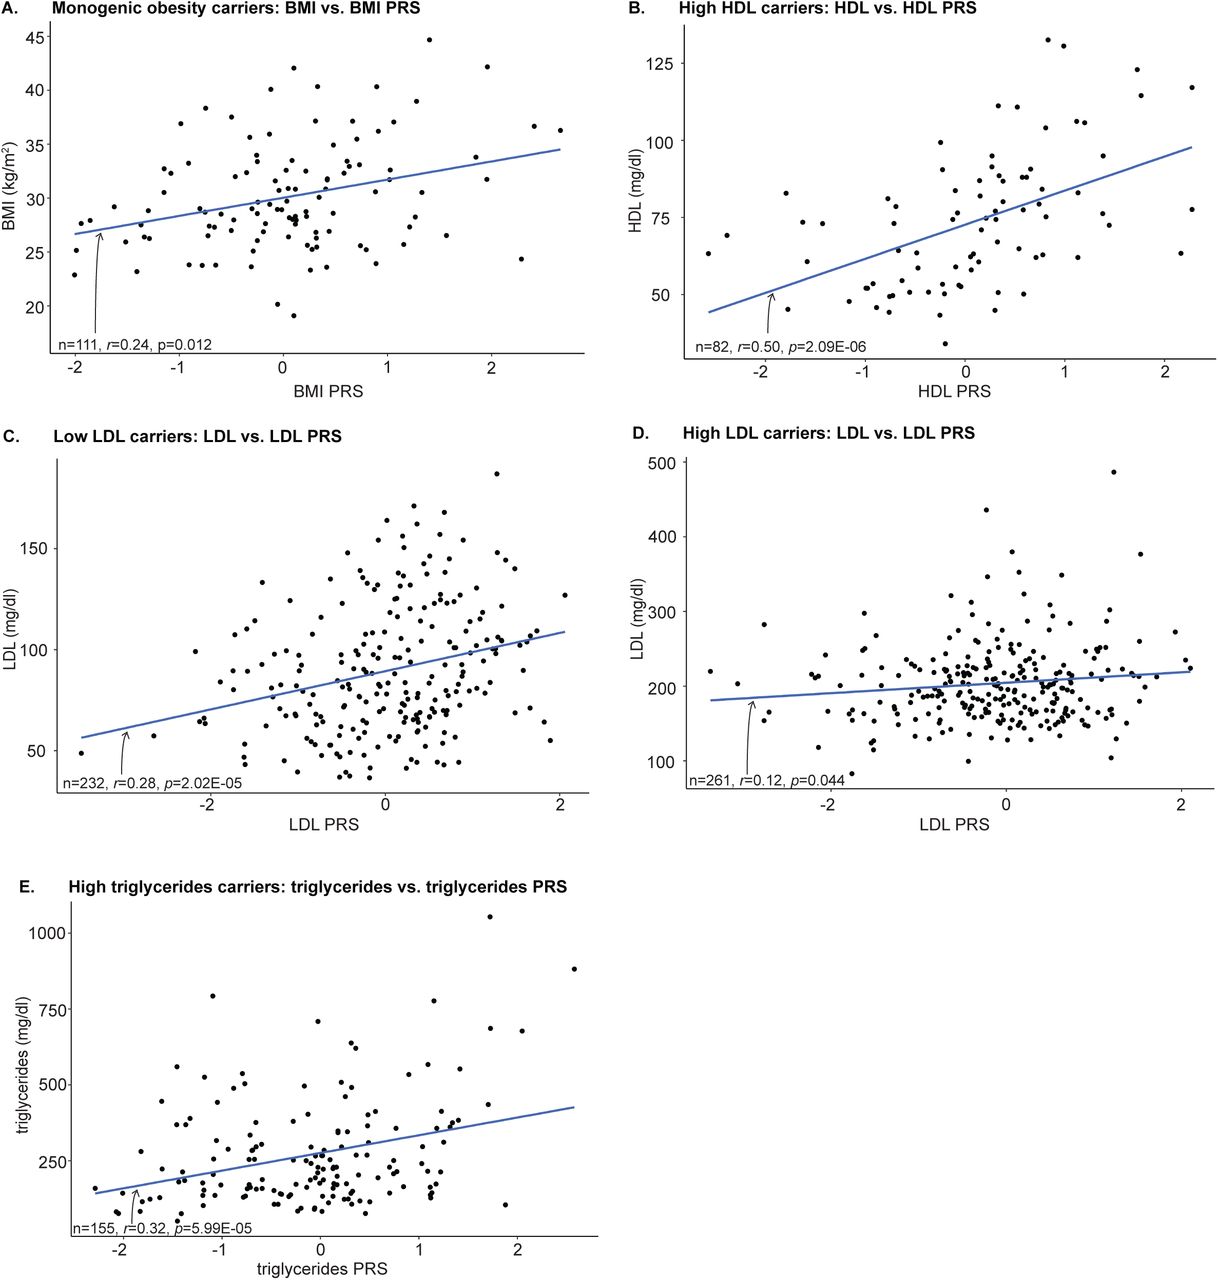
Finally, we examined the impact of polygenic background in carriers of clinical variants for cardiometabolic disease. Studies of other traits have reported correlations between PRS and phenotypes amongst rare monogenic disease variant carriers8,50–52. In monogenic forms of cardiometabolic disease, this association has not been established due to insufficient sample size.4 Here we found that carrier phenotype was significantly associated (Bonferroni-corrected, one-tail p-value<0.01) with carrier PRS while adjusting for carrier sex, age, and first 10 genetic PCs in monogenic obesity (β=1.68, p=5.60E-03), high HDL (β=9.79, p=1.57E-06), low LDL (β=9.87, p=3.18E-06), and high triglycerides (β=62.46, p=1.33E-05) carriers (Figure 5A, B, C, and E). LDL PRS approached significance in high LDL carriers (β=6.76, p=0.028, Figure 5D). For MODY carriers, we predicted T2D status using a logistic regression including T2D PRS, age, sex, and the first 10 genetic PCs as covariates; the T2D PRS covariate was not significant (β=0.44, p=0.15). The PRS covariate for all sets of monogenic carriers is positive, indicating that the higher the carrier PRS is, the larger the value of the carrier phenotype. Across all traits, our results imply that polygenic background is a source of incomplete penetrance and variable expressivity. They also suggest that PRS may eventually have clinical utility for refining prognoses amongst monogenic variant carriers.

PRS scores for carriers of European genetic ancestry predicted carrier phenotype after adjusting for sex, age, and first 10 genetic PCs: (A) BMI (PRS β=1.68, p=5.60E-03), (B) high HDL (HDL PRS β=9.79, p=1.57E-06), (C) low LDL (β=9.87, p=3.18E-06), (D) high LDL (β=6.76, p=0.028), and (E) high triglycerides (β=62.46, p=1.33E-05). Pearson correlation test results are reported on each plot.
Epistasis between genetic background and monogenic genes alters phenotype
We next sought to evaluate the possibility that genetic background magnifies or diminishes the effect size of the pathogenic variants through epistasis.9,53–55 We previously tested for variant-background epistasis through interaction tests between carrier status and PRS4, but this test is underpowered and the addition of more samples did not result in more significant interactions (Table S4, Supplemental Methods). We therefore employed a novel mixed model based approach (FAME)15, which estimates the total contribution to phenotypic variance from polygenic background (σG2), carrier status (□C2), their interaction (σCxG2), and environmental noise (σε2). This allowed us to conduct the first well-powered examination of the impact of epistasis on penetrance and expressivity.
σG2 represents the theoretical upper limit of polygenic risk score accuracy for each trait, while □C2 and σCxG2 are determined by pathogenic effect size and total epistatic effect sizes respectively. Here we compute the epistatic improvement percentage, EIP = σCxG2/σG2*100, which represents the upper bound of improvement in phenotype prediction over carrier status that can be achieved through modeling epistasis. An EIP of 0% means that epistasis is not present, while an EIP of 100% means that the combined epistatic effects are as large as the direct pathogenic variant effects and epistasis is a substantial factor influencing phenotypic variability amongst carriers.
Our analyses revealed widespread statistical evidence of epistasis with large effect sizes; EIP ranged from 48% to 170% amongst the significant associations (Table 3, Table S5). EIP was 170% for LDL cholesterol (interaction p=1.2E-08), implying that an ideal epistatic model would be 1.7 times more accurate in predicting cholesterol compared to using carrier status alone. The fact that EIPs exceed 100% suggest that epistasis is a substantial contributor to variable penetrance and expressivity. These modifications could act through a variety of mechanisms including eQTLs modifying the expression levels of the monogenic gene56, disruptions to enhancer sequences that affect the monogenic gene transcription57, and alternative splicing of proteins that interact with monogenic genes55. Identifying the loci and pathways involved in these epistatic interactions could also reveal opportunities for treatment, e.g. via novel drug targets.
Epistatic interactions between polygenic background variation and carrier status was tested using the FAME method. After adjusting for age, sex, and the first 20 genetic PCs, the interaction term between background variation and carrier status remained significant for carriers of high triglycerides, high LDL, and MODY pathogenic variants. We report the proportion of variance in carrier phenotype explained by genetic epistatsis (σCxG2), carrier status (βC2), and the ratio between σCxG2 and βC2 (epistatic improvement percentage, EIP). EIP represents the potential gain in improvement of carrier phenotype prediction when modeling epistasis.
DISCUSSION
The question of why some monogenic variant carriers have extreme phenotypes while others remain healthy is a fundamental question to clinical genetics. In this study, we established three genetic contributors to incomplete penetrance and variable expressivity of monogenic variants: differing effect sizes of missense variants, genetic background associated with carrier phenotype variability, and genetic epistasis directly modifying carrier phenotype. Our study provides clarity on how rare and common genetic variants can have independent effects on clinical traits and also interact to modulate the severity of the phenotype. Importantly, this work lays a foundation for improved prognostic ability by incorporating complete genomic information in clinical medicine.
There remain a few limitations to our study. Most clinical pipelines define the canonical isoform as the longest protein-coding transcript. However, the cell-type specific isoforms58, the importance of multiple clinically relevant isoforms59 and the ratios of these isoforms60 are understudied areas of variation that can be probed using long-read sequencing technologies. Furthermore, each gene and disease phenotype have different contributions from rare variants and genetic background to an individual’s phenotype requiring large and well-curated data sets across diverse populations to establish the contributors to phenotype expressivity and penetrance.
The measured penetrance of pathogenic variants drifts over time with revisions of screening guidelines or diagnostic thresholds. Like polygenic risk scores, results can vary based on thresholds used to distinguish between healthy and disease states. For cardiometabolic disorders, there are many medications that improve lipid profiles, such as statins61, and our study adjusted for statin-usage and predicted pre-medication LDL and triglyceride levels utilizing coefficients that were previously calculated.62,63 However, there are many different statins and likely each of these have not only dosage-but also genetically-driven responses to drug therapy.64 Finally, newer drugs for obesity and the rise of procedures such as gastric bypass surgery, are artificially reducing BMI and improving lipid profiles65,66 and, over time, may significantly decrease estimates of penetrance and expressivity of metabolic traits.
Clinical expressivity is often used with an alternate definition referring to different phenotypes that arise from individuals carrying the same pathogenic variant. Studying this type of expressivity is essential, but will require a priori knowledge of the full spectrum of the clinical phenotypes possible, a structured database for these phenotypes within a biobank. Even the largest biobanks may be underpowered, particularly when relying on EHRs, where absence of the phenotype in records is not an indication of the patient being unaffected.
Going forward, examination of our findings across diverse global populations is essential, but will require diverse large-scale biobanks with exome sequences and linked clinical phenotypes. While the effect of the isolated pathogenic carrier variants is currently believed to be consistent, we observed that heterogeneity of clinical expression is influenced by genetic background, which may differ between populations. VUS are more common in non-European populations for many disease genes67 and exome sequencing analysis that takes into account diverse genetic backgrounds will help remedy this problem.67,68 Finally, extension into other phenotypes will be most successful for quantitative traits that are measured in the majority of a biobank’s participants. These hurdles will differ between phenotypes assessed and across biobanks.
In addition to providing a means of studying variable penetrance and expressivity, the ESM1b analyses resulted in discoveries with translational potential for the interpretation of clinically observed genomic variants. Integration of precision genome medicine into routine clinical care requires improved variant pathogenicity prediction models. Early methods41,42 show diminished variant pathogenicity prediction accuracy as they rely on an imperfect and underpowered “gold-standard” truth set. Newer methods, such as ESM1b and PrimateAI-3D, are based on unsupervised machine learning and have improved pathogenicity prediction. ESM1b12,33 is a 650 million parameter neural network trained on 250 million protein sequences that predict which variants are pathogenic at higher accuracy than existing variant pathogenicity prediction models, correlates with a continuous spectrum of clinical phenotypes, and is freely accessible online.12,33 Evaluating variant pathogenicity methods via large-scale biobanks allows us to assess the accuracy of these predictors in clinical environments, expanding beyond in vitro functional analysis, and previously published cases that are biased towards the most severe phenotypes. Our results show that ESM1b outperforms other variant pathogenicity predictors in two clinically significant ways: first, it can classify established pathogenic variants and variants across a continuous range of effect sizes, and second, it distinguishes between GOF and LOF missense variants. A previous analysis of rare variation pathogenicity using PrimateAI-3D34 shares some common findings with this study. However, it focused on incorporation of scores to quantify rare variant polygenic risk rather than understanding penetrance and expressivity.69
In summary, our study established real-world estimates of penetrance and expressivity and discovered how genetic background can have outsized effects on modulating rare-variant clinical prediction. It also established a contribution of both rare, monogenic effects and the influence of a polygenic background on the clinical phenotype. Our work highlights the critical importance of the integration of rare and common variants and how these have the power to improve clinical prognosis of genomic precision medicine.
Data Availability
All data produced in the present work are contained in the manuscript
Author Contributions
A.W., N.Z., and V.A.A. conceptualized the project and designed all experimental approaches. A.W.., N.Z. and V.A.A. wrote and edited the manuscript with input from all authors. A.W. performed all computational experiments, curated all data—in addition to supervising and managing all components of this study. R.B. curated the UKB phenotypes and completed QC analyses. N.B. and V.Z. ran the ESM1b model and provided ESM1b scores for missense carrier phenotype analysis. S.S. and B.F. designed and executed all computational analyses related to FAST epistasis analysis. E.E.K provided access to BioMe exomes and S.C. identified single MC4R missense carriers. M.S.U. advised best practices for analyses and contributed to manuscript editing.
Funding
This work was supported by the following funding sources awarded to V.A.A., N.Z, and E.E.K.: R01HG011345. This work was supported by the following funding sources awarded to A.W.: F31HG013462.
Acknowledgements
This research has been conducted using UK Biobank data under application 33127 and is available through the UK Biobank Access Management System http://amsportal.ukbiobank.ac.uk/. Figure 1 generated with BioRender.
Footnotes
updated to author affiliations
REFERENCES


