
Abstract
Purpose To calculate the annual enhanced coverage costs for covering the total and unmet need of cataract in India. To calculate the economic benefits of cataract burden averted. To calculate the net benefits of covering cataract needs.
Setting We look at population-level data of India and its 30 states.
Design This is a retrospective cross-sectional analysis for 2018-19.
Methods We conducted a retrospective cross-sectional analysis for India and its 30 states. Data was taken from Global Burden of Disease 2019, the National Health Profile 2020, and the National Health Accounts 2021. We used ten per-capita surgical costs to calculate enhanced coverage costs. Enhanced coverage costs for the total need were calculated by multiplying prevalence with per-capita costs. For unmet need, the difference between the prevalence and surgeries achieved was used. For economic benefits of averted cataract burden, we multiplied disability-adjusted life-years (DALYs) with non-health GDP per capita, i.e., GDP - the government health expenditure. DALYs for unmet needs were calculated by multiplying DALYs with the ratio of unmet to total needs. For net benefits, we subtracted the enhanced coverage costs for meeting total and unmet needs from economic benefits.
Results The annual enhanced coverage costs for covering total cataract needs in India were 0.92 - 4.9 billion USD. Costs for covering unmet needs were 0.72 - 3.82 billion USD. Nationally, the economic benefit of averting the total cataract disease burden was 12.4 (95%UI: 8.9 - 16.7) billion USD, while the for covering the unmet burden was 9.7 (95%UI: 6.93 - 13) billion USD. Annual net benefits of covering total needs were 7.53 - 11.5 billion USD. Net benefits of covering unmet needs were 5.9 - 9 billion USD.
Conclusion Enhancing coverage for cataract is cost-beneficial.
Introduction
Cataract is the leading cause of curable blindness in India - the most populous country as of 2023.1,2 With a growing elderly population, ailments like cataracts will be on the rise in India. Currently, India runs the National Programme for Control of Blindness and Vision Impairment (NPCBVI) which aims to control cataract blindness. NPCBVI achieves these aims by procuring essential drugs and surgical consumables and providing financial support to government hospitals, private practitioners, non-governmental organizations, and community health workers like Accredited Social Health Activists (ASHAs) via a reimbursement system.3
In 2018, India had a cataract prevalence of 30.34 million.4 However, the National Health Profile (NHP) noted 6.66 million cataract surgeries (22% of the total prevalence).5 NHP has utilized data from the National Program for Control of Blindness. 84 per 100,000 population hospitalizations for cataracts occurred in private settings instead of 41 per 100,000 in public settings.6 The out-of-pocket expenditure (OOPE) for cataract treatment in private health centers was at least three times higher than in public health centers.6 This indicates that surgeries are performed in hospitals not covered by the program, leading to an increased OOPE. Currently, overall healthcare OOPE contributes to 63% of healthcare expenditures.7 Among other reasons, high OOPE is due to India’s persistent low government health expenditure equaling only 3.16% of the gross domestic product (GDP).8 Health insurance schemes like Pradhan Mantri Jan Arogya Yojana (PMJAY) Government Health Schemes, and private insurance packages help alleviate the high OOPE. Yet, 30% of the population is completely uninsured resulting in several households into impoverishment.7
Households can handle the high OOPE according to their income level. For instance, low-income households either choose to get no surgery or opt for subsidized procedures under government health insurance schemes. Whereas, middle and high-income households have an additional option to undergo the procedure nonsubsidized. The existing insurance schemes can cover 70% of the population.7 However, the real population coverage is less due to the overlap of eligibility across PMJAY, Central Government Health Schemes, and private insurance packages.
There are two potential approaches to address the high unmet need for cataract surgeries. First, the government could play the role of the provider and expand resources to provide surgical care in a public setting. Second, the government can play the role of the buyer so families can seek care from public or private facilities. Regardless of which method is used to fulfill the unmet need for cataract, the government must increase financial funding. In this study, we estimated the costs of enhancing coverage for cataracts, the economic benefits of averting the cataract disease burden, and the net benefits of enhanced coverage.
Methods
We conducted a retrospective cross-sectional analysis for 2018 for India and its 30 states. We excluded union territories - Andaman and Nicobar, Chandigarh, Dadra and Nagar Haveli, Daman, and Diu, Lakshadweep, and Puducherry because we did not have their health financing indicators - government health expenditure. For the state of Mizoram, instead of 10 surgical costs, we have used 9 surgical costs excluding the National Sample Survey (NSS) mean cost per surgery.9 According to the NSS, no cataract surgeries were recorded for Mizoram, hence no mean cost per surgery was recorded. However, this might be a sampling issue. Data sources for all variables are listed in Supplementary Table 1. The analysis can be split into three parts.
First, we calculated the costs for enhanced cost coverage under two scenarios - total needs and unmet needs. The total need was defined as cataract prevalence. The unmet need was defined as the number of people with cataracts who did not get operated on, i.e., the difference between prevalence and surgeries conducted under NPCBVI. Through a literature review, we extracted ten per capita surgical package costs from multiple sources like the NSS, PMJAY government insurance scheme, and the Aravind Eye Hospital-Madurai.10,11 From NSS - the nationally representative household survey, we took the state-wise mean costs for seeking cataract surgery. From PMJAY, we took six different package costs for Phacoemulsification (PHACO) and Small Incision cataract surgeries (SICS). We looked at the Aravind Eye Care Model for its efficient system of providing high-quality cataract surgery at a low cost.11 We considered three costs from the Aravind Eye Care Model: direct medical, patient-level indirect which included food, travel, and lost work during the perioperative period, and societal costs which were the sum of direct and indirect costs. 11
Costs and their sources are detailed in Supplementary Table 2. To ensure uniformity, all costs were converted from INR to USD and adjusted for inflation for the year 2020.12,13 To calculate the population-level enhanced coverage costs for covering total needs, we multiplied cataract prevalence by the per capita cataract surgical package costs (Equation 1). To calculate the enhanced coverage costs for covering the unmet needs, we multiplied the difference between prevalence and surgeries conducted with the per capita costs (Equation 2). Hence, we have twenty enhanced coverage costs for each Indian state and India. We conducted uncertainty propagation using the 95% uncertainty intervals associated with cataract prevalence. This accounted for potential variations in the prevalence data and made the analysis more robust and comprehensive. Mean cataract prevalence values and the 95% uncertainty intervals (upper and lower bound) were taken from GBD 2019.

 Second, the economic benefits of averted disease burden if cataract coverage is provided were calculated using the value-of-life-year (VLY) or the full-income approach.14,15 The approach estimates the monetary value of each year of life, even beyond the years of active workforce contribution considering the gains in the GDP and the population-level life expectancy due to past investments in basic public health interventions.16 The Lancet Commission on Investing in Health projected that for South Asia, the value of one life-year could be approximately 2.8 times the GDP per capita at a 3% discount rate.17 As a simpler adaptation, we multiplied non-health GDP per capita by a factor of 2.8. This gave us the life-year cost (Equation 3). Data for health financing indicators was extracted from the National Health Account (NHA).18 For India and states, we considered the national and state-level Gross Domestic Product (GDP) and Total Health Expenditure (THE). To quantify the economic benefits (value of life year), we multiplied the life-year cost with averted disability-adjusted life-years (DALYs) associated with cataracts (Equation 4). We assumed that surgeries are efficacious in reducing all cataract disease burdens. Mean DALY values and the 95% uncertainty intervals were taken from GBD 2019, i.e. we accounted for the smallest (lower bound) and largest (upper bound) values for DALY. To account for DALYs averted by covering unmet needs, we multiplied the DALYs averted by meeting total needs by the ratio of unmet to total needs (Equation 5). To account for uncertainties in economic benefits, we propagated uncertainties from the DALY values. All calculations were conducted for two scenarios - total and unmet need.


 Third, we calculated the net benefits from covering total needs by subtracting the costs for covering the total needs from the economic benefits of averted total cataract burden (Equation 6). Similarly, we calculated net benefits from costs covering the unmet needs (Equation 7). The error was propagated for the net benefits from covering total and unmet needs as follows. First, the lower bound value was subtracted from the mean value of the costs for enhanced cost coverage. This difference was called delta x (Equation 8). Similarly, the difference between the lower bound and mean value of economic benefits was called delta y (Equation 9). Error value for net benefits was calculated as the square root of the sum of squared delta x and squared delta y values. This was taken as delta z and the corresponding upper and lower bound values were calculated for net benefits (Equation 10).


 We conducted a sensitivity analysis using the complication rates from the Aravind Eye Care Model.19 Complication rates were used to adjust surgeries to give complication rate-adjusted unmet needs (Equations 11-12). Values are shown in Supplementary Table 5. In turn, this was used to calculate complication rate-adjusted enhanced coverage costs, economic benefits, and net benefits (Supplementary Tables 6-8).

 Data generated and used in this study are available in Harvard Dataverse 20.
Results
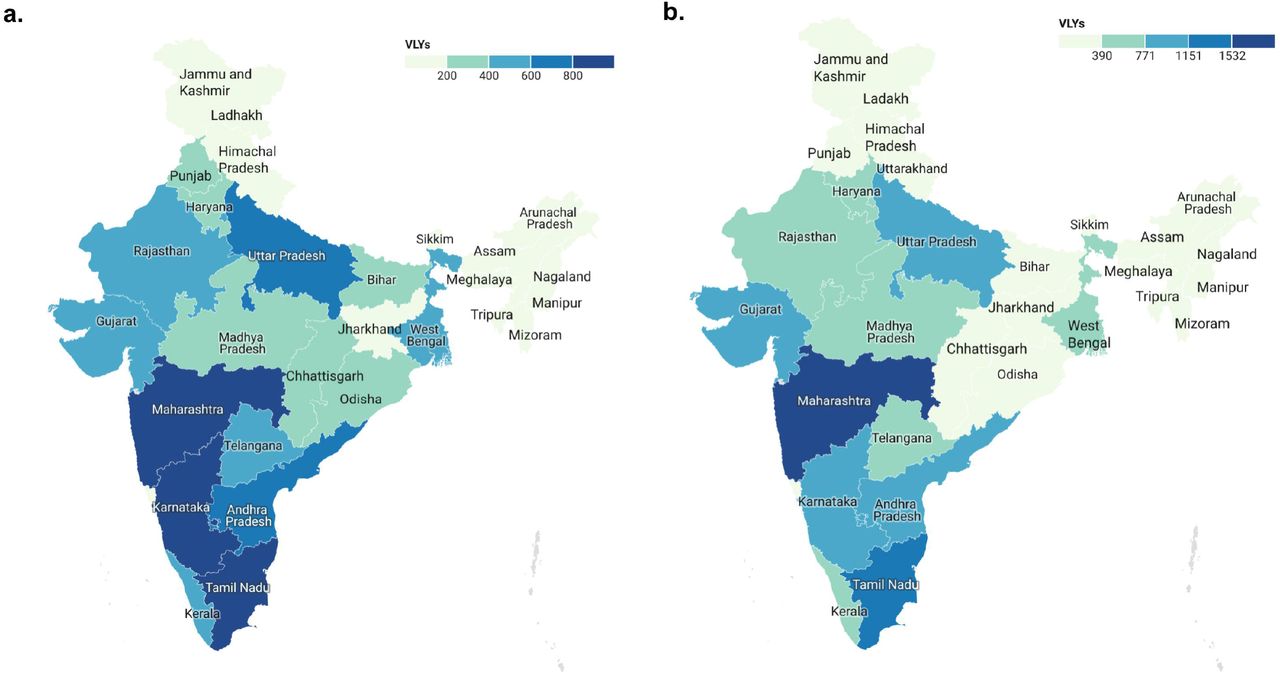
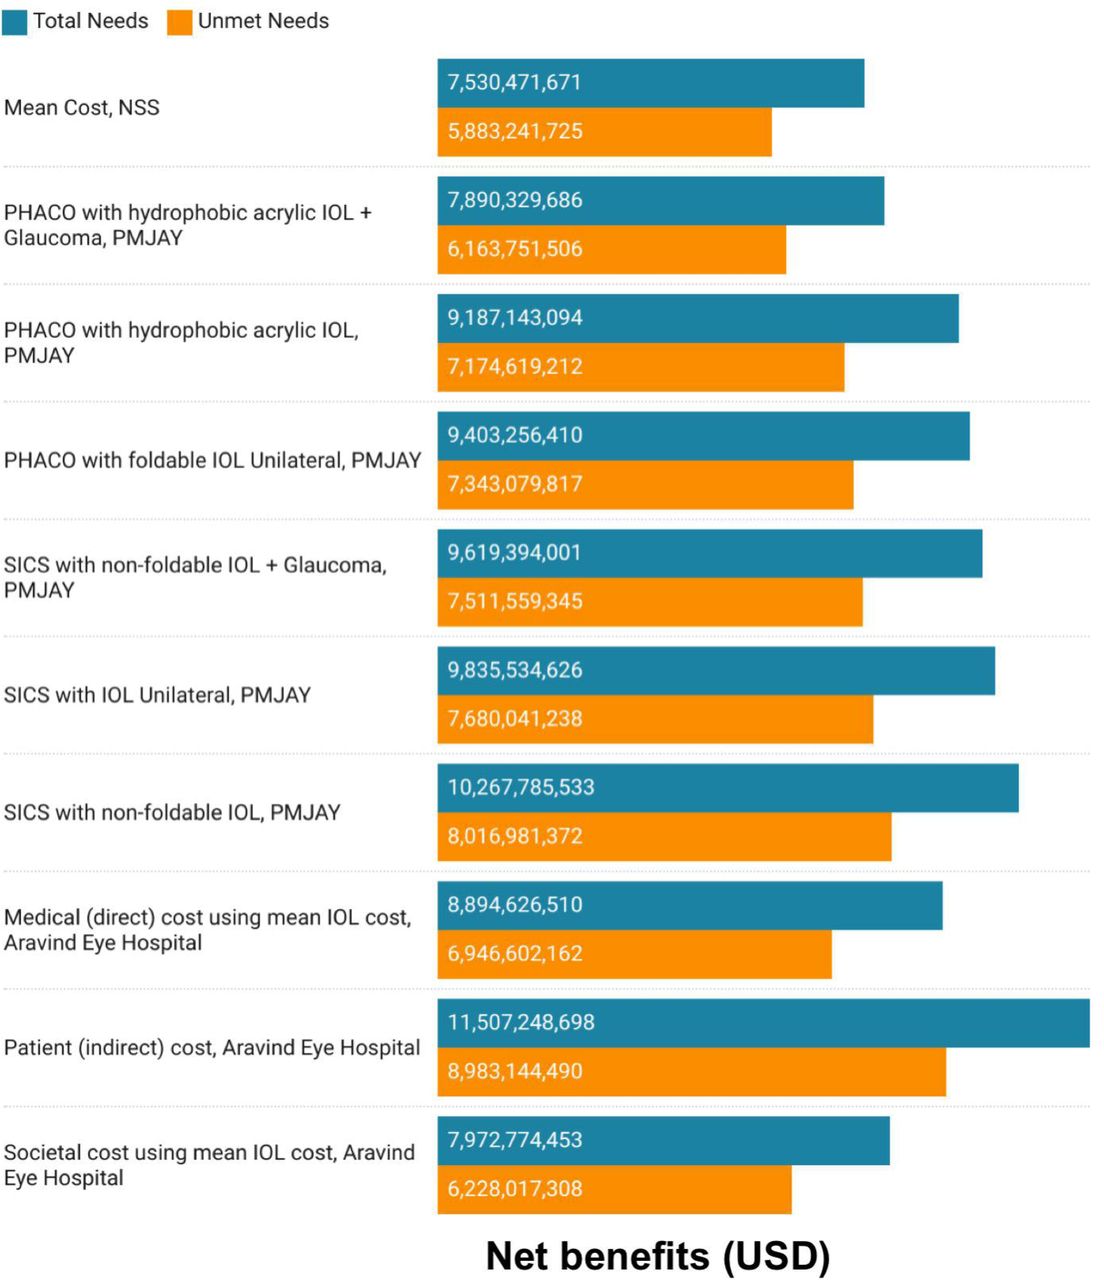
Annual costs for coverage expansion for covering total cataract needs in India were 0.92 - 4.9 billion USD (Figure 1a). While those for covering unmet needs were 0.72 - 3.82 billion USD (Figure 1b). We saw a 0.01% difference in coverage expansion costs nationally on adjusting for complication rates. Large and populous states like Maharashtra, Rajasthan, and Bihar had higher costs for coverage expansion. Small Northeastern states like Sikkim and Arunachal Pradesh had lower costs for coverage expansion (Supplementary Tables 3 and 4). Using the complication rate-adjusted surgeries, Uttar Pradesh had the highest expansion coverage cost of 610.4 (95%UI: 523.7 - 715.8) million USD using per capita costs from NSS. In contrast, using patient-indirect costs from the Aravind Eye Care Model, Sikkim had the lowest cost at 0.4 (95%UI: 0.3 - 0.4) million USD. The economic benefit of averting the total cataract burden for India was 12.4 (95%UI: 8.9 - 16.7) billion USD (Figure 2a), while that of averting unmet cataract burden was 9.7 (95%UI: 6.93 - 13) billion USD (Figure 2b). The economic benefits for averting the total and unmet burden were highest for Maharashtra and lowest for Sikkim (Figures 2a & b). The annual net benefits from covering total needs in India ranged from 7.53 (95%CI: 6.95 to 8.10) billion USD to 11.5 (95%CI: 11.4 to 11.6) billion USD while those from covering unmet needs ranged from 5.9 (95% CI: 3.11 to 8.7) billion USD to 9 (95%CI: 6.2 to 11.8) billion USD (Figure 3). Twenty-seven (90%) states depicted net benefits for both total and unmet need scenarios. State-wise net benefits/losses are presented in Supplementary Figures 1-30. The highest and lowest net benefits were seen in Maharashtra (Supplementary Figure 24) and Meghalaya (Supplementary Figure 16), respectively. Bihar (Supplementary Figure 9), Meghalaya (Supplementary Figure 16), and Manipur (Supplementary Figure 13) had net losses for only certain per capita surgical package costs. For instance, Bihar depicted net losses for covering total needs for only two of the ten cost packages considered (Supplementary Figure 9).

All costs are adjusted to millions of USD for the year 2020. Abbreviations: NSS - National Sample Survey, PMJAY - Pradhan Mantri Jan Arogya Yojana, PHACO - Phacoemulsification, IOL - Intraocular lens, SICS - Small Incision Cataract Surgery.

Values in million USD.

All costs are adjusted to USD for the year 2020. Positive values depict net benefit while negative values depict net loss. Abbreviations: NSS - National Sample Survey, PMJAY - Pradhan Mantri Jan Arogya Yojana, PHACO - Phacoemulsification, IOL - Intraocular lens, SICS - Small Incision Cataract Surgery
Discussion
Increasing cost coverage is beneficial for the government. Costs for expansion of cataract coverage were calculated to cover total and unmet needs showing wide interstate variability due to differences in population size, disease burden, and GDP values. Expectedly, states like Maharashtra, Uttar Pradesh, and Rajasthan have greater costs for coverage expansion than those for northeastern states like Sikkim and Nagaland. After adjusting for complication rates, Uttar Pradesh had the highest expansion coverage cost with a 21.2% increase. Maharashtra and Bihar followed closely behind. Sikkim had the lowest expansion coverage costs after adjusting for complications, with a 100% increase after adjustment. This is followed by Arunachal Pradesh and Mizoram.
The complication rate-adjusted surgeries lead to a difference in cataract coverage expansion costs. For both, unadjusted and complication rate-adjusted expansion coverage costs, patient (indirect) costs using mean intraocular lens (IOL) cost from Aravind Eye Care Model, led to lowest expansion coverage costs.11 Whereas, mean costs from NSS led to the highest expansion coverage costs.9 However, in most scenarios, 27 states in India would have net benefits from the enhanced cost coverage of cataract surgeries. Hence, Investing in universal cataract coverage caters to the rising burden.
The economic burden of cataracts as a preventable cause of blindness and the cost-effectiveness of covering case detection strategies have been studied in India.10,21,22, The present analysis estimates the state-wise economic benefits of expanding cost coverage of cataract surgeries in India, which was previously missing. The net benefits are substantial, which should be an impetus for policymakers to expand and provide universal cataract coverage.
According to the NPCBVI (2015-2019) Summary Report, the private sector conducted 57.85% of cataract surgeries whereas the public sector conducted 39.3% of surgeries.2 Further, OOPE was the major barrier for patients seeking surgery. This conundrum can be resolved by either the government directly providing the service or paying other service providers to offer the service at a lower cost. Hence, expanding NPCBVI by increasing direct payments to service providers in the government setup can improve access to government setups and ease the financial burden of the care seekers.2 Moreover, investments can be utilized to expand services in the government and private sectors to achieve universal coverage.23
For the bottom 40% of the population, cataract surgeries are insured under PMJAY. An increase in investment in PMJAY will increase coverage of surgeries for the uninsured population due to a decrease in OOPE leading to universal cataract coverage. Investing in cataract insurance can bring new providers to places lacking access as previously observed in Rashtriya Sam Bima Yojana (RSBY).24,25 RSBY allocated funds to states like Jharkhand and Chhattisgarh which resulted in an uptick in private practitioners setting up clinics in these states. Consequently, when PMJAY was initiated, 99% of the total cataract claims were raised from private hospitals in Chhattisgarh and Jharkhand. Contrarily, states such as Madhya Pradesh where government hospitals provide care, had low utilization of PMJAY cataract packages. Low utilization of PMJAY packages in government hospitals can be a result of coverage provided by NPCBVI. Expectedly, demand for PMJAY cataract packages increased significantly even among smaller clinics improving access to beneficiaries.10 Hence, the enhanced investments can provide cataract coverage by public sector expansion or government-funded health insurance.
To our knowledge, this is the first state-wise pan-India analysis of the costs and benefits of universal cataract coverage. We provide a library of over 900 estimates under multiple scenarios and cost assumptions. We also ensured robustness through uncertainty propagation. However, the study has the following limitations. First, we assumed that surgeries could treat the entire disease burden which may not be true. Second, we only analyzed the annual net benefits of 2018 and did not project future benefits. Nonetheless, the over-time benefits for future years would only rise further. Hence, our findings could be considered as the lower bound of the net benefits.
Data Availability
All data produced are available online at https://doi.org/10.7910/DVN/DTEZXS
Declarations
Ethics approval and consent to participate
Not applicable
Consent for publication
Not applicable
Funding
None
Authors’ contributions
Study concept and design
Siddhesh Zadey
Acquisition, analysis, or interpretation of data
Anoushka Arora, Pushkar Nimkar, Himanshu Iyer, Siddhesh Zadey
Drafting of the manuscript
Anoushka Arora, Madhurima Vuddemarry, Chaitanya Reddy
Critical revision of the manuscript for important intellectual content
All authors
Statistical analysis
Anoushka Arora, Pushkar Nimkar
Administrative, technical, or material support
Siddhesh Zadey
Study supervision
Siddhesh Zadey
Dataset Availability
Data used and generated in this manuscript can be found in the associated repository at Harvard Dataverse (https://doi.org/10.7910/DVN/DTEZXS)
Acknowledgements
The authors would like to thank Ram Pachpor and Tejali Gangane for their assistance with data and Dr. Sweta Dubey for their helpful comments.
Footnotes
Competing interests: The corresponding author Siddhesh Zadey is the Cofounding Director of the Association for Socially Applicable Research (ASAR). He also serves as the Permanent Council Member, The G4 Alliance Chair, SOTA Care in South Asia Working Group The G4 Alliance, and the Drafting Committee Member for Maharashtra State Mental Health Policy. The other authors declare no conflicts of interest.
Funding: None
We conducted two additional analyses to make our study more robust and comprehensive. First, we conducted a sensitivity analysis using complication rate-adjusted surgeries that gave as 300 more estimates. Second, an uncertainty analysis was conducted for the net benefits.


