
Summary
Immunoglobulins are among the most important anti-viral effectors of the human immune system. The biological mechanisms underlying antibody production and maintenance are relatively well understood. However, a broader model of how host intrinsic factors and external processes influence humoral responses to viral infections is lacking. Here, we investigate how age, sex, genetics, health-related habits, and immune factors relate to the anti-viral antibody repertoire of healthy humans. We used VirScan, a high-throughput technology based on phage-display immunoprecipitation sequencing (PhIP-seq), to characterize antibody reactivity against more than 90,000 viral epitopes in 1,212 healthy adults of European and African descent. By comparing VirScan with various serological assays, we first show that PhIP-seq-based antibody repertoires recapitulate expected serostatuses and uncover considerable variation in epitope-specific reactivity. In addition to age and sex effects, we find that the antibody repertoire is strongly associated with active smoking, which results in increased antibody levels against rhinoviruses. We provide evidence that individuals born in Central Africa and Europe differ in antigenic reactivity to common herpesviruses by targeting different viral proteins. By comparing antibody repertoires to 169 immune cell parameters, we find that HLA-DR expression in circulating dendritic cells is associated with increased reactivity against EBV. Finally, we conducted a GWAS of antibody binding against more than 2,600 viral peptides. We confirmed a strong effect of HLA and IGH loci and the FUT2 gene and identified new associations between variants in these genes and antibodies against adenoviruses and saliviruses. These findings highlight the determinants of human variation in the humoral response to viruses and broaden perspectives on how the antibody repertoire is generated and maintained.
Introduction
The cellular and molecular mechanisms underlying the generation of human humoral immunity against viral infections are now well understood. However, this process is influenced by a range of factors that together determine the strength and longevity of the antibody response, most of which are unknown. Blood antibody titers serve as a proxy to evaluate the humoral immune response and are widely used as correlates of protection after vaccination or natural infection. Recent family- and population-based studies have examined how genetic and non-genetic parameters influence the humoral immune response by assessing their relationship to anti-viral antibody titers. These studies have shown that antiviral antibody levels are strongly related to sex and age. For example, women have higher titers against human papillomavirus (HPV)1 and Epstein-Barr virus (EBV)1,2 and generally generate more robust vaccine responses than men3. Population immunity against some herpesviruses, such as HSV-1 and cytomegalovirus (CMV), tends to increase over time due to accumulated exposure1,2,4,5. In contrast, viruses that are more prevalent in children (such as respiratory syncytial virus (RSV) and varicella-zoster virus (VZV)) or are a part of childhood immunization schedules (such as measles, mumps, and rubella viruses) tend to be present at high levels in most adults1,2. Other non-genetic factors associated with serostatus include socioeconomic status1,2 and smoking4.
Human genetic factors also affect antibody production and maintenance. Total immunoglobulin levels are known to be heritable, and genetic variants determining the blood concentration of all soluble isotypes have been identified2,6,7. Family-based studies have revealed that virus-specific antibody titers are also influenced by host genetics, including antibodies against CMV, EBV, and Influenza A virus (IAV)8,9. In addition, genome-wide association studies (GWAS) have identified several loci associated with antibody titers. The most established is the MHC locus2,10–13, which is associated with antibody titers against EBV, Hepatitis B virus (HBV), VZV, and Molluscum contagiosum virus (MCV)10,11,14,15. Other known loci include IGH genes, STING1 and FUT2, related to antibodies against the Norwalk virus16,17. However, although the determinants of the anti-viral humoral response are increasingly well characterized, previous studies have focused on total immunoglobulin titers or on antibodies against few, candidate viruses, precluding a detailed understanding of human humoral immunity against the vast number of viruses that infect humans18. Furthermore, human antibodies targeting one virus can recognize many different viral epitopes, i.e., molecular elements of the virus that are recognized as antigens, but it remains unclear how epitope-specific reactivity varies among individuals and what factors affect inter-individual variation in viral antigenic specificity.
Phage immunoprecipitation sequencing (PhIP-seq) is a phage-display-based, high-throughput technology for evaluating antibody-epitope interactions. This approach was first used to identify plasma autoantibodies using a phage library covering the human peptidome19,20. PhIP-seq has since been used to diagnose COVID-19 patients13,21, profile the humoral immune response against bacteria and food allergens22–24, and identify antibody repertoire changes in patients with inflammatory bowel disease5. The VirScan phage library is a specific implementation of PhIP-seq that covers the peptidome of all viruses known to infect humans25. It has been applied to study the global effect of measles infection on the antibody repertoire26, follow immune development in neonates27, diagnose liver cancer28, and identify public epitopes against viruses29. Here, we use the VirScan PhIP-seq library of over 90,000 viral peptides in 1,212 healthy adults to reveal non-genetic and genetic factors that influence the anti-viral antibody response and epitope-specific reactivity in homeostatic conditions. We identify novel associations between the antibody repertoire with age and sex, and show that individuals from different continents do not recognize the same EBV epitopes upon infection. We show that cigarette smoking results in a strong increase in antibody levels against various rhinovirus strains, which is reversible with smoking cessation. We investigate correlations between the antibody repertoire and immune phenotypes and highlight the impact of anti-IAV antibody levels on the ex vivo cellular response to live IAV. Finally, we identified strong associations between human genetic variation at three genomic loci and antibodies against a range of viruses, including the recently described family of saliviruses.
Results
PhIP-seq Reveals the Anti-Viral Antibody Repertoire of Healthy Adults
We performed PhIP-seq on 900 samples from the Milieu Intérieur (MI) cohort, collected in Rennes (France) between 2012-2013 (Figure 1A)30. The MI cohort consists exclusively of individuals with all four grandparents born in mainland France and has a uniform sex and age distribution, with all subjects between 20 and 69 years old (Figure 1B; Table S1). To validate the findings from the MI cohort and explore population differences in humoral responses, we also performed PhIP-seq on 312 samples from the EvoImmunoPop (EIP) cohort collected in Ghent (Belgium) (Figure 1A). The cohort consists of males ranging from 20 to 50 years old (Figure 1C; Table S2), including 100 and 212 individuals of self-reported European or African descent, born in Belgium and Central Africa, respectively. Plasma antibody reactivity was assessed for all samples using the VirScan V3 library25, which contains 115,753 peptide sequences, 85% of which are viral. Peptides were filtered to include unique viral sequences for a final set of 97,978 peptides (STAR Methods). These peptides originate from a range of viral families, including herpesviruses (18,262 peptides), poxviruses (11,567 peptides), and flaviviruses (8,089 peptides) (Figure S1A). At the virus level, many peptides originate from relatively common viruses, such as IAV (5,655 peptides), Hepatitis B virus (5,423 peptides), and CMV (3,973 peptides), but also from less well-studied viruses, such as Orf virus (2,130 peptides) and MCV (2,075 peptides) (Figure S1B).

A, B) Bar chart indicating the number of peptides in the VirScan PhIP-seq library, separated by viral family (A) and top 50 viruses (B). C) Number of enriched peptides per EIP subject. D) Number of EIP subjects having significant antibody reactivity against each peptide. E) Percentage of EIP subjects showing peptide enrichment for 3,210 public peptides separated by virus. Only viruses with at least two peptides with an enrichment of >5% are shown.

Overview of the Milieu Intérieur (MI) and EvoImmunopop (EIP) cohorts. A) Distribution of sex and ancestry within the MI and EIP cohorts, respectively. B, C) Age distribution within the MI (B) and EIP (C) cohorts. D) Number of enriched peptides per MI subject. E) Number of MI subjects having significant antibody reactivity against each peptide. F) Percentage of MI subjects showing peptide enrichment for 2,608 public peptides separated by virus. Only viruses with at least two peptides with an enrichment of >5% are shown. G) Comparison of the number of enriched peptides per virus between the MI and EIP cohorts. Viruses that differ considerably between the cohorts are indicated. H) Heatmap indicating the predicted infection status of each individual for the 20 most prevalent viruses, as determined by the AVARDA algorithm (Padj < 0.05 after Benjamini-Hochberg correction).
The number of enriched peptides (STAR Methods) per subject was normally distributed, with an average of 881 and 1,044 peptides for MI and EIP subjects, respectively, owing to cohort differences in age, sex and/or ancestry (Figures 1D and S1C). When estimating antibody reactivity from peptide scores, we found that most peptides are enriched in only a few individuals, reflecting individual-specific immune responses (so-called private epitopes) or false positives (Figures 1E and S1D), in line with previous PhIP-seq studies4,22,24. Within the MI and EIP cohorts, 2,608 and 3,210 epitopes were public, hereby defined as peptides significantly enriched in >5% of subjects for at least two peptides from the same virus. Public epitopes originated from 113 viral species, the most common being EBV, IAV, and Enterovirus B, in both MI (Figure 1F) and EIP cohorts (Figure S1E). Notably, some viruses showed more public epitopes in the EIP cohort, relative to MI cohort (Figure 1G). For example, HHV-8 had 72 public epitopes in EIP, but only 5 in MI, reflecting a higher infection rate in the African-descent EIP subjects. Together, our analyses reveal the great diversity of the anti-viral antibody repertoire of healthy adults, mainly targeting viruses causing recurrent or persistent infections.
AVARDA Scores Reflect Serostatus Established by Gold-Standard Assays
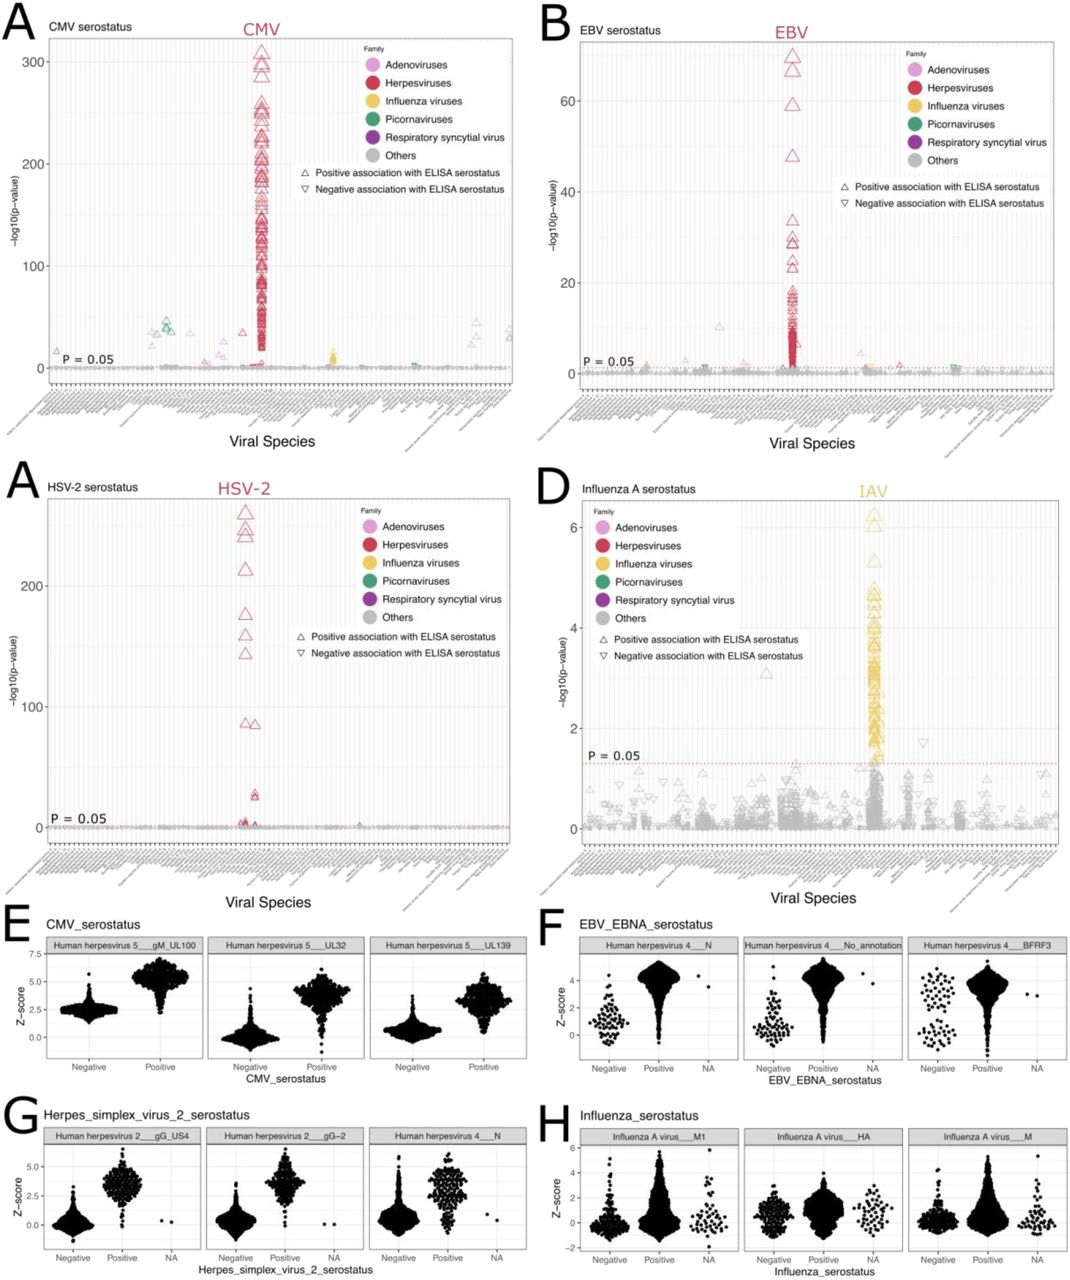
Although the possibility of investigating the reactivity of thousands of epitopes simultaneously is one of the strengths of the VirScan assay, plasma antibodies may also cross-react with phylogenetically related viral peptides, resulting in false positive signals. To circumvent this issue, we used the AVARDA algorithm, which generates probabilities of antibody reactivity at the virus species level, taking sequence alignment between peptides and peptide representation in the library into account31 (STAR Methods). As expected, the viruses with the highest seroprevalence according to AVARDA included EBV, rhinoviruses A and B, adenovirus C, and the herpesviruses HSV-1 and CMV (Figure 1H). To validate AVARDA results further, we compared AVARDA scores to serological measurements obtained by standard ELISA or Luminex-based assays in the same individuals2 (STAR Methods). AVARDA breadth scores were strongly and specifically associated with ELISA serostatus (STAR methods) for CMV (P = 2.05 × 10-159), EBV (P = 6.03 × 10⁻¹⁹), and HSV-2 (P = 2.13 × 10-52) (Figure S2A-C, E-G). Conversely, the AVARDA breadth score was not predictive of ELISA serostatus for IAV (P = 0.30) (Figure S2D, H), probably because of large individual variations in IAV antigenic specificity captured by Virscan and the converse narrow specificity of ELISA. Of 43 Luminex-based serology assays, 27 were significantly associated with the VirScan AVARDA scores, with the top 16 most significant associations being with the cognate virus (Figures S2I). Six assays were weakly associated with an incorrect virus (P > 0.0042), and 16 were not associated with any AVARDA breadth score. Such false negatives could either be due to experimental or analytical errors with the PhIP-seq assay, ELISA or Luminex assays, poor quality antigens in the ELISA or Luminex assays, or a reflection of low serological values close to assay limits of detection.

A-D) P-values for the association between the AVARDA breadth score and ELISA-determined serostatus for CMV (A), EBV (B), HSV-2 (C), and IAV (D). E-H) The AVARDA breadth scores for the top three viruses associated with ELISA-determined serostatus for CMV (E), EBV (F), HSV-2 (G), and IAV (H). NA indicates that the serostatus could not be conclusively determined based on the ELISA assay. I) P-values for the association between the fluorescence intensity measurement of the Luminex xMAP serology assay and the AVARDA breadth scores. Serology variables are represented on the x-axis, and the top two AVARDA associations are connected with a black line. Significant associations (FDR < 0.05) are colored green if the association between serostatus and AVARDA score is for the cognate virus and red if there’s a mismatched association. Non-significant associations are colored grey.
To evaluate whether the AVARDA algorithm induces false negatives, we tested the association between ELISA serostatus and Z-scores of individual epitopes in the MI cohort (STAR Methods). For 9 of 12 ELISA assays, associations between epitopes and ELISA serostatus were strong and specific (Figure S3A-D). Interestingly, epitope-level analysis also revealed that subjects exposed to a given virus recognize different proteins of this virus, which could not be identified based on the AVARDA or ELISA data. For example, in contrast to the AVARDA score, a large number of IAV epitopes were significantly associated with the ELISA IAV serostatus, indicating that increased resolution can be achieved by analyzing individual epitopes (Figure S3D-H). Additionally, a subgroup of individuals who are considered EBV-negative according to the ELISA assay displayed positive reactivity against epitopes from the EBV BFRF3 protein, implying that the ELISA assay underestimates EBV seropositivity (Figure S3F, right panel). Nevertheless, due to antibody cross-reactivity, some epitopes of a given virus were occasionally associated with ELISA results for other viruses. These include Influenza B epitopes being weakly associated with Influenza A serostatus (Figure S3D), epitopes from various viruses with CMV serostatus (Figure S3A), and an epitope from the EBV N protein with HSV-2 serostatus (Figure S3G). Collectively, these analyses show that AVARDA analyses are overall specific and provide high resolution and sensitivity when combined with epitope-level analyses for the corresponding viruses.

A-D) P-values for the association between public peptide Z-scores and ELISA-determined serostatus for CMV (A), EBV (B), HSV-2 (C), and IAV (D). E-H) The distribution of peptide Z-scores for the top three proteins associated with ELISA-determined serostatus for CMV (E), EBV (F), HSV-2 (G), and IAV (H). NA indicates that the serostatus could not be conclusively determined based on the ELISA assay.
Age and Sex Effects on The Anti-Viral Antibody Repertoire
By combining epitope-level and AVARDA analyses, we first investigated the effects of age and sex on the anti-viral antibody repertoire, including antibody levels against 2,608 public peptides and 150 viruses. Regression modeling indicated that antibody reactivity against a wide range of viruses is strongly associated with age, in line with previous studies (Figure 2A)4,5. Antibodies against 565 epitopes significantly increased with age, primarily those targeting herpesviruses, as well as the Orthopneumovirus RSV, which infect the human host continuously throughout a lifetime. HSV-1 and EBV were the viruses for which antibody reactivity was most significantly associated with age, according to the AVARDA analysis (Figure 2B). Eighty-three peptides from HSV-1 were differentially targeted with age, with all except seven being increasingly targeted in older individuals. The strongest associations were with peptides from the US6 gene, encoding the surface protein glycoprotein D (Figure 2C). For EBV, antibodies against 144 of 159 peptides were positively associated with increased age, covering a wide range of proteins, including EBNA-3, -4, and -6 (Figure 2D). Even though the EIP cohort has a relatively narrow age range (20-50 years), we replicated the increasing reactivity against HSV-1, EBV, and CMV with age (Figure 2E).

The anti-viral antibody repertoire in relation to age and sex. A, F). P-values for the associations between all public peptide Z-scores of the MI cohort and age (A) or sex (F), separated by viral species. B, E, G) P-values plotted against effect size for the association between the AVARDA breadth score and either age in the MI cohort (B), age in the EIP cohort (E), or sex in the MI cohort (G). C, D) P-values for the associations between age and peptide Z-scores for HSV-1 (C) and EBV (D), separated by viral protein.
Conversely, antibodies against 766 epitopes significantly decreased with age, primarily from Rhinoviruses, Enteroviruses, and IAV, suggesting higher exposure in younger adults and/or antibody waning in older adults. AVARDA analysis confirmed that antibodies against Rhinoviruses A and B, Enterovirus B, and Aichivirus A significantly decrease with age (Figure 2B). Seroprevalence against Aichivirus A, a virus discovered in 1991, is very high worldwide and was shown to increase with age32,33, which is supported by our results. In contrast, IAV was not significant in the AVARDA analysis, confirming that the AVARDA IAV score does not capture anti-IAV humoral responses correctly (Figure S2D vs S3D).
Sex effects on the antibody repertoire were smaller than the age effects: 330 epitopes were significantly associated with higher antibody levels in women and 236 epitopes in men (Figure 2F). While significant epitopes originated from a range of viruses, AVARDA analysis indicated that only CMV and HHV-6 viruses were robustly associated with sex, with higher antibody reactivity in women relative to men (Figure 2G). These results suggest that women are more exposed to herpesviruses than men, in contrast with bacterial infections that affect the antibody repertoire of both women and men comparably 4.
The Anti-Viral Antibody Repertoire Differs Strongly Between Populations
We leveraged the EIP cohort to investigate the effect of ancestry and continent of birth on the anti-viral antibody repertoire. While all EIP samples were collected in Belgium, the subjects of Central African ancestry (AFB) had only moved to Europe within the last few years before sample collection 34, implying that differences with the subjects of European ancestry (EUB) reflect both environmental and genetic effects. Although the EIP cohort is relatively small, we found large differences in antibody repertoires between AFB and EUB (Figure 3A). We detected 898 viral peptides disproportionately targeted by antibodies in EUB individuals. Most of these originate from Enterovirus B and C and IAV, although these associations were relatively weak in the AVARDA data (P > 0.001 in all cases). Conversely, 647 peptides were disproportionately targeted by antibodies in AFB individuals, 61% of which are related to herpesviruses (Figure 3A). The higher reactivity of AFB to herpesviruses relative to EUB was further confirmed by strong AVARDA signals for antibodies against CMV (P = 1.47 × 10⁻¹⁹), HHV-6A (P = 7.04 × 10⁻¹⁷), and HHV-8 (P = 7.89 × 10⁻²⁰), also known as Kaposi’s sarcoma-associated herpes virus (KSHV), confirming previous studies35–37.

The anti-viral antibody repertoire in relation to ancestry group. A) P-values for the associations between all public peptide Z-scores of the EIP cohort and ancestry group. B) P-values plotted against effect size for the association between the AVARDA breadth score and ancestry group. C, D) P-values for the associations between ancestry group and peptide Z-scores for HHV-8 (C) and EBV (D), separated by viral protein. E) P-values plotted against effect size for the association between EBV peptide Z-scores and ancestry group. Only the most significant peptide from each UniProt entry is shown. Each peptide is labeled and colored by the protein of origin.
HHV-8 was the virus with the most prominent differences in reactivity according to the AVARDA analysis (Figure 3B). The levels of anti-HHV-8 antibodies were significantly higher in AFB compared to EUB for 68 of 70 peptides. Although the UniProt annotation of HHV-8 proteins is relatively poor, it is clear that the primary antibody target is the K8.1 Glycoprotein (Figure 3C). Similarly, 108 of 123 CMV peptides were enriched in the AFB cohort, with antibodies targeting a range of viral proteins (Figure 3D). The most significant targets included RL12, UL32 (Tegument protein pp150) and UL139. Protein structure predictions have suggested that UL139 is involved in cell adhesion and could be a good target for an anti-CMV vaccine 38, supported by our results.
Finally, EBV had many epitopes differently enriched in AFB and EUB (Figure 3E). Intriguingly, AVARDA did not identify a statistically significant difference in EBV reactivity between the two groups, suggesting that different EBV proteins are targeted by AFB and EUB antibodies. Epitope-level analyses confirmed that the viral proteins LMP-1 and EBNA-4 were disproportionally targeted by AFB, whereas EBNA-6 was targeted by EUB (Figure 3E). This is most likely due to exposure of AFB and EUB to different EBV strains. Interestingly, the LMP-1 protein sequence in EBV is particularly associated with geographical origin and the distribution of the EBV-associated Burkitt’s lymphoma 39,40. Collectively, these findings reveal regional and population differences in antibody reactivity against epitopes of common viruses and highlight the limitation of using single antigens to assess seroprevalence in worldwide epidemiological studies.
Cigarette Smoking is Associated with High Antibody Reactivity Against Rhinoviruses
We tested associations between the anti-viral antibody repertoire and a curated list of 124 variables that assess socio-economic status, health-related habits, vaccination and medical history, and disease-related biomarkers, while adjusting for age, sex, and ancestry (STAR methods). The variable most significantly associated with humoral response was the number of years a subject has smoked cigarettes (Figure 4A), which was positively associated with reactivity against 138 peptides. These peptides originate from multiple viral species, primarily the diverse Enteroviruses A-D and Rhinoviruses A and B. The AVARDA analysis only detected Rhinoviruses A and B as significantly associated with years of smoking, suggesting that the signals for Enterovirus A-D peptides are due to cross-reactivity (Figure 4B). Apart from the 39% significant rhinovirus peptides with an unknown strain of origin, most significant peptides originated from strains A23, B14, A2, and A1B (Figure 4C). These viruses are responsible for the common cold, which is known to be more frequent and severe in smokers, although the mechanism is debated41,42. The rhinovirus epitope most significantly associated with smoking originates from a Rhinovirus B polyprotein containing capsid proteins (Figure 4D), the antibody levels against which show an increase with years of smoking (P = 3.24 × 10⁻¹⁰). Notably, ex-smokers demonstrated similar levels of reactivity against Rhinovirus B as subjects who never smoked (P = 8.75 × 10⁻¹¹) (Figure 4E). Furthermore, the number of years since smoking cessation in ex-smokers was negatively associated with viral AVARDA scores for both Rhinovirus A (P = 3.6 × 10⁻⁵) and Rhinovirus B (P = 0.00025). Together, these findings indicate that smoking has a strong but reversible effect on the antibody repertoire against rhinoviruses.

The anti-viral antibody response in relation to smoking. A) P-values for the association between all public peptide Z-scores of the MI cohort and the number of smoking years. B) P-values plotted against effect size for the association between the AVARDA breadth score and the number of smoking years. C) The distribution of the viral strain of origin for all rhinovirus peptides significantly associated with smoking years. D) The number of years a person has smoked plotted against the Z-scores for antibody reactivity against the peptide most associated with smoking. The regression line for a linear model is shown in blue, with the confidence interval indicated in light blue. E) The Z-score distribution of the rhinovirus peptide most significantly associated with smoking status.
The Relationship Between Immune Phenotypes and Anti-Viral Antibodies
Given the profound effects that viral infections can have on the immune system43–45, we next assessed the association between the antibody repertoire and the wide range of immunity-related data collected in the MI cohort, including detailed cellular phenotyping based on flow cytometry and functional immune evaluation based on gene expression and cytokine production in response to stimulation. For cellular phenotyping, 169 peripheral blood immune cell phenotypes were measured in MI subjects, including immune cell frequencies, cell surface markers by MFIs, and immune cell ratios (STAR methods) 46. Among all tested viruses, CMV was the only virus for which antibody levels were strongly associated with flow cytometry phenotypes (Figure 5A). In total, 15 flow cytometry phenotypes were associated with anti-CMV antibodies, 13 of which were T-cell-related. The strongest association was observed with the frequency of CD4+ effector memory T-cells re-expressing CD45RA (TEMRA cells; P = 4.2 × 10-69) (Figure S4A), confirming previous studies47,48. The CMV peptides significantly associated with CD4+ TEMRA cells came from 47 Uniprot entries from 26 viral proteins. The strongest associations included peptides of various envelope glycoproteins, such as Glycoprotein B, Glycoprotein M, and Membrane glycoprotein UL139, but also tegument proteins, such as Cytoplasmic envelopment protein 3 and pp150 (Figure 5B). In addition to the established association between anti-CMV antibodies and TEMRA cells, we identified significant associations between the surface expression of HLA-DR in conventional type 1 dendritic (cDC1) cells and antibody reactivity against 12 EBV peptides (Figure S4B; P > 8.88 × 10⁻⁹). All but one of the significant EBV peptides originate from the EBNA-LP antigen, a known modulator of viral gene expression.

A, C) Effect size plotted against P-values for the association of the CMV AVARDA breadth score with immune cell phenotypes (A) and gene expression (C). B, D) P-values for the association of peptide Z-scores with HLA-DR surface expression in cDC1 cells (B) and IL21 expression (D). E) P-values for peptide-gene expression associations in the control group (x-axis), plotted against the p-values for the same associations after IAV stimulation for all CMV peptides. Peptides originating from two outlier host genes are indicated. F) P-values for the association of cytokine secretion at baseline or in response to live IAV stimulation with AVARDA breadth scores.

A-C) Manhattan plots of the three most significantly associated genetic loci, MHC (A), IGH (B), and FUT2 (C), are shown for the MI and EIP cohorts. The GWAS results for the viral peptide with the lowest p-value are displayed for each locus. The gene closest to the top hit in each cohort is indicated. D) Pairwise plot of Z-scores for the top associated peptides of Norovirus, Salivirus A, and Salivirus FHB.

The anti-viral antibody response in relation to immune phenotype. A, C) P-values for the association of immune cell phenotypes (A) and gene expression (C) with AVARDA breadth scores. B, D) P-values for the associations between CMV peptide Z-scores and CD4+ TEMRA cells (B) and CCL5 gene expression (D), separated by viral protein. E) P-values for peptide-gene expression associations in the control group (x-axis), plotted against the p-values for the same associations after IAV stimulation. CMV peptides are not included in the figure, as their inclusion inflates the x- and y-axes, making it difficult to discern significant differences in other viruses. Peptides originating from the IAV are indicated. F) Table of the 20 most significant peptide-gene expression associations for IAV peptides.
To investigate whether anti-viral antibodies have an impact on the functional immune response against viruses, we then tested the association between all common epitopes and gene expression of 560 immunity-related genes 49 as well as circulating levels of 13 cytokines, measured before and after live IAV stimulation of whole blood in the entire MI cohort (Saint-André et al., under revision) (STAR methods). Because gene expression was measured in bulk, we controlled all statistical models for cell frequencies of 15 common immune cell populations, including CD4+ TEMRA cells. In the unstimulated state, only seven genes were associated with anti-CMV antibodies (Figure 5C, S4C), whereas 93 genes were associated when not controlling for blood cell composition, indicating that most of the effects of latent CMV infection on the host transcriptome are mediated by changes in blood cell proportions. Again, a broad spectrum of immunogenic CMV peptides were associated with gene expression (Figure 5D).
Upon stimulation with live IAV, most associations between anti-CMV antibodies and gene expression observed at steady state remained significant (Figure S4E). The exceptions were the genes LAG3 and GNLY, which were significantly associated with anti-CMV antibodies at baseline, but not after stimulation with IAV. This occured as IAV stimulation drastically increased gene expression for both of these genes, hiding the difference seen between CMV-negative and CMV-positive subjects at baseline. More importantly, 43 unique IAV peptides were significantly associated with the upregulation of 8 genes and downregulation of 6 genes upon IAV stimulation but not at baseline, indicating that anti-IAV antibody levels impact the immediate cellular response to IAV ex vivo (Figure 5E). The primary peptide target of the anti-IAV antibodies was Hemagglutinin, but Neuraminidase and Matrix protein 1 were also significantly associated with the expression of some genes (Figure 5F). The gene most strongly associated with anti-IAV immunity was IL21, with no other virus being statistically significant (Figure S4D). At the cytokine level, three associations were significant (Figure S4F), with the strongest association being between anti-IAV antibodies and increased IL-8 production upon IAV stimulation (P = 6.1 × 10⁻⁴). Collectively, these results demonstrate that humoral immunity against past IAV infection impacts the magnitude of immune cell response against live IAV, both at the transcriptional and protein levels.
Host Genetic Factors Influence the Anti-Viral Antibody Repertoire
To identify genetic factors affecting the anti-viral antibody repertoire, we conducted a GWAS of the 2,608 public peptides in the MI cohort by testing association with 5,699,237 imputed SNPs46, while controlling for age, sex, and genetic structure. The EIP cohort was used as a replication cohort36. We detected four independent, genome-wide significant loci (P < 6.8 × 10⁻¹¹) associated with 105 viral epitopes (Figure 6A). For two out of four loci, associated peptides originated from multiple viruses, indicating that candidate variants have pleiotropic effects on anti-viral humoral immunity (Figure 6B). The HLA locus showed the strongest associations, in line with previous work demonstrating its major effects on humoral responses against EBV, IAV, HSV-1, VZV, JC polyomavirus, and MCV 2,4,10–13. Here, we found a significant association between HLA variants and antibody response against 99 peptides from 12 viruses. Among these associations, the strongest was with antibodies against the EBNA-5 protein of EBV (P = 5.6 × 10⁻²⁶; Prep = 3.0 × 10⁻⁶). Additionally, we found new associations with Enterovirus A, adenoviruses A-F, and Norwalk virus. Notably, many variants in HLA-DR and HLA-DQ genes were strongly associated with antibodies against adenoviruses A-F in both MI and EIP cohorts (Figure S6A) (P < 7.59 × 10⁻¹⁴; Prep < 2.6 × 10⁻³). The same variants are associated with several autoimmune diseases, including rheumatoid arthritis and type 1 diabetes50. We also found two Rubella virus peptides associated with genetic variation near the IGH locus (P = 1.7 × 10⁻¹²; Figure S6B). This large genomic region encodes the heavy chain of the antibody molecule, and has previously been associated with antibody titers against various pathogens4. The association was replicated in the EIP cohort (Prep = 0.04; Figure 6B).

Genome-wide association study of anti-viral antibody immunity A) Manhattan plot of associations between all 2,608 public peptides of the MI cohort and all common variants (MAF > 5%). Only results with P < 0.005 are displayed. The significance threshold was determined by Bonferroni correction of P-values. The top hit of each peak is annotated with the closest gene. B) Table of the top significant independent hits of the MI GWAS for each virus. C, D) LocusZoom plots of the results from the association of Salivirus A (UniProt ID: D1L752) with FUT2 variants (C) and the association of Norwalk virus (UniProt ID: Q8V0P3) with RASIP1 variants (D).
Antibodies against Norwalk virus and Saliviruses were associated with variants in or near the FUT2 gene. Mutations in FUT2 determine the secretor status phenotype, a known risk factor for Norovirus infection causing winter vomiting disease. Consistently, the lead variant for anti-Norwalk virus antibodies (P = 1.1 × 10⁻¹¹), located in the RASIP1 gene, is in partial linkage disequilibrium (LD) (r² = 0.52 in the MI cohort) with the FUT2 stop mutation that most commonly determines the secretor status51 (Figure 6C) (rs601338; P = 2.3 × 10⁻⁹). This specific variant was not present in the genotyping panel of the EIP cohort, but the locus itself was significant at the genome-wide level (Prep = 6.0 × 10⁻⁹; r² with rs601338 = 0.998). In addition, we discovered a novel association between the FUT2 locus and two Salivirus strains (P < 1.6 × 10⁻¹²). Saliviruses were discovered in 2009 in diarrheal samples and were shown to cause gastroenteritis52, although the target cell and entry mechanism are currently unknown. The lead variant was the same for both Salivirus strains (Figure 6D) and is in complete LD with the FUT2 stop mutation mentioned above (r² = 0.995), indicating that the secretor status phenotype increases the risk of Salivirus infection. Associations with both Salivirus strains were also significant in the EIP cohort (Prep < 1.9 × 10⁻⁸; Figures 6B and S6C). While the Z-scores correlate strongly between the peptides of the two Salivirus strains, neither correlate with the significant Norovirus peptide, indicating that this result is not due to cross-reactivity between these viruses (Figure S6D). Collectively, our findings highlight the pleiotropic effects of host genetic factors on humoral response against multiple viruses and support the hypothesis of antagonistic pleiotropy between infectious and autoimmune diseases.
Discussion
Here, we investigate how various non-genetic and genetic factors relate to the antibody repertoire in 900 subjects of the Milieu Intérieur cohort and 312 subjects of the EvoImmunoPop cohort. We used the PhIP-seq technology to measure blood plasma antibody reactivity against > 90,000 viral peptides of the VirScan library. We first evaluated our approach by comparing PhIP-seq scores to serostatus determined by ELISA- and Luminex-based technologies. We confirmed that the PhIP-seq assay is overall sensitive and specific for detecting a range of viruses. In the cases where the technologies disagreed, there was generally no clear separation into seropositive and seronegative individuals for the gold standard assay, and it is unclear to what degree it could serve as a positive control in those cases. Although the first VirScan study included experimental validation25, this is, to our knowledge, the most extensive validation study of the PhIP-seq technology to date.
We found a range of viral associations with age, sex, ancestry group, and smoking. Antibodies against HSV-1 and EBV, especially, increased with age, but also other herpesviruses such as HSV-2 and CMV. Enteroviruses and rhinoviruses showed the opposite relationship, where antibodies against Rhinoviruses A-C and Enteroviruses B and C decreased slowly with increased age. The differences between men and women were relatively small, although women generally had higher levels of antibodies against herpesviruses such as CMV, HHV-6A, and HHV-6B. A large number of viruses were associated with European or African descent. The strongest associations were for the herpesviruses HSV-1, CMV, HHV-6A, HHV-6B, and KSHV, which were targeted more widely in subjects of African ancestry. We also found that subjects with European or African backgrounds have antibodies targeting different proteins of EBV, even though the general reactivity to the virus does not differ between the groups. Interestingly, one of these proteins, LMP-1, shows large sequence differences between geographical regions33,34, suggesting that regional differences among EBV strains result in population differences in antibody targets. Finally, we identified a strong relationship between anti-Rhinovirus antibodies and smoking, particularly for the strains A23 and B14. This relationship was at least partially reversible, as the levels of anti-Rhinovirus antibody levels after smoking cessation decreased with time to those of never-smokers.
We also investigated the relationship between immune factors and the anti-viral antibody repertoire. We confirmed the strong effect of CMV infection on CD4+ TEMRA counts and found a positive association between anti-EBV antibodies and HLA-DR expression in the cDC1 subset. EBV has been strongly associated with the HLA haplotype in this study and others 2,4,10–13, and EBV can use the HLA surface protein as a receptor for viral entry 43. Still, previous studies have primarily focused on how EBV infection decreases HLA expression in infected B-cells, so this observed increase in HLA expression might constitute an independent mechanism. We also found an association between anti-IAV antibodies and the transcriptional response to ex vivo whole blood stimulation with live IAV. Multiple genes, including IL21, IRF5, EGR2, and CCL7, were affected, as well as the secretion of the cytokine IL-8. The association was generally positive, indicating that individuals previously infected with IAV responded more strongly. We showed that this enhanced response is not mediated by differences in cell-type composition, suggesting instead that anti-IAV antibodies, or other effectors of immunological memory, trigger a more rapid immune response in seropositive than in seronegative subjects.
Finally, we conducted a GWAS analysis on all public epitopes of the MI and EIP cohorts. We confirmed previous findings in the MHC and IGH loci and identified additional pleiotropic effects on adenoviruses, Enterovirus A, Norovirus, and Rubella virus by these loci. We also identified a strong association between the recently discovered Saliviruses and the FUT2 locus, which was previously linked to Norovirus infection, another gastroenteric virus. While very little is known about Saliviruses, this finding hints that they may use similar infection mechanisms as Norovirus.
Limitations of the Study
The study has multiple limitations. To begin with, the PhIP-seq method used throughout the study has some important caveats. While peptide coverage is broad, it is limited to linear peptides presented on the phage surface, meaning that antibodies binding to more complicated 3D structures of the protein might be missed. In addition, antibody cross-reactivity between peptides leads to uncertainty about which virus a particular result should be attributed to. Here, we used the AVARDA algorithm to circumvent this to some extent, but this can also lead to false negatives. Finally, the large number of tests required to evaluate the entire peptide library, in combination with the relatively small sample size of this cohort, likely leads to a large number of false negatives. Despite these drawbacks, we identified a range of factors related to the anti-viral antibody response. Some of these included already-known findings, which we could confirm and extend with the high resolution provided by the PhIP-seq technology. We also identified several novel factors, which we hope contribute to the steadily growing list of parameters that might impact the process of antibody generation and maintenance. Finally, we hope these findings will inspire more mechanistic studies of the antiviral immune system.
Data Availability
The PhIP-seq VirScan v.3 raw and processed data generated in this study have been deposited in the Institut Pasteur data repository, OWEY, which can be accessed via the following link: https://doi.org/10.XXXXX/owey.f83a-XXXX. The MI SNP array data can be accessed in the European Genome-Phenome Archive (EGA) with the accession code EGAS00001002460. The EIP SNP array data can be accessed in OWEY via the following link: https://doi.org/10.48802/owey.pyk2-5w22. All MI and EIP datasets can be accessed by submitting a data access request to respective data access committees (DAC). The DAC informs all the research participants of the data access request and grants data access if the request is consistent with the informed consent signed by the participants. In particular, research on MI and EIP datasets is restricted to research on the genetic and environmental determinants of human variation in immune responses. Data access is typically granted two months after request submission.
Author contributions
L.Q.-M. initiated the study. A.O., L.Q.-M., and E.P. conceived and developed the study. F.D. and B.C. prepared plasma samples. Z.T., C.P., and P.B. acquired VirScan data. A.O. performed all analyses, with contributions from A.J., M.R., and E.P. E.P. supervised all analyses. A.J. developed predictive algorithms. E.B. and M.W. generated the Luminex-based serology data. D.D. and P.B. advised on experiments. A.O. wrote the manuscript, with input from L.Q.-M. and E.P. All authors discussed the results and contributed to the final manuscript.
Author: The Milieu Intérieur Consortium†
† The Milieu Intérieur Consortium¶ is composed of the following team leaders: Laurent Abel (Hôpital Necker), Andres Alcover, Hugues Aschard, Philippe Bousso, Nollaig Bourke (Trinity College Dublin), Petter Brodin (Karolinska Institutet), Pierre Bruhns, Nadine Cerf-Bensussan (INSERM UMR 1163 – Institut Imagine), Ana Cumano, Christophe D’Enfert, Ludovic Deriano, Marie-Agnès Dillies, James Di Santo, Gérard Eberl, Jost Enninga, Jacques Fellay (EPFL, Lausanne), Ivo Gomperts-Boneca, Milena Hasan, Gunilla Karlsson Hedestam (Karolinska Institutet), Serge Hercberg (Université Paris 13), Molly A Ingersoll (Institut Cochin and Institut
Pasteur), Olivier Lantz (Institut Curie), Rose Anne Kenny (Trinity College Dublin), Mickaël Ménager (INSERM UMR 1163 – Institut Imagine), Frédérique Michel, Hugo Mouquet, Cliona O’Farrelly (Trinity College Dublin), Etienne Patin, Antonio Rausell (INSERM UMR 1163 – Institut Imagine), Frédéric Rieux-Laucat (INSERM UMR 1163 – Institut Imagine), Lars Rogge, Magnus Fontes (Institut Roche), Anavaj Sakuntabhai, Olivier Schwartz, Benno Schwikowski, Spencer Shorte, Frédéric Tangy, Antoine Toubert (Hôpital Saint-Louis), Mathilde Touvier (Université Paris 13), Marie-Noëlle Ungeheuer, Christophe Zimmer, Matthew L. Albert (Octant Biosciences), Darragh Duffy§, Lluis Quintana-Murci§,
¶ unless otherwise indicated, partners are located at Institut Pasteur, Paris
§ co-coordinators of the Milieu Intérieur Consortium Additional information can be found at: http://www.milieuinterieur.fr
Declaration of interests
The authors declare no conflict of interest.
STAR Methods
RESOURCE AVAILABILITY
Lead contact
Further information and requests for resources and reagents should be directed to and will be fulfilled by the lead contact, Etienne Patin (epatin{at}pasteur.fr)
EXPERIMENTAL MODEL AND SUBJECT DETAILS
The Milieu Intérieur cohort
The Milieu Intérieur (MI) cohort consists of 1,000 healthy adults recruited to investigate genetic and non-genetic determinants of human variation in immune responses30. Recruitment was conducted in the French city of Rennes in 2012-2013, and subjects were selected based on a large set of relatively strict inclusion and exclusion criteria described elsewhere 30. Of the 900 subjects reported in the present study, 453 are female, and 447 are male, ranging from 20 to 69 years of age. Additional cohort characteristics can be found in Table S1. The study has been approved by the Comité de Protection des Personnes — Ouest 6 (Committee for the Protection of Persons) and by the French Agence Nationale de Sécurité du Médicament (ANSM). The study protocol, including inclusion and exclusion criteria for the Milieu Intérieur study, has been registered on ClinicalTrials.gov under the study ID NCT01699893.
The EvoImmunoPop cohort
The EvoImmunoPop (EIP) cohort comprises 390 healthy adults recruited to investigate human population differences in immune responses. Recruitment was conducted in Ghent, Belgium in 2012-2013. Of the 312 subjects reported in the present study, 100 individuals reported to be of Central African descent (AFB, age range 20 to 50 years), and 212 reported to be of European descent (EUB, age range 20 to 50 years). All EUB were born in Europe, whereas >90% of AFB were born in Cameroon or the Democratic Republic of Congo. AFB and EUB present no evidence of recent genetic admixture with populations originating from another continent, besides two AFB donors who present 22% of Near Eastern and 25% of European ancestries, respectively36. All subjects were negative for serological tests against human immunodeficiency virus, hepatitis B, or hepatitis C. Additional cohort characteristics can be found in Table S2. The study has been approved by the Ethics Committee of Ghent University, the Ethics Board of Institut Pasteur (EVOIMMUNOPOP-281297), and the French authorities CPP, CCITRS, and CNIL.
METHOD DETAILS
VirScan experimental protocol
To investigate the pathogen-specific and viral peptide-specific antibody profiles in the serum of MI and EIP samples, we employed PhIP-seq using the VirScan V3 library, a pathogen-epitope scanning method based on bacteriophage display and immune-precipitation. The detailed protocol and VirScan library are described elsewhere25,27,54. In brief, a library of linear peptides of 56 amino acids was constructed to cover all UniProt protein sequences of viruses known to infect humans. Peptides were staggered along each protein sequence with an overlap of 28 amino acids. The phage library was inactivated and incubated with serum samples normalized to total IgG concentration (two replicates) and blank controls (bead samples) to form IgG-phage immunocomplexes. The immunocomplexes were later captured by magnetic beads, lysed, and sent to next-generation sequencing.
Immunoassay-based serological data
Details on the specific antigens and immunoassay methods have been described previously2. Briefly, blood was collected in serum-separating tubes, and the serum layer was extracted. Total levels of immunoglobulins IgG, IgM, IgE, and IgA were measured with a turbidimetric test on an Olympus AU400 Chemistry Analyzer. The immunoassay-based serologies were measured for IgG against the following viruses and antigens: CMV (viral lysate), HSV-1 (Glycoprotein G), HSV-2 (Glycoprotein G2), EBV (EBNA-1, VCA p18, EA-D), VZV (Lysate), IAV (Lysate), Rubella (Lysate), and Measles (Lysate).
Luminex-based serological data
MI serum samples were tested for antibodies to a broad panel of common respiratory pathogens and routine vaccine-preventable diseases using bead-based multiplex assays. A 43-plex assay was developed that included antigens for Adenovirus, Cytomegalovirus, Epstein-Barr virus, Echovirus, Enterovirus CoxB3, Hepatitis A virus, Hepatitis B virus, Hepatitis C virus, Measles, Mumps, Rubella, Norovirus, Respiratory syncytial virus, Rhinovirus, Rotavirus, Varicella-Zoster virus, Human Papillomavirus, Influenza A, Human Seasonal Coronaviruses 229E, NL63, OC43 and HKU1, and SARS-CoV-2. The proteins used were either purchased from Native Antigen (Oxford, UK), ProSpec-Tany Techno Gene (Israel), or Ray Biotech (Georgia, US). Samples were run at a final dilution of 1:200. Plates were read using the Intelliflex® technology from Luminex®, and the median fluorescence intensity was used for analysis.
Flow cytometry
The generation of the flow cytometry data is described in detail elsewhere46,55. Briefly, blood samples were collected in Li-heparin tubes and kept at 18-25 °C for maximally 6 hours before sample processing was initiated. Samples were processed on a Freedom EVO liquid handling system (Tecan Group Ltd., Switzerland). Samples were washed once and resuspended in PBS, after which 100µL aliquots were mixed with ten different eight-color antibody panels and incubated for 20 minutes at room temperature. The antibody panels are described in 46. Cells were then washed in ice-cold PBS, and red blood cells were lysed with the BD FACS lysing solution (BD, U.S.) according to the manufacturer’s protocol. Finally, samples were washed and resuspended in 240µL of PBS and then acquired on two MACSQuant flow cytometers (Miltenyi Biotec, Germany) running MACSQuantify software version 2.4.1229.1.
NanoString data
The NanoString transcript count data presented here have been described elsewhere49,56. Briefly, 1 mL of blood with 50 IU/ml Na-heparin was added to TruCulture tubes (Rules Based Medicine, U.S.) containing 2 mL of a culture medium containing live H1N1 Influenza A of the PR8 strain. One tube containing only the culture medium was used as an unstimulated control sample. All samples were incubated for 22 hours at 37°C, after which a valve was inserted into the tube to separate the cellular pellet from the supernatant. The cell pellet was resuspended in 2 mL trizol and transferred to a -80°C freezer for storage. RNA was extracted using a modified version of the NucleoSpin 96 RNA tissue kit (Macherey-Nagel, Germany) adapted to the Freedom EVO system (Tecan Group Ltd., Switzerland). Transcript counting was done using the NanoString nCounter system with the Human Immunology v2 Gene Expression CodeSet panel according to the manufacturer’s instructions.
Cytokine data
The stimulation assay and generation of the cytokine data are described in detail elsewhere (Saint-Andre et al., in press). As for the NanoString data (see above), 1 mL of blood containing 50 IU/ml Na-heparin was added to TruCulture tubes containing 2 mL of a culture medium supplanted with live H1N1 Influenza A of the PR8 strain. One tube containing only culture medium was used as an unstimulated control sample. Samples were incubated for 22 hours at 37°C, after which a valve was inserted into the tube to separate the cellular pellet from the supernatant. The supernatant was isolated and preserved at -80°C. On the day of analysis, samples were thawed, and cytokine concentrations were measured using the Luminex xMAP technology. The 13 analytes measured were CXCL5, CSF2, IFNγ, IL1β, TNFα, IL2, IL6, IL8, IL10, IL12p70, IL13, IL17, and IL23 cytokines.
Microarray genotyping
Details about SNP array genotyping of the MI cohort are available elsewhere46. Briefly, DNA was extracted from whole blood collected on EDTA using the Nucleon BACC3 genomic DNA extraction kit (catalog #: RPN8512; Cytiva, Massachusetts, USA). The 1,000 MI subjects were genotyped using the HumanOmniExpress-24 BeadChip (Illumina, U.S.), and 966 were also genotyped using the HumanExome-12 BeadChip (Illumina, U.S.). Details about SNP array genotyping of the EIP cohort are available elsewhere36. Briefly, PBMCs were isolated from blood collected into EDTA vacutainers, monocytes were removed with CD14+ microbeads, and DNA was isolated from the monocyte-negative fraction using a standard phenol/chloroform protocol, followed by ethanol precipitation. Genotyping was performed in all individuals using the HumanOmni5-Quad BeadChip (Illumina, U.S.) In addition, whole-exome sequencing was performed with the Nextera Rapid Capture Expanded Exome kit.
QUANTIFICATION AND STATISTICAL ANALYSIS
VirScan data preprocessing
The sequencing reads for the VirScan PhIP-seq assay were processed as in Mina et al., with some modifications26. Two replicates were processed for each sample to assess reproducibility. We utilized the bowtie2-samtools pipeline to map the sequencing reads of each sample to the bacteriophage library and count the number of reads for each epitope. Afterward, the positivity of each epitope in serum samples was determined by a binning strategy where counts from blank controls were first used to group the epitopes into hundreds of bins so that the reads form a uniform distribution within each bin. Then, the epitopes from serum samples were allocated into the pre-defined bins. Z-scores were calculated for each epitope from each serum sample. The means and standard deviations used for the z-score calculations were the same for each bin and were computed using the bead samples within that bin. After generating a matrix of 115,753 epitope Z-scores and 900 MI or 312 EIP samples, we discarded epitopes from bacteria, fungi, and allergens from the VirScan library, resulting in 99,460 viral epitopes. Z-score values were inverse hyperbolic sine- (arcsinh)-transformed in each sample. Contrarily to log transformation, the arcsinh function is convenient to handle both overdispersion due to outliers and zero values, which were common in the VirScan Z-score data.
Outlier epitopes were identified by leveraging replicates through the following process. First, Z-score values missing in only one replicate were set to NA in both replicates. Then, outliers in each replicate were defined as Z-scores higher than the 99.5% quantile. Next, the absolute difference in Z-scores between replicates was calculated for all epitopes with an outlier value in at least one replicate. The distribution of absolute differences is bimodal, with the lower peak representing consistent replicate Z-scores and the upper peak representing inconsistent replicate Z-scores. The local minimum between the peaks was identified using the optimize function from the stats R package, and outliers were defined as all epitopes with absolute differences above this minimum. The Z-score values of both replicates for all outlier epitopes were then set to NA. The rate of missing values was 1.06% in the MI cohort and 1.09% in the EIP cohort. Next, epitopes with >50% missing values were removed from the dataset, leaving 98,757 in the MI dataset and 98,697 in the EIP dataset. Duplicated Uniprot entries were removed, leaving 97,975 epitopes in the MI dataset and 97,923 in the EIP dataset for the remaining analyses.
Next, missing values were imputed by first running a PCA on all Z-scores using the pca function from the pcaMethods package (nPcs = 10, scale = ‘uv’), followed by imputation using the completeObs function from the same package. As individual samples were processed in batches on cell culture plates, samples were batch-corrected using the ComBat function from the sva R package, using plates as the batch variable. The final Z-scores were generated by calculating the mean of the two replicates for each subject. A peptide is considered significantly enriched if the Z-scores of both replicates are >3.5. The hit variable is defined as 1 if the peptide is enriched and 0 otherwise. To generate the list of public epitopes, the datasets were filtered on epitopes significantly enriched in >5% of test subjects for at least 2 peptides per virus.
VirScan data processing with AVARDA
Between-species antibody cross-reactivity, unequal representation of viruses in the VirScan library, and viral genome size can make epitope-level data challenging to interpret in some cases. To address these limitations and compare antibody profiles on the virus level, we applied the AVARDA algorithm 31. We applied the algorithm as described in 31, using the code available at https://github.com/drmonaco/AVARDA. Briefly, individual VirScan epitopes were aligned to a master library of all viral genetic sequences translated in reading frames using BLAST and to each other. ‘Evidence epitopes’ were VirScan epitopes that align to the master library with a bit score >80. For each virus, AVARDA calculated a maximally independent set of unrelated epitopes that explains the total reactivity towards this virus. A ‘probability of infection’ for each virus was calculated using binomial testing, comparing the ratio of the number of enriched evidence epitopes to the total number of enriched epitopes with the fractional representation of the virus in the VirScan library. Finally, cross-reactivity was evaluated by ranking all viruses based on the probability of infection. Pairs of viruses were then iteratively compared, where shared reactive epitopes were assigned to the virus with the most substantial evidence of infection based solely on non-shared epitopes. Once all epitopes were exclusively assigned to a single virus, a final probability of infection for each sample was calculated using the binomial testing procedure described above. Additionally, a breadth score was calculated, reflecting the total number of enriched epitopes of independent specificity for each virus.
Serology data preprocessing
The data preprocessing steps for the immunoassay-based serology data are described in more detail in 2. Briefly, the absorbance and emission values collected in each assay are used to call the serostatus for each blood sample. The individual cutoff values used for calling a sample positive or negative are given by the manufacturer and can be found in Table S2 of 2. For the Luminex-based serology data, the median fluorescence intensity was used directly.
Flow cytometry data preprocessing
All preprocessing steps of the flow cytometry data analysis are described in detail in46. Briefly, data files were converted to the FCS format and analyzed in FlowJo version 9.5.3 (FlowJo LLC, U.S.). Samples were gated according to supplementary figures 1-10 of 46. After quality control, the remaining variables included 79 cell counts, 87 MFI values, and three immune cell ratios. A distance-based method was used to remove 24 outlier values. Each variable was then log-transformed. A second round of outlier removal was performed, followed by imputation using the missForest R package. Finally, all variables were corrected for processing batch effects using the ComBat function from the sva R package. Finally, we filtered on samples that overlapped with the PhIP-seq data, generating a final dataset of 900 samples.
NanoString data preprocessing
The preprocessing steps used for the NanoString data are described extensively in 49. Briefly, samples were filtered based on quality control metrics suggested by the manufacturer and total counts. Three samples were removed due to transcript counts <100,000. Using internal positive controls, expression values were normalized to correct for differences in reagent chemistries used for different batches and differences between stimulation conditions. An additional sample filtering step was applied within the IAV stimulation condition. Samples were removed if they were outliers in terms of the mean count of all gene probes or the mean count of positive control probes. Two samples fulfilled both conditions and were removed. A similar filtering step to identify samples with low RNA counts used the difference between the mean of all probes of a single sample and the mean of all samples within the same condition. Eleven samples had a difference larger than 2 and were removed to generate a dataset of 986 donors. Next, a gene probe was classified as absent in a sample if its expression value was below the mean + 2 SDs of six negative control probes. For 24 gene probes, expression was absent in >90% of all samples, and they were removed from the dataset. Finally, only samples also present in the PhIP-seq data were retained, leaving gene expression data for 560 transcripts in 889 samples for analysis.
Cytokine data preprocessing
The data preprocessing used for the cytokine data is described in more detail in 57. Briefly, samples were analyzed according to CLIA guidelines, where the least detectable dose (LDD) was determined by averaging the values from 200 blank runs and adding three standard deviations. The lower limit of quantification (LLOQ) was set from the standard curve for each analyte and defined as the lowest concentration that can be reliably detected and where the total error meets the CLIA requirements for laboratory accuracy. The lower assay limit (LAL) is the lowest value for each analyte after applying the standard curve and curve-fitting algorithms.
Values below the LAL were replaced with a value of 50% of the lowest value measured in the dataset. The dataset was filtered for samples also present in the PhIP-seq data, generating a final dataset of 868 samples.
Genotyping data preprocessing - Milieu Intérieur
The genotyping data preprocessing of the MI cohort is described in detail in 46. After quality control filters, the SNP array data sets from the two genotyping platforms were merged. SNPs that were discordant in genotypes or position were removed, yielding a final data set containing 732,341 genotyped SNPs. The data set was then phased using SHAPEIT2 and imputed using IMPUTE v.2, with 1-Mb windows and a buffer region of 1Mb. After imputation, SNPs with an information metric ≤ 0.8, duplicated SNPs, SNPs with a missingness of >5%, and SNPs with a minor allele frequency of ≤5% were removed, generating a final data set of 5,699,237 SNPs. 13 subjects were removed based on relatedness and admixture46. Finally, the data set was converted to GRCh38 using the LiftoverVcf function from the GATK software package 58.
Genotyping data preprocessing - EvoImmunoPop
A more complete description of the genotyping data preprocessing steps can be found in 36. The SNP array genotyping and whole-exome sequencing data were processed separately and merged. For the SNP array data, SNPs were passed through multiple QC filters, and SNPs originating from the sex chromosomes were removed. For the whole-exome sequencing data, reads were processed according to the GATK Best Practices. Discordant variants between the two datasets were removed before merging the SNP array and whole-exome sequencing data sets. After combining the two datasets, the data was phased using SHAPEIT2 and imputed using IMPUTE v.2, with 1-Mb windows and a buffer region of 1 Mb. After imputation and additional QC filtering, 19,619,457 SNPs remained. The data set was converted to GRCh38 using the LiftoverVcf function from the GATK software package 58. Finally, four subjects were removed based on relatedness and admixture36.
PhIPseq - phenotype association tests
All the statistical associations presented here were tested by building multiple regression models. In all models, the dependent variable was either an AVARDA breadth score (for a given virus) or a VirScan Z-score (for a given peptide). The independent variable could either be (i) serological measurements based on ELISA and the Luminex xMAP assays; (ii) intrinsic factors, including age and sex; (iii) ancestry and continent of birth; (iv) candidate non-genetic factors, including smoking, diet, past diseases, vaccination history, health biomarkers and anthropometric measures; or (v) immunity-related data, including white blood cell counts, immune gene expression and cytokine production. As described below, the specific model and complete list of covariates used differed depending on the independent variables tested.
A linear model is applied using the lm R function when the independent variable is continuous or binary. The beta value is used to determine the effect size of the independent variable. When the independent variable was categorical with more than two levels, an ANCOVA model was applied using the aov R function. The η2 was used as the effect size, calculated by the etaSquared function from the lsr R package. In the MI cohort, when using sex as the independent variable of interest, only age was used as a covariate, and vice versa. All subjects in the MI cohort have immediate ancestry from France, so ancestry was not used as a covariate in these analyses. In the analyses of all other independent variables, age, and sex were always included as covariates. In addition, for the analysis of the cytokine and gene expression phenotypes, the peripheral blood cell frequencies of 15 significant immune cell populations were included as covariates because we searched for effects of antibody repertoire on the immune response that are direct, i.e., that are not mediated by blood cell composition. The only analyzed independent variables for the EIP cohort were age and ancestry/continent of birth. When age was used as the metadata variable of interest, ancestry was controlled for, and vice versa. As all subjects in the EIP cohort are males, sex was not used as a covariate in these analyses.
GWAS of the anti-viral antibody repertoire
GWAS was conducted on the asinh-transformed VirScan Z-scores in the MI and EIP cohorts. SNPs with a MAF < 5% and SNPs deviating significantly from Hardy-Weinberg equilibrium were removed (P < 10-10, calculated using the HWExact function from the GWASExactHW R package.). The specific covariates used differed between the two cohorts. To correct for population stratification, a principal component analysis was run on all SNPs separately for both cohorts, and the first two principal components were included as covariates. Age was also included as a covariate for both cohorts. Additionally, sex was included as a covariate in the MI cohort, as well as a curated list of 15 major peripheral blood immune cell frequencies. The ancestry group was included as an additional covariate for the EIP cohort. The GWAS analyses were conducted using the assocRegression function from the GWASTools R package, using a linear model as the model type and an additive model for the genotype. Manhattan plots, locusZoom plots, and tables were all made using the topr R package.
Acknowledgments
We acknowledge the help of the HPC Core Facility of Institut Pasteur for this work. A.O. is funded by a grant from the Wenner-Gren Foundation. This work benefited from the support of the French government’s program ‘Investissement d’Avenir’, managed by the Agence Nationale de la Recherche (reference 10-LABX-69-01).
References


