medRxiv
  • Home
  • About
  • Submit
  • ALERTS / RSS
Advanced Search

Assessing Causal Relationships Between Diabetes Mellitus and Idiopathic Pulmonary Fibrosis

View ORCID ProfileSamuel Moss, View ORCID ProfileCosetta Minelli, View ORCID ProfileOlivia Leavy, View ORCID ProfileRichard Allen, View ORCID ProfileNick Oliver, View ORCID ProfileLouise Wain, View ORCID ProfileGisli Jenkins, View ORCID ProfileIain Stewart
doi: https://doi.org/10.1101/2024.01.04.24300827
Samuel Moss
1Margaret Turner Warwick Centre for Fibrosing Lung Disease, National Heart and Lung Institute, Imperial College London, London, UK
  • Find this author on Google Scholar
  • Find this author on PubMed
  • Search for this author on this site
  • ORCID record for Samuel Moss
  • For correspondence: s.moss21{at}imperial.ac.uk
Cosetta Minelli
2Department of Genomic and Environmental Medicine, National Heart and Lung Institute, Imperial College London, London, UK
  • Find this author on Google Scholar
  • Find this author on PubMed
  • Search for this author on this site
  • ORCID record for Cosetta Minelli
Olivia Leavy
3Department of Population Health Sciences, University of Leicester, Leicester, UK
4NIHR Leicester Biomedical Research Centre, Leicester, UK
  • Find this author on Google Scholar
  • Find this author on PubMed
  • Search for this author on this site
  • ORCID record for Olivia Leavy
Richard Allen
3Department of Population Health Sciences, University of Leicester, Leicester, UK
4NIHR Leicester Biomedical Research Centre, Leicester, UK
  • Find this author on Google Scholar
  • Find this author on PubMed
  • Search for this author on this site
  • ORCID record for Richard Allen
Nick Oliver
5Department of Metabolism, Digestion and Reproduction, Imperial College London, London, United Kingdom
  • Find this author on Google Scholar
  • Find this author on PubMed
  • Search for this author on this site
  • ORCID record for Nick Oliver
Louise Wain
3Department of Population Health Sciences, University of Leicester, Leicester, UK
4NIHR Leicester Biomedical Research Centre, Leicester, UK
  • Find this author on Google Scholar
  • Find this author on PubMed
  • Search for this author on this site
  • ORCID record for Louise Wain
Gisli Jenkins
1Margaret Turner Warwick Centre for Fibrosing Lung Disease, National Heart and Lung Institute, Imperial College London, London, UK
  • Find this author on Google Scholar
  • Find this author on PubMed
  • Search for this author on this site
  • ORCID record for Gisli Jenkins
Iain Stewart
1Margaret Turner Warwick Centre for Fibrosing Lung Disease, National Heart and Lung Institute, Imperial College London, London, UK
  • Find this author on Google Scholar
  • Find this author on PubMed
  • Search for this author on this site
  • ORCID record for Iain Stewart
  • Abstract
  • Full Text
  • Info/History
  • Metrics
  • Preview PDF
Loading

Abstract

Rationale Idiopathic Pulmonary Fibrosis (IPF) is a disease of progressive lung scarring. There is a known association between IPF and diabetes mellitus (DM), but it is unclear whether this association is due to causal relationships between these traits.

Objectives To examine causal relationships between DM, diabetes-associated traits, and IPF using a Mendelian randomisation approach.

Methods Following a two-sample Mendelian randomisation (MR) approach, we used genetic variants identified from genome wide association studies (GWAS) for type 1 diabetes (T1D), type 2 diabetes (T2D), glycated haemoglobin level (HbA1c), fasting insulin level, and body mass index (BMI) to assess for evidence of causal effects of these traits on IPF risk. Further analyses using pleiotropy-robust and multivariable MR methods were performed to account for the inherent complexity of the traits being investigated.

Results Results did not suggest that either T1D (OR = 1.00, 95% CI: 0.93-1.07, p = 0.902) or T2D (OR = 1.02, 95% CI: 0.93-1.11, p = 0.692) are in the causal pathway of IPF. No significant effects were suggested of HbA1c (OR = 1.19, 95% CI: 0.63-2.22, p = 0.592) or fasting insulin level (OR = 0.60, 95% CI: 0.31-1.15, p = 0.124) on IPF risk, but effects of BMI on IPF risk were indicated (OR = 1.44, 95% CI: 1.12-1.85, p = 0.004).

Conclusion This study suggests that DM and IPF are unlikely to be causally linked. This comorbid relationship may instead be driven by shared risk factors or treatment effects.

Key messages What is already known on this topic: Idiopathic pulmonary fibrosis is associated with diabetes mellitus epidemiologically, but it is unclear if these traits are linked by causal effects.

What this study adds: Idiopathic pulmonary fibrosis and diabetes mellitus are unlikely to be causally linked, suggesting that shared environmental risk factors or treatment effects may drive this comorbid relationship.

How this study might affect research, practice, or policy: Further research investigating the relationship between diabetes mellitus and idiopathic pulmonary fibrosis should focus on potential shared risk factors such as smoking, and treatment effects including corticosteroid use.

Introduction

Idiopathic pulmonary fibrosis (IPF) is a chronic disease characterised by progressive and uncontrolled scarring of the lung. The development of fibrosis in IPF reduces lung function over time and is typically fatal within 3-5 years of diagnosis1,2. The mechanisms underlying IPF risk and progression are not fully understood.

Diabetes mellitus (DM) is a group of diseases characterised by hyperglycemia due to disrupted insulin production, reduced effectiveness of secreted insulin, or a combination of both3. Over 400 million people have DM globally and incidence has been shown to be increasing4. Type 1 diabetes is caused by autoimmune destruction of pancreatic beta cells and subsequent insulin deficiency5. Type 2 diabetes (T2D) is a long-term condition characterised by insulin resistance, dysregulation of blood glucose levels, and a progressive decline in beta cell function6. Studies show increased prevalence of DM in IPF patients when compared with controls7–9 and comorbid DM has been shown to be associated with increased mortality in IPF patients10. As current studies assessing this association have primarily used mixed DM cohorts it is unclear if prevalence of DM in IPF patients varies with DM subtype. Furthermore, decreased lung function has been reported in DM cohorts and is correlated with having glucose above target11–13.

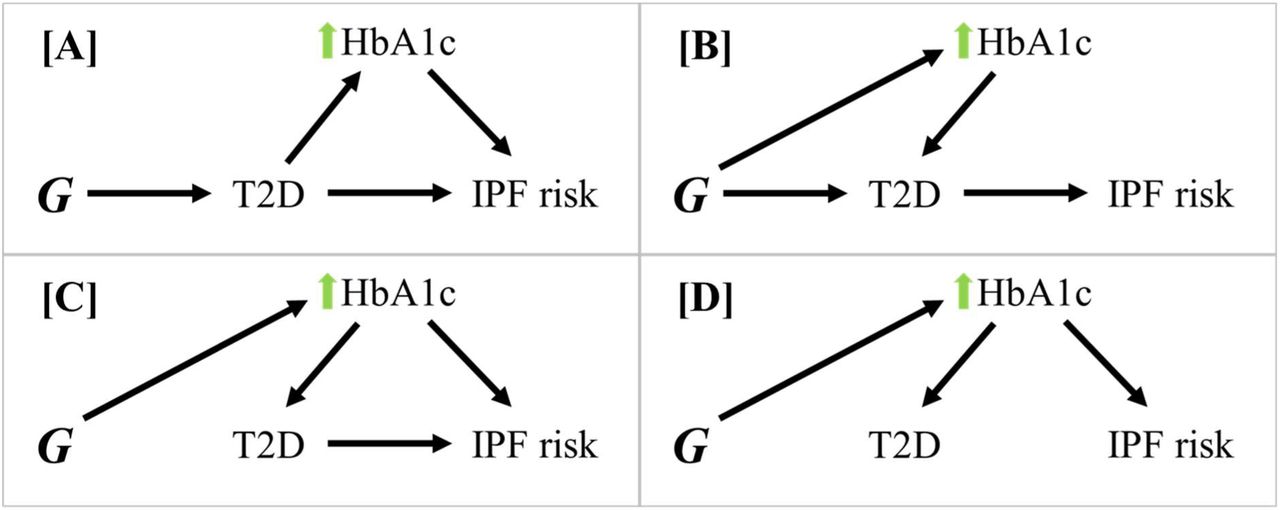
The potential mechanisms by which DM may be associated with IPF risk are complex. Hyperglycemia has been linked to immune dysfunction, chronic low-grade inflammation, increased infection rate14,15, and worse immune-related clinical outcomes in critically ill patients14–16, with outcomes improving with optimised glycemic control16–18. Immune dysregulation has a key role in fibrogenesis19,20; similarly, hyperglycemia may contribute to IPF risk through impaired DNA repair mechanisms and subsequent increase of cellular senescence21–23. The potential relationship between T2D and IPF is further complicated by metabolic factors becoming dysregulated both due to T2D and during disease development. Factors such as chronic hyperglycaemia, obesity, and hyperinsulinemia contribute to the development of T2D24–26 and may therefore independently drive IPF pathogenesis (Figure 1).

Figure 1:
  • Download figure
  • Open in new tab
Figure 1: Directed acyclic graphs (DAG) showing potentially interacting pathways of effect on IPF risk.

Let G be the genetic instrument being used to estimate causal effect on IPF risk. [A] Any effects of G on the causal pathway between T2D and IPF (such as raised HbA1c downstream of T2D) act through T2D, therefore not resulting in confounding effects. [B] Any pleiotropic effects on HbA1c do not influence IPF risk. Effects through this pathway are valid, but the continuous HbA1c exposure may be a stronger instrument for this effect [C]. Effects of G on T2D acting through HbA1c also increase IPF risk independently of T2D (horizontal pleiotropy) and invalidate the independence assumption. [D] Effects of G on T2D act through HbA1c, but HbA1c influences IPF risk independently of T2D, also invalidating the independence assumption.

Mendelian randomisation (MR) studies aim to assess the extent of causal relationships between modifiable disease risk factors or exposures and a disease or disease-related outcome. MR methods typically use germline genetic variants as instruments for the exposure of interest, therefore allowing for control of environmental effects that could confound observational studies. Effective causal estimation and control of confounding requires genetic instruments that are: (1) reliably associated with the exposure; (2) only associated with the outcome through the exposure; (3) independent of confounders that influence both the exposure and outcome27–30. Horizontal pleiotropy, the phenomenon of genetic instruments influencing the outcome through pathways independent of the exposure of interest31, can confound causal estimation in MR and violates assumptions (2) and (3).

The aim of this study was to estimate the causal effect of both T1D and T2D (exposure) on IPF risk (outcome) using a two-sample MR approach. Additional univariable and multivariable MR analyses were performed to assess the causal effects on IPF risk of continuous exposures representing main factors associated with DM – Raised blood glucose (raised HbA1c level), dysregulated insulin (raised fasting insulin level), and obesity (raised BMI). As a secondary analysis, we also investigated the presence of a causal effect in the opposite direction, that is the effect of IPF on DM risk (Supplementary Analyses 1 and 2).

Methods

Study populations

Genetic association statistics were retrieved from genome-wide association studies (GWAS) of T1D32 (6,683 European ancestry cases, 12,173 European ancestry controls, 2,601 European ancestry affected sibling pair families, 69 European ancestry trios), T2D33 (61,714 European ancestry cases, 1,178 Pakistani ancestry cases, 593,952 European ancestry controls, 2,472 Pakistani ancestry controls), IPF risk34 (4,125 European ancestry cases, 20,464 European ancestry controls), HbA1c level35 (sample size: 88,355 of European ancestry), fasting insulin level36 (sample size: 151,013 of European ancestry), and BMI37 (sample size: 681,275 of European ancestry). A secondary analysis of T2D on IPF was performed using data from a GWAS of only European ancestry participants38 (12,931 European ancestry cases, 57,196 European ancestry controls) (Supplementary Analysis 1). An additional sensitivity analysis of HbA1c on IPF used a subset of functionally glycemic (associated with glycemic traits as defined by Wheeler et al. (2017) 35) HbA1c variants (supplementary analysis 2).

No participants in the HbA1c or fasting insulin GWAS cohorts had a diagnosis of diabetes.

Genetic instrument selection

Genetic instruments were required to be associated with each exposure at genome-wide significance level (p<5×10⁻⁸). A clumping approach was used to select independent signals (r2 < 0.001 within a 10,000 kb window) using the 1000 Genomes Project reference panel through ieugwasr39. All genetic variants were required to be sufficiently strong instruments (F>10) for each exposure to avoid weak instrument bias. Any missing variants in the outcome datasets were replaced with suitable proxies (R2>0.7) where available, using LDlinkR40.

Statistical analyses

A random-effects inverse-weighted (IVW-RE) MR method41,42 was used to estimate the overall effect of each exposure on outcomes using the MendelianRandomization R package. MR-Egger43 and weighted median44 (MR-WM) MR methods were used here to provide pleiotropy-robust causal estimates in a sensitivity analysis. MR-Egger uses meta-regression to estimate causal effects adjusted for directional pleiotropy, whereas MR-WM allows for pleiotropic effects in up to 50% of instruments. MR-PRESSO45 and MR-Lasso46 extensions of the IVW method were used to identify and remove likely pleiotropic genetic instruments. MR-PRESSO identifies likely pleiotropic instruments through variant contribution to heterogeneity in the IVW meta-analysis of variant-specific MR estimates, whereas MR-Lasso includes an intercept term to estimate genetic effects bypassing the risk factor of interest. All univariable MR methods, other than MR-PRESSO, have multivariable equivalents that were applied in MVMR (MVMR-IVW47,48, MVMR-Median49, MVMR-Egger50, MVMR-Lasso49).

Results

Selection of genetic instruments

Thirty-five genetic variants were selected as instruments for T1D, and 118 genetic variants were selected as instruments for T2D. Genetic instrument sets were similarly identified for HbA1c level (37 variants), fasting insulin (36 variants), and BMI (131 variants). All selected variants for these exposures had corresponding GWAS summary results for IPF.

Estimation of causal effects

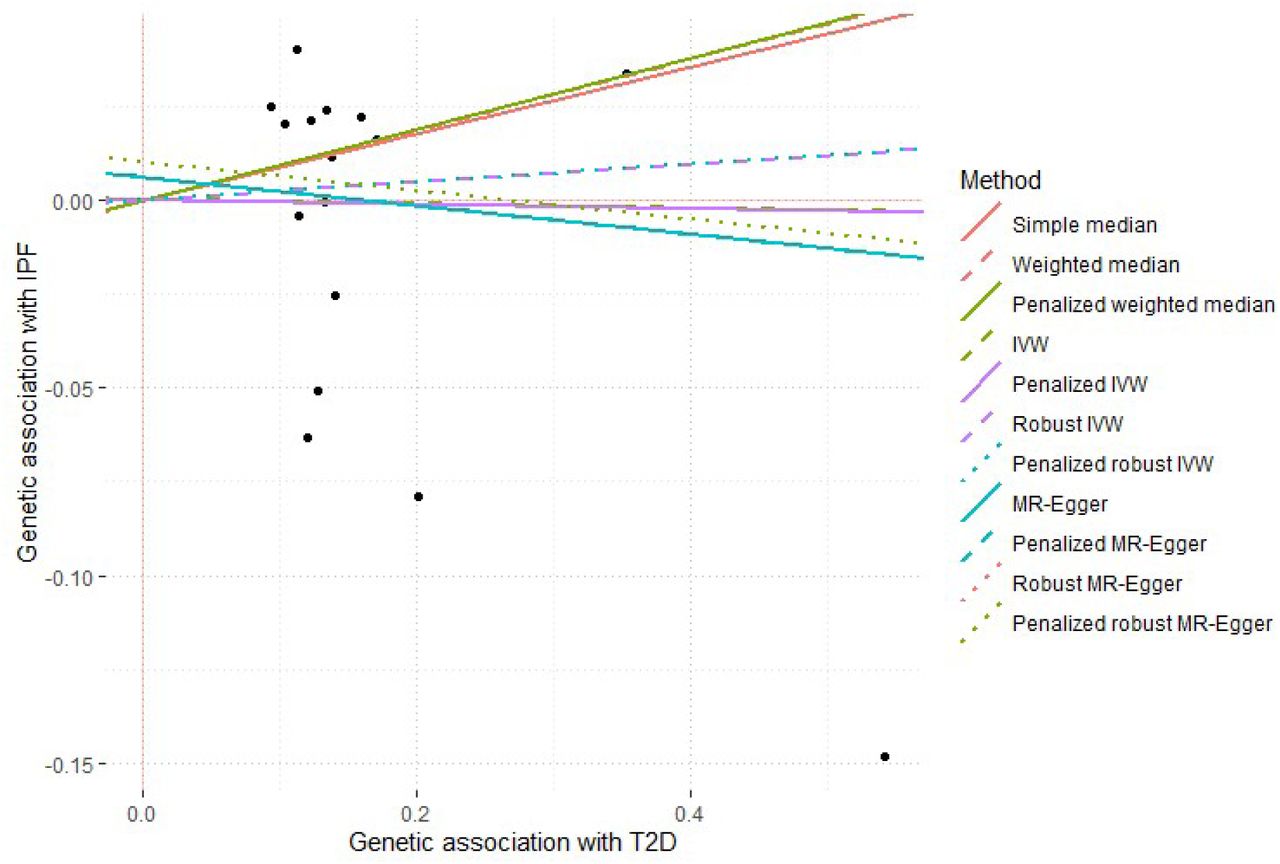
No significant causal effect was suggested of T1D on IPF risk (IVW-RE, Odds Ratio (OR) = 1.00, 95% Confidence Interval (95% CI): 0.93-1.07, p = 0.902). MR estimates similarly did not suggest significant causal effects of T2D on IPF risk (IVW-RE, OR = 1.02, 95% CI: 0.93-1.11, p = 0.692). While there was statistically significant heterogeneity present analyses of T1D on IPF (Q = 65.56, p < 0.01, I2 = 48.1%), and of T2D on IPF (Q = 148.43, p = 0.03, I2 = 21.2%), results from pleiotropy-robust MR methods were consistent with those of IVW-RE (Figure 2 and Figure 3). Further, removal of likely pleiotropic variants reduced heterogeneity scores in analyses of T1D on IPF (MR-Lasso, Q = 33.22, p = 0.360, I2 = 6.7%), and T2D on IPF (MR-Lasso, Q = 105.43, p = 0.605, I2 = 0%), but MR estimates were consistent with the IVW-RE approach.

Figure 2:
  • Download figure
  • Open in new tab
Figure 2: Overall causal estimates of T1D on IPF risk estimated using different MR approaches.

Error bars show 95% confidence intervals.

Figure 3:
  • Download figure
  • Open in new tab
Figure 3: Overall causal estimates of T2D on IPF risk estimated using different MR approaches.

Error bars show 95% confidence intervals.

No causal effect of IPF on T2D (Supplementary Analysis 3) or T1D (Supplementary Analysis 4) was identified when the MR approach was applied in this direction.

Estimation of causal effects using continuous exposures

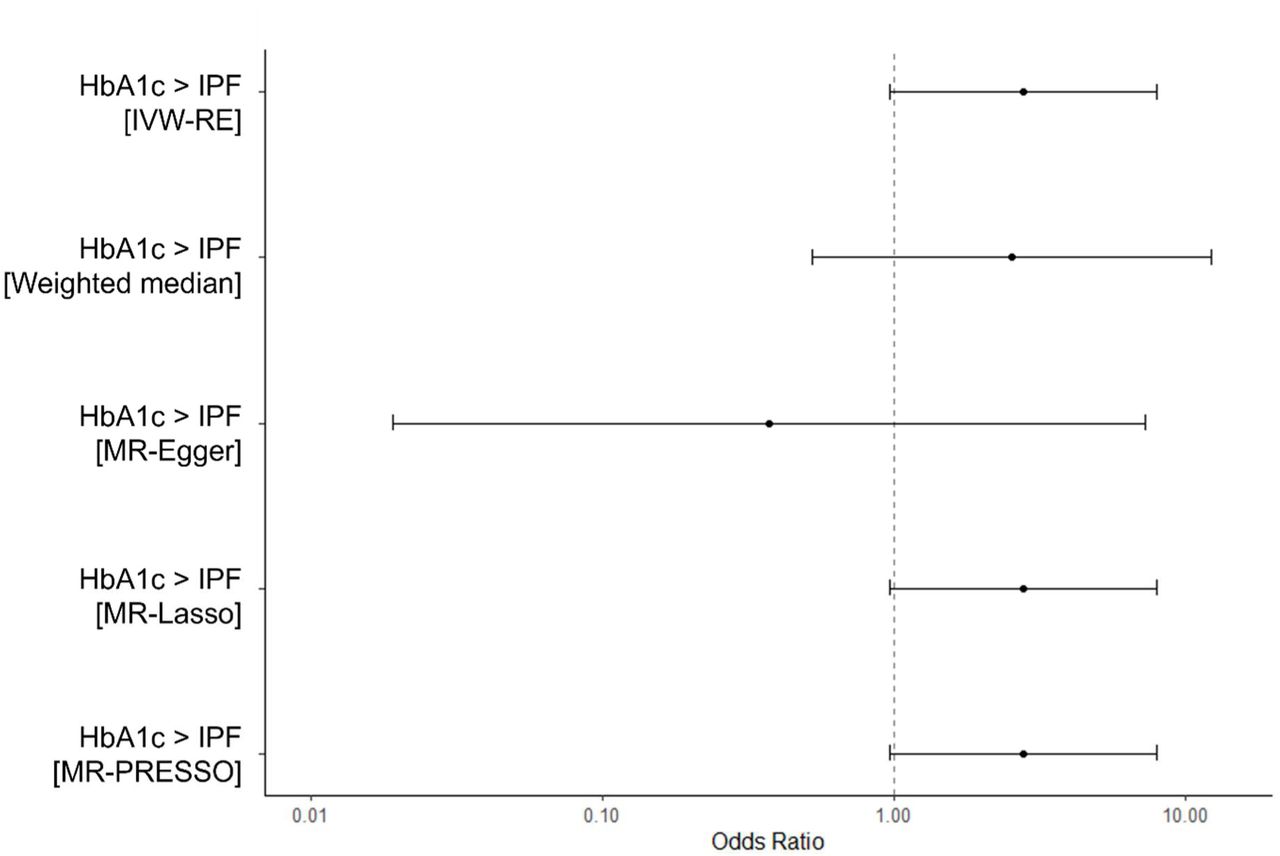
We found no evidence suggesting that genetically proxied raised HbA1c causes IPF (IVW-RE, OR = 1.19, 95% CI: 0.63-2.22, p = 0.592). Results of MVMR analyses did not suggest any independent effects of T2D (MV-IVW, OR = 1.03, 95% CI: 0.92-1.15, p = 0.601) or raised HbA1c (MV-IVW, OR = 1.14, 95% CI: 0.52-2.52, p = 0.746) on IPF risk. Estimates calculated using pleiotropy-robust methods were consistent across univariate and MVMR analyses (Figure 4A and Figure 5A). Outcomes from the MR analysis of HbA1c on IPF using a subset of only glycemic HbA1c variants were consistent with outcomes of main HbA1c analyses (Supplementary Analysis 2).

Figure 4:
  • Download figure
  • Open in new tab
Figure 4:
  • Download figure
  • Open in new tab
Figure 4: Causal estimates from univariable MR analyses of T2D-associated continuous exposures on IPF risk.

[A] Causal estimates of genetically proxied raised HbA1c level on IPF risk. [B] Causal estimates of genetically proxied raised fasting insulin (F-insulin) level on IPF risk. [C] Causal estimates of genetically proxied raised BMI on IPF risk. Odds ratios were calculated from beta estimates. Error bars show 95% confidence intervals.

Figure 5:
  • Download figure
  • Open in new tab
Figure 5:
  • Download figure
  • Open in new tab
Figure 5: Causal estimates from multivariable MR analyses of T2D, and T2D-associated continuous exposures on IPF risk.

[A] Independent causal estimates of T2D and genetically proxied raised HbA1c level on IPF risk. [B] Independent causal estimates of T2D and genetically proxied raised fasting insulin (F-insulin) level on IPF risk. [C] Independent causal estimates of T2D and genetically proxied raised BMI on IPF risk.

No causal effects were found of genetically proxied raised fasting insulin level on IPF risk (IVW-RE, OR = 0.60, 95% CI: 0.31-1.15, p = 0.124). Results of main MVMR analyses did not suggest any independent effects of T2D (MVMR-IVW, OR = 1.02, 95% CI: 0.94-1.12, p = 0.611) or raised fasting insulin (MVMR-IVW, OR = 0.69, 95% CI: 0.36-1.36, p = 0.285) on IPF risk. An independent protective effect of raised fasting insulin was indicated by MVMR-Egger results (OR = 0.37, 95% CI: 0.14-0.97, p = 0.044), however these results were not supported by MVMR-IVW, MVMR-Median, or MVMR-Lasso analyses so are unlikely to represent a genuine causal relationship (Figure 5B).

Estimates obtained by IVW-RE suggested a causal effect of raised BMI on IPF risk (IVW-RE, OR = 1.44, 95% CI: 1.12-1.85, p = 0.004), and MR-PRESSO did not suggest presence of pleiotropy (no outliers). The IVW-RE results were supported by MR-Lasso (OR = 1.35, 95% CI: 1.07-1.71, p = 0.011). MR estimates from weighted median (OR = 1.26, 95% CI: 0.87-1.81, p = 0.225) and MR-Egger methods (OR = 1.38, 95% CI: 0.71-2.70, p = 0.342) were concordant with IVW-RE but were not statistically significant, which may be due to the lower statistical power of these methods44. Results of MVMR analyses did not suggest any independent effects of T2D (MVMR-IVW, OR = 0.91, 95% CI: 0.68-1.21, p = 0.508) or raised BMI (MVMR-IVW, OR = 1.01, 95% CI: 0.94-1.09, p = 0.816) on IPF risk. Estimates obtained using pleiotropy-robust methods were consistent with those of MVMR-IVW (Figure 5C).

Discussion

The results of this study suggest that DM is unlikely to be in the causal pathway of IPF, either independently (T1D, T2D) or through related factors (raised HbA1c and fasting insulin). A significant positive effect was suggested of BMI on IPF, but this effect did not persist in MVMR analyses of T2D on IPF with BMI as a secondary exposure.

Using T2D as an exposure in MR has limitations including instrumentation of a binary exposure based on a threshold of an underlying continuous variable, and potential confounding from related risk factors. To address these limitations additional two-sample MR analyses were performed with continuous exposures aiming to represent main factors associated with T2D – blood glucose (HbA1c level), dysregulated insulin (fasting insulin level), and obesity (BMI). The use of MR to investigate the relationship between T2D and IPF is limited by the complexity of both traits. The use of underlying continuous exposures and pleiotropy-robust methods, aimed to address this complexity. Further, a multivariable MR approach (MVMR) was performed to distinguish the independent effects of these correlated exposures (T2D, HbA1c, fasting insulin, and BMI). The inclusion of MVMR analyses of DM-associated factors therefore investigates potential causal pathways between DM and IPF in a more targeted and comprehensive approach. This study did not suggest causal effects through any of the investigated pathways, but interacting mechanisms between DM and IPF may have non-linear effects, which would not be represented in the MR approaches applied here. Further, causal effects across diseases may only exist in a subset of individuals or when in combination with additional genetic traits or environmental factors.

The lack of causal effects in either direction between T2D and IPF risk are consistent with the findings of another recent study51. Compared to this previous study, our investigation provides a more comprehensive assessment of possible causal pathways by targeting specific pathways between DM and IPF. Use of HbA1c instruments has been demonstrated to be superior to diabetes instruments in strength and variance explained52, and enables further insights into potential interacting disease mechanisms with less potential for confounding. Inclusion of HbA1c and T2D as exposures therefore strengthens our study. The null effects of raised HbA1c on IPF disease risk do not align with previously proposed mechanisms of systemic hyperglycemia promoting lung fibrosis through disrupted DNA repair and increased senescence21,53. Our study also included an MR analysis of T1D to assess possible effects specific to this form of DM.

The comorbid relationship between DM and IPF may result from shared factors affecting both traits, rather than directly causative effects. For example, T2D and IPF share risk factors such as smoking and ageing54,55. Results of univariable MR analyses suggested a positive effect of BMI on IPF risk, however no independent effects of T2D or BMI on IPF were indicated by MVMR results. A previous study has suggested that IPF patients are generally normally nourished or obese56, but lower BMI is associated with poorer disease outcomes57,58. Given the complexity of factors contributing to BMI, the pathway by which BMI could influence IPF risk is unclear. It is therefore difficult to rule out potential confounding driven by shared upstream factors and uncertain if any effect of BMI could underlie the association between DM and IPF. Alternatively, factors such as shortened telomere length may independently drive both IPF and T2D. Shorter telomere length, which has been shown to be a causative factor in IPF59, is associated with diabetes progression60, insulin resistance61 and increased HbA1c level62,63, obesity64,65, and telomere attrition is predicted to drive pancreatic beta cell dysfunction66. As telomere length also decreases with increased age and cigarette smoking67,68, this may also explain shared associations of these risk factors with T2D and IPF. Further, potential interaction of treatments across diseases may exist. IPF patients experiencing acute exacerbations are routinely treated with corticosteroids69, which promote hyperglycemia and diabetes70,71. Similarly, metformin, which is the first line oral therapy for the treatment of type 2 diabetes72, has been suggested to resolve lung fibrosis in cellular and animal models73–75 which may suggest the presence of shared disease pathways.

The findings of this study suggest that the comorbid relationship between DM and IPF is not driven by causative effects of either disease. Intrinsic mechanisms upstream of both traits and environmental effects may underlie this comorbid relationship. Shared mechanisms independently driving both traits may highlight opportunities for intervention and warrant further investigation.

Data availability

Summary results for the GWAS of IPF risk were requested through the collaborative genetic studies of idiopathic pulmonary fibrosis GitHub page: (https://github.com/genomicsITER/PFgenetics). Summary data for all other GWAS studies were retrieved from GWAS catalog (https://www.ebi.ac.uk/gwas/).

Funding

RGJ is supported by a National Institute for Health Research (NIHR) Research Professorship (NIHR reference RP-2017-08-ST2-014). LVW, RJA, and RGJ are supported by MRC Programme grant MR/W014491/1.

Conflicts of interest

RGJ is a trustee of Action for Pulmonary Fibrosis and reports personal fees from Astra Zeneca, Biogen, Boehringer Ingelheim, Bristol Myers Squibb, Chiesi, Daewoong, Galapagos, Galecto, GlaxoSmithKline, Heptares, NuMedii, PatientMPower, Pliant, Promedior, Redx, Resolution Therapeutics, Roche, Veracyte and Vicore. LVW reports current and recent research funding from GSK, Genentech and Orion Pharma, and consultancy for Galapagos. N.O has received research funding from Dexcom and Roche Diabetes, and is a member of advisory boards for Dexcom, Roche, and Medtronic

Supplement

Supplementary analysis 1: An MR analysis of T2D on IPF using GWAS of European ancestry only

Methods

Main MR analyses used the largest disease-targeted GWAS of T2D by Xue et al (2018)33. A limitation of this dataset was the mixed ancestry cohort used, where the IPF GWAS cohort was European ancestry only. As sensitivity analysis, a two-sample MR analysis of T2D on IPF was performed using a European ancestry GWAS of T2D38 (12,931 European ancestry cases, 57,196 European ancestry controls).

Results

Results using European ancestry GWAS were consistent with main analyses, suggesting a null effect of T2D on IPF (IVW-RE, OR = 0.99, 95% CI: 0.89-1.11, p = 0.916) (Supplementary Figure 1)

Supplementary analysis 2: An MR analysis of HbA1c on IPF risk with only functionally glycemic HbA1c genetic variants

Methods

A two-sample MR analysis was performed to assess for evidence of causal effects of HbA1c on IPF using only glycemic HbA1c variants (associated with glycemic traits, p < 0.0001). 12 independent genetic variants significantly (p<5×10⁻⁸) associated with HbA1c level were identified from a recent GWAS35 (sample size: 88,355 of European ancestry).

Results

Results of MR analyses of HbA1c (glycemic variants only) on IPF did not suggest that raised HbA1c causes IPF (IVW-RE, OR = 2.78, 95% CI: 0.97-8.02, p = 0.058). Results from pleiotropy-robust methods were consistent with IVW-RE estimates (Supplementary Figure 2).

Supplementary analysis 3: Secondary analysis assessing for causal effects of IPF on T2D

Methods

A two-sample MR analysis was performed to assess for evidence of causal effects of IPF on T2D. Nineteen independent genetic variants significantly (p<5×10⁻⁸) associated with IPF risk were identified from a recent GWAS34 (4,125 IPF cases, 20,464 controls). Nine genetic instruments were found to be missing from the T2D GWAS study used in main analyses, with no available proxies (R2 > 0.7) shared across both exposure and outcome GWAS. Sensitivity MR analyses were performed using a different T2D GWAS study containing all 19 IPF variants76 (12,931 European ancestry cases, 57,196 European ancestry controls) to that.

Results

Results of MR analyses (9 IPF instruments) of IPF on T2D did not suggest that IPF causes T2D (IVW-RE, OR = 1.00, 95% CI: 0.97-1.03, p = 0.795). Results from pleiotropy-robust methods were consistent with IVW-RE estimates (Supplementary Figure 2). Results from sensitivity analyses using all 19 IPF variants as exposure instruments were consistent previous estimates using 9 IPF variants (IVW-RE, OR = 0.97, 95% CI: 0.93-1.01, p = 0.176) (Supplementary Figure 3)

Supplementary analysis 4: Secondary analysis assessing for causal effects of IPF on T1D

Methods

A two-sample MR analysis was performed to assess for evidence of causal effects of IPF on T1D. 19 independent genetic variants significantly (p<5×10⁻⁸) associated with IPF risk were identified from a recent GWAS34 (4,125 IPF cases, 20,464 controls). 14 genetic instruments were found to be missing from the T2D GWAS study used in main analyses, with no available proxies (R2 > 0.7) shared across both exposure and outcome GWAS.

Results

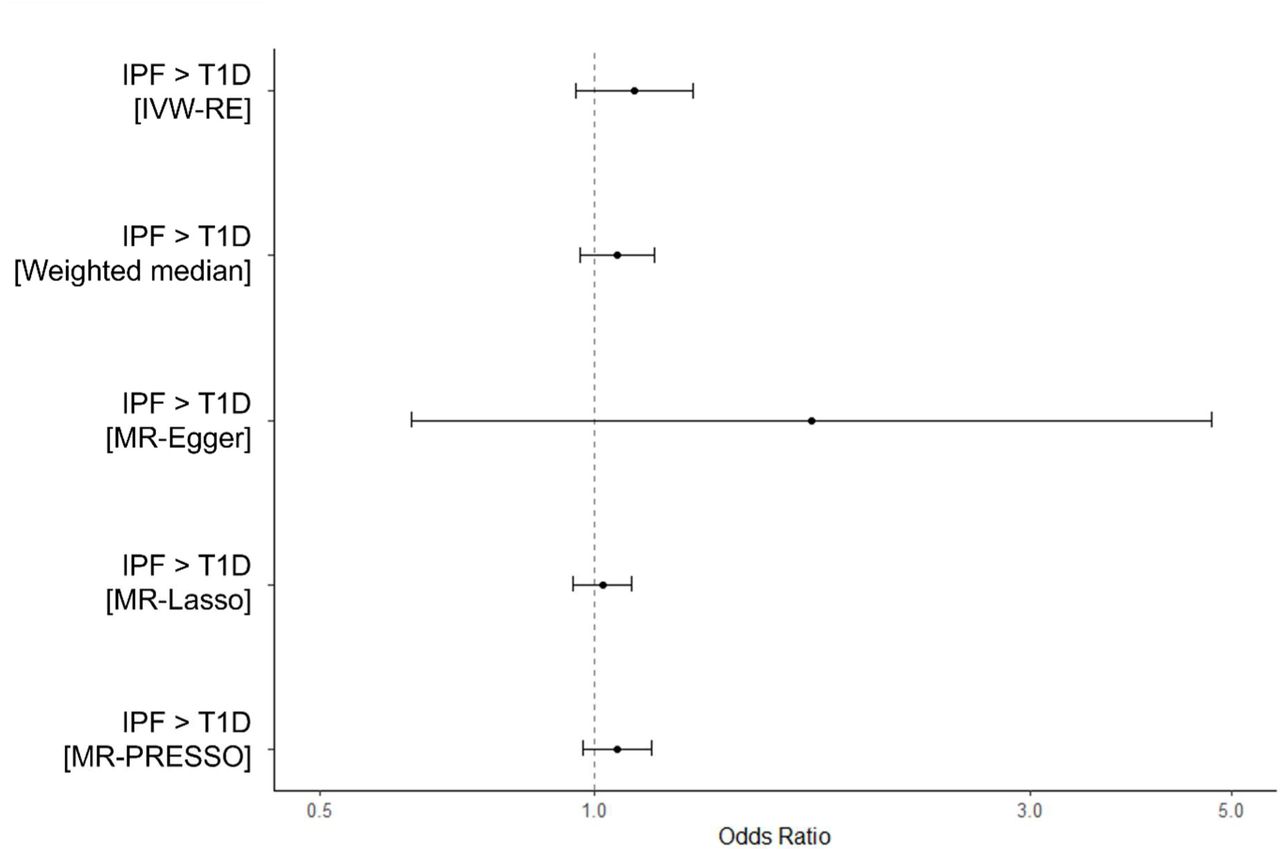
Results of MR analyses (5 IPF instruments) of IPF on T1D did not suggest that IPF causes T1D (IVW-RE, OR = 1.11, 95% CI: 0.95-1.28, p = 0.184). Results from pleiotropy-robust methods were consistent with IVW-RE estimates (Supplementary Figure 4).

Supplementary Figure 1:
  • Download figure
  • Open in new tab
Supplementary Figure 1: Overall causal estimates of T2D on IPF risk (Exposure GWAS cohort all of European ancestry)
Supplementary Figure 2:
  • Download figure
  • Open in new tab
Supplementary Figure 2: Overall causal estimates of HbA1c on IPF risk (only glycemic HbA1c variants)
Supplementary Figure 3:
  • Download figure
  • Open in new tab
Supplementary Figure 3: Overall causal estimates of IPF on T2D.

10/19 IPF variants were not present in the exposure (T2D) dataset for this analysis.

Supplementary Figure 4:
  • Download figure
  • Open in new tab
Supplementary Figure 4: Overall causal estimates of IPF on T2D.

Sensitivity analysis using a T2D GWAS with only European ancestry and all 19 IPF variants present in the outcome dataset.

Supplementary Figure 5:
  • Download figure
  • Open in new tab
Supplementary Figure 5: Overall causal estimates of IPF on T1D.
Supplementary Figure 6:
  • Download figure
  • Open in new tab
Supplementary Figure 6: A scatter plot of single variant effect estimates on T1D (exposure) (x-axis) and IPF (outcome) (y-axis) and overall MR meta-analysis estimates from different methods.

Genetic association statistics are beta effect coefficients derived from GWAS summary statistics for each trait.

Supplementary Figure 7:
  • Download figure
  • Open in new tab
Supplementary Figure 7: A scatter plot of single variant effect estimates on T2D (exposure) (x-axis) and IPF (outcome) (y-axis) and overall MR meta-analysis estimates from different methods.

Genetic association statistics are beta effect coefficients derived from GWAS summary statistics for each trait.

Supplementary Figure 8:
  • Download figure
  • Open in new tab
Supplementary Figure 8: A scatter plot of single variant effect estimates on T2D (European ancestry only) (exposure) (x-axis) and IPF (outcome) (y-axis) and overall MR meta-analysis estimates from different methods.

Genetic association statistics are beta effect coefficients derived from GWAS summary statistics for each trait.

Supplementary Figure 9:
  • Download figure
  • Open in new tab
Supplementary Figure 9: A scatter plot of single variant effect estimates on HbA1c (exposure) (x-axis) and IPF (outcome) (y-axis) and overall MR meta-analysis estimates from different methods.

Genetic association statistics are beta effect coefficients derived from GWAS summary statistics for each trait.

Supplementary Figure 10:
  • Download figure
  • Open in new tab
Supplementary Figure 10: A scatter plot of single variant effect estimates on HbA1c (glycemic genetic variants only) (exposure) (x-axis) and IPF (outcome) (y-axis) and overall meta-analysis estimates from different methods.

Genetic association statistics are beta effect coefficients derived from GWAS summary statistics for each trait.

Supplementary Figure 11:
  • Download figure
  • Open in new tab
Supplementary Figure 11: A scatter plot of single variant effect estimates on BMI (exposure) (x-axis) and IPF (outcome) (y-axis) and overall meta-analysis estimates from different methods.

Genetic association statistics are beta effect coefficients derived from GWAS summary statistics for each trait.

Supplementary Figure 12:
  • Download figure
  • Open in new tab
Supplementary Figure 12: A scatter plot of single variant effect estimates on fasting insulin (exposure) (x-axis) and IPF (outcome) (y-axis) and overall meta-analysis estimates from different methods.

Genetic association statistics are beta effect coefficients derived from GWAS summary statistics for each trait.

Supplementary Figure 13:
  • Download figure
  • Open in new tab
Supplementary Figure 13: A scatter plot of single variant effect estimates on IPF (exposure) (x-axis) and T2D (outcome) (y-axis) and overall meta-analysis estimates from different methods.

Genetic association statistics are beta effect coefficients derived from GWAS summary statistics for each trait.

Supplementary Figure 14:
  • Download figure
  • Open in new tab
Supplementary Figure 14: A scatter plot of single variant effect estimates on IPF (exposure) (x-axis) and T2D (outcome) (y-axis) (European ancestry only, containing all 19 IPF variants) and overall meta-analysis estimates from different methods.

Genetic association statistics are beta effect coefficients derived from GWAS summary statistics for each trait.

Supplementary Figure 14:
  • Download figure
  • Open in new tab
Supplementary Figure 14: A scatter plot of single variant effect estimates on IPF (exposure) (x-axis) and T1D (outcome) (y-axis) and overall meta-analysis estimates from different methods.

Genetic association statistics are beta effect coefficients derived from GWAS summary statistics for each trait.

References

  1. 1.↵
    Raghu, G. et al. Idiopathic pulmonary fibrosis in US Medicare beneficiaries aged 65 years and older: incidence, prevalence, and survival, 2001–11. Lancet Respir Med 2, 566–572 (2014).
    OpenUrl
  2. 2.↵
    Raghu, G. et al. An Official ATS/ERS/JRS/ALAT Statement: Idiopathic Pulmonary Fibrosis: Evidence-based Guidelines for Diagnosis and Management. doi:10.1164/rccm.2009-040GL 183, 788–824 (2012).
    OpenUrlCrossRef
  3. 3.↵
    Association, A. D. Diagnosis and Classification of Diabetes Mellitus. Diabetes Care 37, S81– S90 (2014).
    OpenUrlFREE Full Text
  4. 4.↵
    Liu, J. et al. Trends in the incidence of diabetes mellitus: results from the Global Burden of Disease Study 2017 and implications for diabetes mellitus prevention. BMC Public Health 20, 1–12 (2020).
    OpenUrlCrossRefPubMed
  5. 5.↵
    Elsayed, N. A. et al. 2. Classification and Diagnosis of Diabetes: Standards of Care in Diabetes—2023. Diabetes Care 46, S19–S40 (2023).
    OpenUrlCrossRef
  6. 6.↵
    Chatterjee, S., Khunti, K. & Davies, M. J. Type 2 diabetes. The Lancet 389, 2239–2251 (2017).
    OpenUrlPubMed
  7. 7.↵
    Gribbin, J., Hubbard, R. & Smith, C. Role of diabetes mellitus and gastro-oesophageal reflux in the aetiology of idiopathic pulmonary fibrosis. Respir Med 103, 927–931 (2009).
    OpenUrlCrossRefPubMedWeb of Science
  8. 8.↵
    Bai, L. et al. Idiopathic pulmonary fibrosis and diabetes mellitus: a meta-analysis and systematic review. Respir Res 22, 1–10 (2021).
    OpenUrlCrossRef
  9. 9.↵
    Li, C. et al. Associations Between Diabetes and Idiopathic Pulmonary Fibrosis: a Study-level Pooled Analysis of 26 Million People. J Clin Endocrinol Metab 106, 3367–3380 (2021).
    OpenUrlCrossRef
  10. 10.↵
    Hyldgaard, C., Hilberg, O. & Bendstrup, E. How does comorbidity influence survival in idiopathic pulmonary fibrosis? Respir Med 108, 647–653 (2014).
    OpenUrlCrossRefPubMed
  11. 11.↵
    Navaratnam, V., Davis, T. M. E., Hubbard, R. & Davis, W. A. Incidence and predictors of idiopathic pulmonary fibrosis complicating Type 2 diabetes: the Fremantle Diabetes Study Phase I. Intern Med J 51, 276–279 (2021).
    OpenUrl
  12. 12.
    Davis, W. A., Knuiman, M., Kendall, P., Grange, V. & Davis, T. M. E. Glycemic Exposure Is Associated With Reduced Pulmonary Function in Type 2 DiabetesThe Fremantle Diabetes Study. Diabetes Care 27, 752–757 (2004).
    OpenUrlAbstract/FREE Full Text
  13. 13.↵
    Kopf, S. et al. Breathlessness and Restrictive Lung Disease: An Important Diabetes-Related Feature in Patients with Type 2 Diabetes. Respiration 96, 29–40 (2018).
    OpenUrl
  14. 14.↵
    Lim, S., Bae, J. H., Kwon, H. S. & Nauck, M. A. COVID-19 and diabetes mellitus: from pathophysiology to clinical management. Nature Reviews Endocrinology 2020 17:1 17, 11–30 (2020).
    OpenUrl
  15. 15.↵
    Lombardi, A., Agarwal, S., Schechter, C. & Tomer, Y. In-Hospital Hyperglycemia Is Associated With Worse Outcomes in Patients Admitted With COVID-19. Diabetes Care 45, 2683–2688 (2022).
    OpenUrl
  16. 16.↵
    Chin, T. L. et al. Elderly patients may benefit from tight glucose control. Surgery 152, 315– 321 (2012).
    OpenUrlPubMed
  17. 17.
    Bhandari, S., Rankawat, G., Singh, A., Gupta, V. & Kakkar, S. Impact of glycemic control in diabetes mellitus on management of COVID-19 infection. Int J Diabetes Dev Ctries 40, 340– 345 (2020).
    OpenUrl
  18. 18.↵
    Wong, R. et al. Glycemic Control and Clinical Outcomes in U.S. Patients With COVID-19: Data From the National COVID Cohort Collaborative (N3C) Database. Diabetes Care 45, 1099–1106 (2022).
    OpenUrl
  19. 19.↵
    Martinez, F. J. et al. Idiopathic pulmonary fibrosis. Nature Reviews Disease Primers 2017 3:1 3, 1–19 (2017).
    OpenUrl
  20. 20.↵
    Kolahian, S., Fernandez, I. E., Eickelberg, O. & Hartl, D. Immune mechanisms in pulmonary fibrosis. Am J Respir Cell Mol Biol 55, 309–322 (2016).
    OpenUrlCrossRefPubMed
  21. 21.↵
    Kumar, V. et al. Compromised DNA repair is responsible for diabetes-associated fibrosis. EMBO J 39, e103477 (2020).
    OpenUrl
  22. 22.
    Kumar, V. et al. Homeostatic nuclear RAGE-ATM interaction is essential for efficient DNA repair. Nucleic Acids Res 45, 10595–10613 (2017).
    OpenUrl
  23. 23.↵
    Schafer, M. J. et al. Cellular senescence mediates fibrotic pulmonary disease. Nature Communications 2017 8:1 8, 1–11 (2017).
    OpenUrlCrossRef
  24. 24.↵
    Lindström, J. & Tuomilehto, J. The Diabetes Risk ScoreA practical tool to predict type 2 diabetes risk. Diabetes Care 26, 725–731 (2003).
    OpenUrlAbstract/FREE Full Text
  25. 25.
    Zethelius, B., Hales, C. N., Lithell, H. O. & Berne, C. Insulin Resistance, Impaired Early Insulin Response, and Insulin Propeptides as Predictors of the Development of Type 2 DiabetesA population-based, 7-year follow-up study in 70-year-old men. Diabetes Care 27, 1433–1438 (2004).
    OpenUrlAbstract/FREE Full Text
  26. 26.↵
    Rachdaoui, N. Insulin: The Friend and the Foe in the Development of Type 2 Diabetes Mellitus. Int J Mol Sci 21, 1–21 (2020).
    OpenUrlCrossRefPubMed
  27. 27.↵
    Smith, G. D. & Ebrahim, S. ‘Mendelian randomization’: can genetic epidemiology contribute to understanding environmental determinants of disease? Int J Epidemiol 32, 1–22 (2003).
    OpenUrlCrossRefPubMedWeb of Science
  28. 28.
    Lawlor, D. A., Harbord, R. M., Sterne, J. A. C., Timpson, N. & Smith, G. D. Mendelian randomization: using genes as instruments for making causal inferences in epidemiology. Stat Med 27, 1133–1163 (2008).
    OpenUrlCrossRefPubMed
  29. 29.
    Smith, G. D. & Hemani, G. Mendelian randomization: genetic anchors for causal inference in epidemiological studies. Hum Mol Genet 23, R89 (2014).
    OpenUrlCrossRefPubMedWeb of Science
  30. 30.↵
    Hartwig, F. P., Davies, N. M., Hemani, G. & Smith, G. D. Two-sample Mendelian randomization: avoiding the downsides of a powerful, widely applicable but potentially fallible technique. Int J Epidemiol 45, 1717 (2016).
    OpenUrlCrossRefPubMed
  31. 31.↵
    Hemani, G., Bowden, J. & Davey Smith, G. Evaluating the potential role of pleiotropy in Mendelian randomization studies. Hum Mol Genet 27, R195–R208 (2018).
    OpenUrlPubMed
  32. 32.↵
    Onengut-Gumuscu, S. et al. Fine mapping of type 1 diabetes susceptibility loci and evidence for colocalization of causal variants with lymphoid gene enhancers. Nature GeNetics VOLUME 47, 14 (2015).
    OpenUrl
  33. 33.↵
    Xue, A. et al. Genome-wide association analyses identify 143 risk variants and putative regulatory mechanisms for type 2 diabetes. Nature Communications 2018 9:1 9, 1–14 (2018).
    OpenUrlCrossRef
  34. 34.↵
    Allen, R. J. et al. Genome-wide association study across five cohorts identifies five novel loci associated with idiopathic pulmonary fibrosis. Thorax 77, 829–833 (2022).
    OpenUrlAbstract/FREE Full Text
  35. 35.↵
    Wheeler, E. et al. Impact of common genetic determinants of Hemoglobin A1c on type 2 diabetes risk and diagnosis in ancestrally diverse populations: A transethnic genome-wide meta-analysis. PLoS Med 14, e1002383 (2017).
    OpenUrlCrossRefPubMed
  36. 36.↵
    Chen, J. et al. The Trans-Ancestral Genomic Architecture of Glycemic Traits. Nat Genet 53, 840 (2021).
  37. 37.↵
    Yengo, L. et al. Meta-analysis of genome-wide association studies for height and body mass index in ∼700000 individuals of European ancestry. Hum Mol Genet 27, 3641–3649 (2018).
    OpenUrlCrossRefPubMed
  38. 38.↵
    Bonàs-Guarch, S. et al. Re-analysis of public genetic data reveals a rare X-chromosomal variant associated with type 2 diabetes. Nat Commun 9, (2018).
  39. 39.↵
    Elsworth, B. et al. The MRC IEU OpenGWAS data infrastructure. bioRxiv 2020.08.10.244293 (2020) doi:10.1101/2020.08.10.244293.
    OpenUrlAbstract/FREE Full Text
  40. 40.↵
    Machiela, M. J. & Chanock, S. J. LDlink: a web-based application for exploring population-specific haplotype structure and linking correlated alleles of possible functional variants. Bioinformatics 31, 3555–3557 (2015).
    OpenUrlCrossRefPubMed
  41. 41.↵
    Burgess, S., Butterworth, A. & Thompson, S. G. Mendelian randomization analysis with multiple genetic variants using summarized data. Genet Epidemiol 37, 658–665 (2013).
    OpenUrlCrossRefPubMed
  42. 42.↵
    Burgess, S. et al. Guidelines for performing Mendelian randomization investigations. Wellcome Open Res 4, (2019).
  43. 43.↵
    Bowden, J., Smith, G. D. & Burgess, S. Mendelian randomization with invalid instruments: effect estimation and bias detection through Egger regression. Int J Epidemiol 44, 512–525 (2015).
    OpenUrlCrossRefPubMed
  44. 44.↵
    Bowden, J., Davey Smith, G., Haycock, P. C. & Burgess, S. Consistent Estimation in Mendelian Randomization with Some Invalid Instruments Using a Weighted Median Estimator. Genet Epidemiol 40, 304–314 (2016).
    OpenUrlCrossRefPubMed
  45. 45.↵
    Verbanck, M., Chen, C. Y., Neale, B. & Do, R. Detection of widespread horizontal pleiotropy in causal relationships inferred from Mendelian randomization between complex traits and diseases. Nature Genetics 2018 50:5 50, 693–698 (2018).
    OpenUrlCrossRefPubMed
  46. 46.↵
    Rees, J. M. B., Wood, A. M., Dudbridge, F. & Burgess, S. Robust methods in Mendelian randomization via penalization of heterogeneous causal estimates. PLoS One 14, (2019).
  47. 47.↵
    Burgess, S. & Thompson, S. G. Multivariable Mendelian randomization: the use of pleiotropic genetic variants to estimate causal effects. Am J Epidemiol 181, 251–260 (2015).
    OpenUrlCrossRefPubMed
  48. 48.↵
    Burgess, S., Dudbridge, F. & Thompson, S. G. Re: “Multivariable Mendelian Randomization: The Use of Pleiotropic Genetic Variants to Estimate Causal Effects”. Am J Epidemiol 181, 290–291 (2015).
    OpenUrlCrossRefPubMed
  49. 49.↵
    Grant, A. J. & Burgess, S. Pleiotropy robust methods for multivariable Mendelian randomization. Stat Med 40, 5813–5830 (2021).
    OpenUrl
  50. 50.↵
    Rees, J. M. B., Wood, A. M. & Burgess, S. Extending the MR-Egger method for multivariable Mendelian randomization to correct for both measured and unmeasured pleiotropy. Stat Med 36, 4705–4718 (2017).
    OpenUrlCrossRefPubMed
  51. 51.↵
    Zhu, J. et al. A Causal Atlas on Comorbidities in Idiopathic Pulmonary Fibrosis: A Bidirectional Mendelian Randomization Study. Chest 164, 429–440 (2023).
    OpenUrl
  52. 52.↵
    Garfield, V., Salzmann, A., Burgess, S. & Chaturvedi, N. A Guide for Selection of Genetic Instruments in Mendelian Randomization Studies of Type 2 Diabetes and HbA1c: Toward an Integrated Approach. Diabetes 72, 175–183 (2023).
    OpenUrl
  53. 53.↵
    Kumar, V. & Nawroth, P. P. Is the association between diabetes mellitus and pulmonary fibrosis real? Nature Reviews Endocrinology 2021 17:12 17, 703–704 (2021).
    OpenUrl
  54. 54.↵
    Zaman, T. & Lee, J. S. Risk Factors for the Development of Idiopathic Pulmonary Fibrosis: a Review. Current Pulmonology Reports 2018 7:4 7, 118–125 (2018).
    OpenUrl
  55. 55.↵
    Wu, Y., Ding, Y., Tanaka, Y. & Zhang, W. Risk Factors Contributing to Type 2 Diabetes and Recent Advances in the Treatment and Prevention. Int J Med Sci 11, 1185 (2014).
    OpenUrlCrossRefPubMed
  56. 56.↵
    Faverio, P. et al. Nutritional assessment in idiopathic pulmonary fibrosis: a prospective multicentre study. ERJ Open Res 8, (2022).
  57. 57.↵
    Alakhras, M., Decker, P. A., Nadrous, H. F., Collazo-Clavell, M. & Ryu, J. H. Body Mass Index and Mortality in Patients With Idiopathic Pulmonary Fibrosis. Chest 131, 1448–1453 (2007).
    OpenUrlCrossRefPubMed
  58. 58.↵
    Awano, N. et al. Body mass index and in-hospital mortality in patients with acute exacerbation of idiopathic pulmonary fibrosis. ERJ Open Res 7, (2021).
  59. 59.↵
    Duckworth, A. et al. Telomere length and risk of idiopathic pulmonary fibrosis and chronic obstructive pulmonary disease: a mendelian randomisation study. Lancet Respir Med 9, 285– 294 (2021).
    OpenUrl
  60. 60.↵
    Cheng, F. et al. Shortened Leukocyte Telomere Length Is Associated With Glycemic Progression in Type 2 Diabetes: A Prospective and Mendelian Randomization Analysis. Diabetes Care 45, 701–709 (2022).
    OpenUrlCrossRef
  61. 61.↵
    Verhulst, S. et al. A short leucocyte telomere length is associated with development of insulin resistance. Diabetologia 59, 1258–1265 (2016).
    OpenUrl
  62. 62.↵
    Grunnet, L. G. et al. Leukocyte telomere length is associated with elevated plasma glucose and HbA1c in young healthy men independent of birth weight. Scientific Reports 2019 9:1 9, 1–8 (2019).
    OpenUrl
  63. 63.↵
    Rosa, E. C. C. C. et al. Leukocyte telomere length correlates with glucose control in adults with recently diagnosed type 2 diabetes. Diabetes Res Clin Pract 135, 30–36 (2018).
    OpenUrl
  64. 64.↵
    Clemente, D. B. P. et al. Obesity is associated with shorter telomeres in 8 year-old children. Scientific Reports 2019 9:1 9, 1–8 (2019).
    OpenUrl
  65. 65.↵
    Njajou, O. T. et al. Shorter telomeres are associated with obesity and weight gain in the elderly. International Journal of Obesity 2012 36:9 36, 1176–1179 (2011).
    OpenUrl
  66. 66.↵
    Tamura, Y. et al. β-Cell Telomere Attrition in Diabetes: Inverse Correlation Between HbA1c and Telomere Length. J Clin Endocrinol Metab 99, 2771–2777 (2014).
    OpenUrlCrossRefPubMed
  67. 67.↵
    Müezzinler, A., Zaineddin, A. K. & Brenner, H. A systematic review of leukocyte telomere length and age in adults. Ageing Res Rev 12, 509–519 (2013).
    OpenUrlCrossRefPubMedWeb of Science
  68. 68.↵
    Astuti, Y., Wardhana, A., Watkins, J. & Wulaningsih, W. Cigarette smoking and telomere length: A systematic review of 84 studies and meta-analysis. Environ Res 158, 480–489 (2017).
    OpenUrlCrossRefPubMed
  69. 69.↵
    Raghu, G. et al. Idiopathic Pulmonary Fibrosis (an Update) and Progressive Pulmonary Fibrosis in Adults: An Official ATS/ERS/JRS/ALAT Clinical Practice Guideline. doi:10.1164/rccm.202202-0399ST 205, E18–E47 (2022).
    OpenUrlCrossRef
  70. 70.↵
    Li, J. X. & Cummins, C. L. Fresh insights into glucocorticoid-induced diabetes mellitus and new therapeutic directions. Nature Reviews Endocrinology 2022 18:9 18, 540–557 (2022).
    OpenUrlCrossRef
  71. 71.↵
    Fetters, K. B., Judge, S. P., Daar, E. S. & Hatlen, T. J. Burden of Hyperglycemia in Patients Receiving Corticosteroids for Severe COVID-19. Mayo Clin Proc Innov Qual Outcomes 6, 484–487 (2022).
    OpenUrl
  72. 72.↵
    Foretz, M., Guigas, B. & Viollet, B. Metformin: update on mechanisms of action and repurposing potential. Nature Reviews Endocrinology 2023 19:8 19, 460–476 (2023).
    OpenUrl
  73. 73.↵
    Kheirollahi, V. et al. Metformin induces lipogenic differentiation in myofibroblasts to reverse lung fibrosis. Nature Communications 2019 10:1 10, 1–16 (2019).
    OpenUrl
  74. 74.
    Sato, N. et al. Metformin attenuates lung fibrosis development via NOX4 suppression. Respir Res 17, 1–12 (2016).
    OpenUrlCrossRefPubMed
  75. 75.↵
    Rangarajan, S. et al. Metformin reverses established lung fibrosis in a bleomycin model. Nature Medicine 2018 24:8 24, 1121–1127 (2018).
    OpenUrl
  76. 76.↵
    Bonàs-Guarch, S. et al. Re-analysis of public genetic data reveals a rare X-chromosomal variant associated with type 2 diabetes. Nat Commun 9, (2018).
Back to top
PreviousNext
Posted January 04, 2024.
Download PDF
Email

Thank you for your interest in spreading the word about medRxiv.

NOTE: Your email address is requested solely to identify you as the sender of this article.

Enter multiple addresses on separate lines or separate them with commas.
Assessing Causal Relationships Between Diabetes Mellitus and Idiopathic Pulmonary Fibrosis
(Your Name) has forwarded a page to you from medRxiv
(Your Name) thought you would like to see this page from the medRxiv website.
CAPTCHA
This question is for testing whether or not you are a human visitor and to prevent automated spam submissions.
Share
Assessing Causal Relationships Between Diabetes Mellitus and Idiopathic Pulmonary Fibrosis
Samuel Moss, Cosetta Minelli, Olivia Leavy, Richard Allen, Nick Oliver, Louise Wain, Gisli Jenkins, Iain Stewart
medRxiv 2024.01.04.24300827; doi: https://doi.org/10.1101/2024.01.04.24300827
Twitter logo Facebook logo LinkedIn logo Mendeley logo
Citation Tools
Assessing Causal Relationships Between Diabetes Mellitus and Idiopathic Pulmonary Fibrosis
Samuel Moss, Cosetta Minelli, Olivia Leavy, Richard Allen, Nick Oliver, Louise Wain, Gisli Jenkins, Iain Stewart
medRxiv 2024.01.04.24300827; doi: https://doi.org/10.1101/2024.01.04.24300827

Citation Manager Formats

  • BibTeX
  • Bookends
  • EasyBib
  • EndNote (tagged)
  • EndNote 8 (xml)
  • Medlars
  • Mendeley
  • Papers
  • RefWorks Tagged
  • Ref Manager
  • RIS
  • Zotero
  • Tweet Widget
  • Facebook Like
  • Google Plus One

Subject Area

  • Respiratory Medicine
Subject Areas
All Articles
  • Addiction Medicine (349)
  • Allergy and Immunology (668)
  • Allergy and Immunology (668)
  • Anesthesia (181)
  • Cardiovascular Medicine (2648)
  • Dentistry and Oral Medicine (316)
  • Dermatology (223)
  • Emergency Medicine (399)
  • Endocrinology (including Diabetes Mellitus and Metabolic Disease) (942)
  • Epidemiology (12228)
  • Forensic Medicine (10)
  • Gastroenterology (759)
  • Genetic and Genomic Medicine (4103)
  • Geriatric Medicine (387)
  • Health Economics (680)
  • Health Informatics (2657)
  • Health Policy (1005)
  • Health Systems and Quality Improvement (985)
  • Hematology (363)
  • HIV/AIDS (851)
  • Infectious Diseases (except HIV/AIDS) (13695)
  • Intensive Care and Critical Care Medicine (797)
  • Medical Education (399)
  • Medical Ethics (109)
  • Nephrology (436)
  • Neurology (3882)
  • Nursing (209)
  • Nutrition (577)
  • Obstetrics and Gynecology (739)
  • Occupational and Environmental Health (695)
  • Oncology (2030)
  • Ophthalmology (585)
  • Orthopedics (240)
  • Otolaryngology (306)
  • Pain Medicine (250)
  • Palliative Medicine (75)
  • Pathology (473)
  • Pediatrics (1115)
  • Pharmacology and Therapeutics (466)
  • Primary Care Research (452)
  • Psychiatry and Clinical Psychology (3432)
  • Public and Global Health (6527)
  • Radiology and Imaging (1403)
  • Rehabilitation Medicine and Physical Therapy (814)
  • Respiratory Medicine (871)
  • Rheumatology (409)
  • Sexual and Reproductive Health (410)
  • Sports Medicine (342)
  • Surgery (448)
  • Toxicology (53)
  • Transplantation (185)
  • Urology (165)