
Abstract
Objective Functional bowel disorders (FBDs) are multi-dimensional diseases varying in demographics, symptomology, lifestyle, mental health, and susceptibility to treatment. The patient lived experience is an integration of these factors, best understood with appropriately multivariate models.
Methods In a large patient cohort (n=1175), we developed a machine learning framework to better understand the lived experience of FBDs. Iterating through 59 factors available from routine clinical care, spanning patient demography, diagnosis, symptomatology, life-impact, mental health indices, healthcare access requirements, COVID-19 impact, and treatment effectiveness, machine models were used to quantify the predictive fidelity of one feature from the remainder. Bayesian stochastic block models were used to delineate the network community structure underpinning the lived experience of FBDs.
Results Machine models quantified patient personal health rating (R2 0.35), anxiety and depression severity (R2 0.54), employment status (balanced accuracy 96%), frequency of healthcare attendance (R2 0.71), and patient-reported treatment effectiveness variably (R2 range 0.08-0.41). Contrary to the view of many healthcare professionals, the greatest determinants of patient-reported health and quality-of-life were life-impact, mental wellbeing, employment status, and age, rather than diagnostic group and symptom severity. Patients responsive to one treatment were more likely to respond to another, leaving many others refractory to all.
Conclusions The assessment of patients with FBDs should be less concerned with diagnostic classification than with the wider life impact of illness, including mental health and employment. The stratification of treatment response (and resistance) has implications for clinical practice and trial design, in need of further research.
What is known?
- The diagnosis of functional bowel disorders (FBDs) is based on combinations of gastrointestinal symptoms.
- Beyond diagnosis, the patient lived experience is much broader, with far-reaching impact on their life ranging from effect upon daily activities, mental well-being, access and satisfaction of healthcare, and treatment efficacy.
What is new here?
- FBD diagnosis was not a determinant of any machine model predicting patient-reported disease impact factors.
- Instead, lived experience factors inclusive of life impact, mental wellbeing, employment status, and age were the greatest determinants of patient-reported health quality.
- Efforts to prioritize improvements in patient-reported health quality for FBDs should shift focus to the broader lived experience.
- Patients reporting response to one treatment were more likely to report response to another, leaving others refractory to all.
- Predicting a response to one treatment by response to another highlights the importance of non-placebo trial designs.
Introduction
The management of patients with functional bowel disorders (FBDs)1 remains challenging. Reasons include the absence of precise diagnostic tests, the paucity of clinical biomarkers, and a diagnostic classification based on symptom profiles that may overlap and change2. An incomplete understanding of FBD pathophysiology has held back development of targeted treatments3, including the prediction of which patients stand to benefit most from them.
The healthcare professional’s diagnosis of FBDs is based on varying combinations of abdominal and GI symptoms. A patient’s experience of FBDs however is governed not merely by perturbation of the gastrointestinal tract but has far-reaching impact across the broader aspect of their life, ranging from effect upon daily activities, mental well-being, access and satisfaction of healthcare, and treatment efficacy1,2,4–8. Patients affected by FBDs typically remain so for many years; living with these disorders becomes a necessity leading to considerable effects on quality of life (QoL), often with deleterious effects to other aspects of health5,9.
FBDs are complex diseases with multiple biopsychosocial inputs to observed traits, rendering them unique to each affected individual. This difference from most other GI disorders is arguably a key reason that diagnostic and therapeutic innovation has been slower to progress. From a data-orientated perspective, while FBD are multifaceted ‘high-dimensional’ disorders, they are rarely statistically modelled as such2. Clinical research studies often investigate complex diseases with relatively low-dimensional and/or linear statistical frameworks. This is no different for FBDs, where common experimental designs may, for example, explore sex differences between disorder x, or age-related effects of treatment y, but rarely provide a more sophisticated integration of the two. Such approaches invariably neglect many factors that individualize the individual, leaving gaps in our understanding of the disorders themselves, and also the resultant patient lived experience10.
Research that aims to uncover complex nonlinear disease mechanisms is increasingly achievable with machine learning11,12. If we are to ascribe FBDs as high-dimensional entities across diagnostics, symptomatology, demographics, healthcare requirements, and treatment responsiveness, governed tightly by nonlinear interactions of any of the former, then arguably the only appropriate method to investigate them is with models sufficiently powerful to illuminate underlying heterogeneous and nonlinear disease mechanisms12–14. We therefore developed a comprehensive software-driven framework harnessing state-of-the-art machine learning to reveal, in unprecedented detail, the lived experience of FBDs. In placing the perspective of the individual patient at the forefront of our approach10, we delineate the determinants of ill health, such as the impact on QoL and treatment effectiveness in a more meaningful and patient-orientated way. This framework bypasses any preconceptions of healthcare professionals and could pave the way to more richly individualized patient care10,11,15,16.
Methods
Study design
A single online questionnaire was administered to two existing cohorts of individuals using convenience sampling methods. The two groups were:
ContactMe-IBS (established 2017) – a national irritable bowel syndrome (IBS) registry of people who are interested in participating in IBS research (https://www.contactme-ibs.co.uk). ContactMe-IBS is owned by the NHS (County Durham and Darlington NHS Trust). Registrants are primarily from the Northeast (actively promoted within Durham Bowel Dysfunction Service) and the Southwest where GPs are particularly research active with ContactMe-IBS. Access to the registry is via numerous sources including GP practices, gastroenterology clinics, pharmacies, and social media. During registration, participants self-identify as having IBS by completing screening questions based on Rome IV criteria4.
Transanal irrigation (TAI) database (established 2019) – a database of patients who have commenced TAI under the care of Durham Bowel Dysfunction Service.
Participants on the registry received primary or secondary care for IBS and gave permission to be informed of active research studies. Over a 4-week period, October - November 2021, registrants of both databases (n = 4480 on ContactMe-IBS; n = 259 on the TAI database) were invited to participate by email link to a questionnaire, or by postal questionnaire if preferred. Online questionnaire data were captured digitally via the web-based REDCap application, a secure system designed to support data collection for research studies. Inclusion in the study required participants to be aged 18 years or older with symptoms of bowel dysfunction, registered on either database and able to understand written and spoken English (for questionnaire completion). Participants who did not respond to the invitation or reminder email, or those who did not fully complete the questionnaire, were excluded.
Materials
The study used an 88-item questionnaire requiring ∼35 minutes to complete, organized in the following sections:
Demographic: including date of birth, sex, ethnicity, and employment status.
Nosological: this section was designed to characterize the FBD type of the participant. The scoring algorithms of the ROME IV4 criteria were used to identify primary diagnostic groups: irritable bowel syndrome (constipation [IBS-C], diarrhea [IBS-D] predominant, or mixed [IBS-M]); functional constipation (FC); functional diarrhea (FD); or fecal incontinence (FI). Criteria for evacuatory dysfunction (ED) did not depend on investigations, but relied on symptom scores for straining, a feeling of blockage, a feeling of incomplete evacuation and the need to digitate, with questions and scoring of these aligned to the ROME IV questionnaire.
Primary symptom: respondents were asked to report their primary symptom from a choice of ‘abdominal pain’, ‘bloating’, ‘watery stools’, ‘hard stools’, and ‘frequent bowel movements’, including quantified severity and duration experienced.
Bowel habit: the Bristol Stool Form Scale was used to identify stool type17, and the ROME IV4 criteria individual question data used to assess bowel habit.
Treatment: A visual analogue scale (VAS) was used to measure perceived effectiveness for a range of trialed treatments. These included medicinal (such as laxative, enema, suppository) and non-medicinal (such as pelvic floor/sphincter exercises, footstool use during defecation, fluid and/or dietary changes). Questions on the use and effectiveness of TAI for the management of FBDs were developed by the study team, consisting of seven single answer multiple choice questions and a VAS for patient-perceived effectiveness. Data were not curated or designed for treatment comparisons, but rather to delineate the determinants of patient-perceived effectiveness to a given regime.
Life impact: the impact of FBDs on QoL was assessed using a 5-point Likert scale based on the Patient Assessment of Constipation on Quality of Life (PAC-QOL) questionnaire5,18. PAC-QOL wording was widened to reflect all FBDs, for example ‘constipation’ was amended to ‘bowel symptoms’, and questions related directly to constipation were omitted (Q2,Q4,Q20,Q21,Q24 from PAC-QOL18). This approach would enable insight to the impact of any set of bowel symptoms to a patient, rather than placing focus on specific disease subtypes. The EQ5D-5L General Health19 was used to explore the impact of FBDs on mobility, self-care, usual activities, pain or discomfort, and anxiety or depression. Patient rating of their overall health was also measured by VAS. The Work Productivity and Activity Impairment Questionnaire20 was used to assess impairment in activities of daily living (ADL) and employment-related productivity. Questions elicited employment status, absenteeism (percentage of work hours missed due to bowel symptoms), presenteeism (the degree to which symptoms affect work productivity whilst working), percentage of work hours missed for other reasons, and the degree to which symptoms affected other ADLs in the preceding 7 days.
Healthcare use: questions determined whether the participant had been admitted to hospital for bowel symptoms; and their access to healthcare including physiotherapy, general practitioner (GP), consultant gastroenterologist, GP/district/specialist nurse, and dietician.
COVID-19: comprising single response multiple choice questions explored how the COVID- 19 pandemic affected individuals.
Algorithmic approach
FBDs are a complex set of disorders that are both impacted by, and have profound impact upon, a wide array of interacting biological, social, and psychological factors. A study seeking to predict or characterize one single constitutional, diagnosis, disease, treatment, life impact, or healthcare access feature in such a cohort could only increase its understanding by small margins. Our task here is to find a means to understand the disease process for these patients in a much broader sense, developing a suite of statistical models aiming to predict all patient factors instead.
In undertaking such an approach, we forgo any clinical assumptions, harnessing a data-driven method that allows machine models to identify which constitutional, diagnostic, disease, treatment, life impact, or healthcare access factors are predictable, whilst simultaneously revealing the data-driven determinants of them. Our framework tests the hypotheses that 1) a machine model shall discern what patient factors plausibly can – and perhaps equally important, what cannot be – predicted from their remaining data, and 2) a machine model shall identify the greatest determinants of a given patient feature, both of which have downstream clinical utility in decision support, patient monitoring, and treatment.
A practical example is the prediction of patient-reported health quality. In determining the extent to which patient-reported health quality can be predicted from other constitutional and clinical data, this reveals the capacity for healthcare professionals to ascertain it from data routinely available. Where patient-reported health quality is readily predictable by a machine model, then its determining factor(s) can guide practice, whether that is in patient triaging or treatment monitoring. If, however health quality is not predictable, then this informs us that data currently curated, inclusive of patient constitution, diagnosis, and healthcare access, do not inform it, so in our practice we should not make assumptions as to how a patient would rate their personal health without seeking further information.
We therefore developed a software-embodied, end-to-end, multivariate framework to fully interrogate patient data, inclusive of data organization and multivariate missingness imputation, yielding a platform of machine learning extreme gradient boosting (XGBoost) models optimized to predict a set of given inputs, all evaluated out-of-sample on a separate test set (Figure 1)21. XGBoost is an architecture that employs a parallel ensemble of gradient boosted weak-learner decision trees, which has shown superior performance in multiple machine learning tasks with tabular data21. We partitioned data 80:20 into model training (n=940) and testing (n=235) sets; the latter was completely excluded through all model development and evaluated only after complete development of all models. This pipeline is described in greater detail throughout the supplementary material.
Our algorithmic approach yielded a comprehensive set of machine models trained to predict each patient feature from the remainder, importance metrics (SHapley Additive exPlanations (SHAP)22) which shed light on the strongest determinants of each feature and model performance metrics, all evaluated out of sample. We then consolidated these findings formally with a nested stochastic block model (SBM), a Bayesian generative model of a network that aims to find the most optimum community structure14,23–28. Just as the London Underground network is comprised of stations (nodes) and tracks between them (edges), organized by different train lines, here we study patient factors as nodes, and the prediction importance metrics as edges connecting factors to one-another. By fitting an SBM to these data it reveals the most compact representation of how patient factors are organized.
Data and code availability
All code will be made publicly available upon publication at https://github.com/jamesruffle/perspective-ai. Trained model weights are available upon request. Data and code availability is in line with UK government policy on open-source code. Patient data are not available for dissemination under the ethical framework that governs its use.
Ethical approval
The study was approved by local institutional review board and conducted in accordance with the “Declaration of Helsinki”. The Health Research Authority approved this study prior to commencement. REC reference 21/SW/0086 (IRAS ID 296856).
Results
Cohort
We received 1175 responses from 4739 patients (response rate 24.8%), who formed our analysis cohort. Mean age was 52 years (range 20-80 years): female (n=1000) and male (n=175) (Figure 1). 642 patients fulfilled the ROME-IV criteria for IBS (IBS-C n=133, IBS-M n=237 IBS-D n=246, IBS-U n=26). Further functional bowel disorder diagnoses yielded were functional constipation (n=173), and functional diarrhea (n=157). The remaining 203 patients demonstrated symptoms rendering them non-classifiable due to syndromic overlap in (n=130), or exclusion from (n=73), current classification systems.

A) Flow diagram. B) Geospatial referral distribution.
We derived a hierarchical clustering representation of how patient factors were interrelated by pairwise correlation coefficient (Figure 2). This illustrated that when comparing linear relationships between patient factors they generally align to self-explanatory domains. For example, measures of irrigation use and patient-reported effectiveness thereof were highly correlated and clustered together (r 0.64 or higher, all FDR-corrected p<0.0001). Similarly, measures of pain were highly correlated and clustered together, as well as pain-criterion diagnoses such as IBS (r 0.40 or higher, all FDR-corrected p<0.0001). Patient-reported effectiveness of several treatments formed another cluster, both medicinal (laxative use), and non-medicinal (including changes to diet, fluid intake, footstall use, and pelvic or sphincter exercises): r range 0.13-0.50, all FDR-corrected p<0.0001. Pain severity, impact of bowel symptoms on daily activities, and impact on measures of assisted daily living (ADLs) formed another cluster (r 0.32 or higher, all FDR-corrected p<0.0001). Finally, engagement and requirement of healthcare services formed a weak cluster, including if seen by a medical consultant, general practitioner, dietician, and nurse (r range 0.12-0.45, FDR-corrected p<0.0001).
Taken together, these analyses show that many aspects of patient data cluster together into relatively self-explanatory domains. Measures of abdominal pain (and FBD diagnoses made by the presence of pain1) cluster together. Where an aspect of patient daily life is disrupted, disruption to other aspects of their life is also likely. Where response to one treatment is identified, there is likely to be some response to another. Key here however is that such an approach only superficially characterizes pairwise and linear relationships between a patient or disease factor, a remit nonlinear machine models allow us to further interrogate.

Correlation matrix derived by Pearson correlation coefficient, and hierarchical clustering dendrogram derived by the Euclidean distance matrix. Darker red squares depict more positive and darker blue squares depicting more negative correlation coefficients between pairwise factor.
Machine model predictions of all patient factors
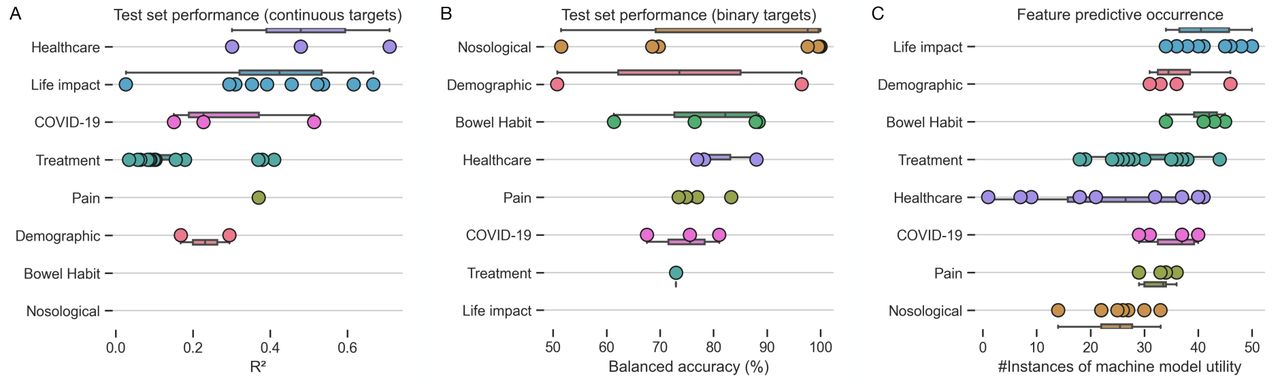
The out-of-sample test set performance breakdowns for all models across the different domains of data are shown compactly in Figure 3, Table 1, and Table 2, and described in greater detail within the supplementary material. Regression models (Figure 3A, Table 1) tasked to predict healthcare usage and life impact achieved the best out-of-sample predictive performances, with more variable performances across treatment, pain, demographic, and COVID-19 impact domains. These findings illustrate how healthcare requirements of a given individual could be relatively well determined with machine learning, plausibly applicable to triage systems or healthcare system planning, and similarly how impact on daily life were relatively easily determined also, of relevance to determining the wider impact of disease at both the individual and societal level, whereas predicting individual treatment response in this cohort was a far harder task.
Classification models are shown in panel Figure 3B and Table 2, demonstrating that disease classification (nosology) was overall most predictable, followed by bowel habit, healthcare usage, pain, COVID-19 impact, and treatment data. The high classification accuracy of patient diagnosis is an expected finding, given the clear constellation of signs and symptoms that determine them4, yet the ability to accurately determine employment status, healthcare usage (and type of) at the individual level holds plausible value for quantifying the wider impact the FBDs cause, pertinent to the patient lived experience.
Model performance is given by R2 value, where a higher value indicates greater predictability from the remaining patient data.
Model performance is given by percentage balanced accuracy, where a higher value indicates greater predictability from the remaining patient data.
A key advantage of machine learning is its ability to undertake feature selection, automatically choosing the greatest determinants of a given modelling target to build the best performing model. In reviewing the feature importance and contributions across all model targets, it transpired that whilst patient factors of life impact, demographics, and bowel habit, were commonly selected by XGBoost, rarely was the patient’s diagnostic label, suggestive that diagnosis was in fact minimally helpful in predicting wider patient factors (Figure 3C).

A) Test-set performance for regression models (in R2). B) Test-set performance for classification models (in % balanced accuracy). C) Feature occurrence across all modelling tasks, illustrating the frequent use of life impact measures in machine model predictions, where diagnostic (nosological) data use was uncommon. All panels are stratified and color-coded by domain of data as shown on the y-axes.
Determinants of symptom burden and quality of life
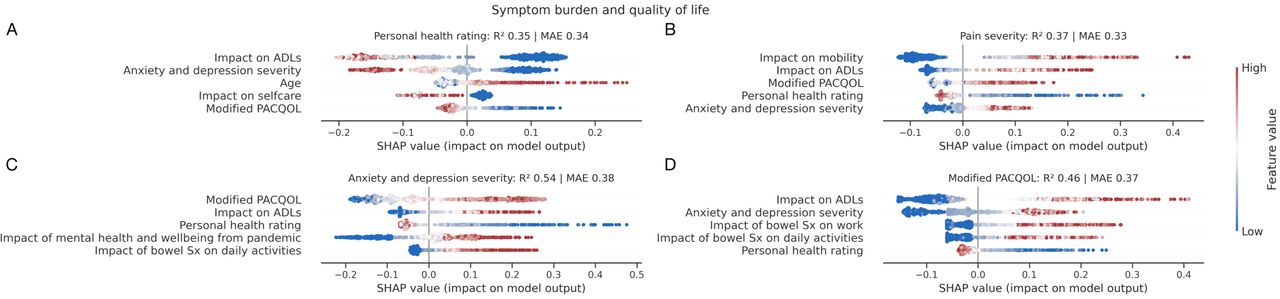
Models predicted symptom burden and quality of life measures relatively well, relying predominantly on life-impact, mental wellbeing, and age to determine them, but importantly not diagnostic label. We provide a breakdown of performant models in determining symptom burden and quality of life metrics with SHAP plots in Figure 4, also further discussed within the supplementary material.

SHAP plots for machine learning models quantifying patient A) personal health rating, B) pain severity, C) anxiety and depression severity, and D) modified PACQOL. Out-of-sample performance is shown by R2 and mean absolute error (MAE). Only the top 5 predictive factors of each target are shown for visualization purposes. For each panel, each point represents a patient, and each row an input feature to the model, where positive x-axis values depict positive impact on the model output, and redder points depict higher feature values. For example, panel A) shows the top predictive feature for personal health rating to be impact on ADLs, where a greater (i.e., more detrimental) impact on ADLs were associated with the patient reporting a lower (i.e., worse) personal health rating. Diagnosis was not selected by the models as informative in their prediction.
Determinants of life impact from functional bowel disorders
Models predicted life impact targets highly accurately, determined largely by hospital attendance data, employment status, other life impact measures, mental wellbeing, and pain data, but not diagnostic label. We provide a breakdown of performant models in determining life impact with SHAP plots in Figure 5 and is further discussed within the supplementary material.

SHAP plots for machine learning models quantifying patient A) employment status, B) impact of bowel symptoms on daily activities, C) frequency of healthcare attendance for bowel symptoms, and D) impact of mental health and wellbeing from the pandemic. Out-of-sample performance is shown by % balanced accuracy and AUROC for classification models (A), with R2 and mean absolute error (MAE) for regression models (B-D). Only the top 5 predictive factors of each target are shown for visualization purposes. A description of interpreting SHAP plots is given in the legend to Figure 4. Diagnosis was not selected by the models as informative in their prediction.
Determinants of patient-reported treatment effectiveness
Model performance in predicting patient-perceived treatment effectiveness was more variable. Despite variable performance, patient-reported treatment response to one intervention was largely predictive for response to another. Conversely, those refractory to one intervention were likely to be refractory to others. We provide a breakdown of performant models in determining patient-perceived treatment effectiveness with SHAP plots in Figure 6.

SHAP plots for machine learning models predicting effectiveness of A) laxatives, B) dietary changes, C) footstool usage during defecation, D) fluid intake changes, E) pelvic floor or sphincter exercises, F) probiotics, G) suppositories, and H) enemas. Out-of-sample performance is shown by R2 and mean absolute error (MAE). Only the top 5 predictive factors of each target are shown for visualization purposes. A description of interpreting SHAP plots is given in the legend to Figure 4. Diagnosis only features in one of eight treatment models, where predictive performance was also notably poor (panel G).
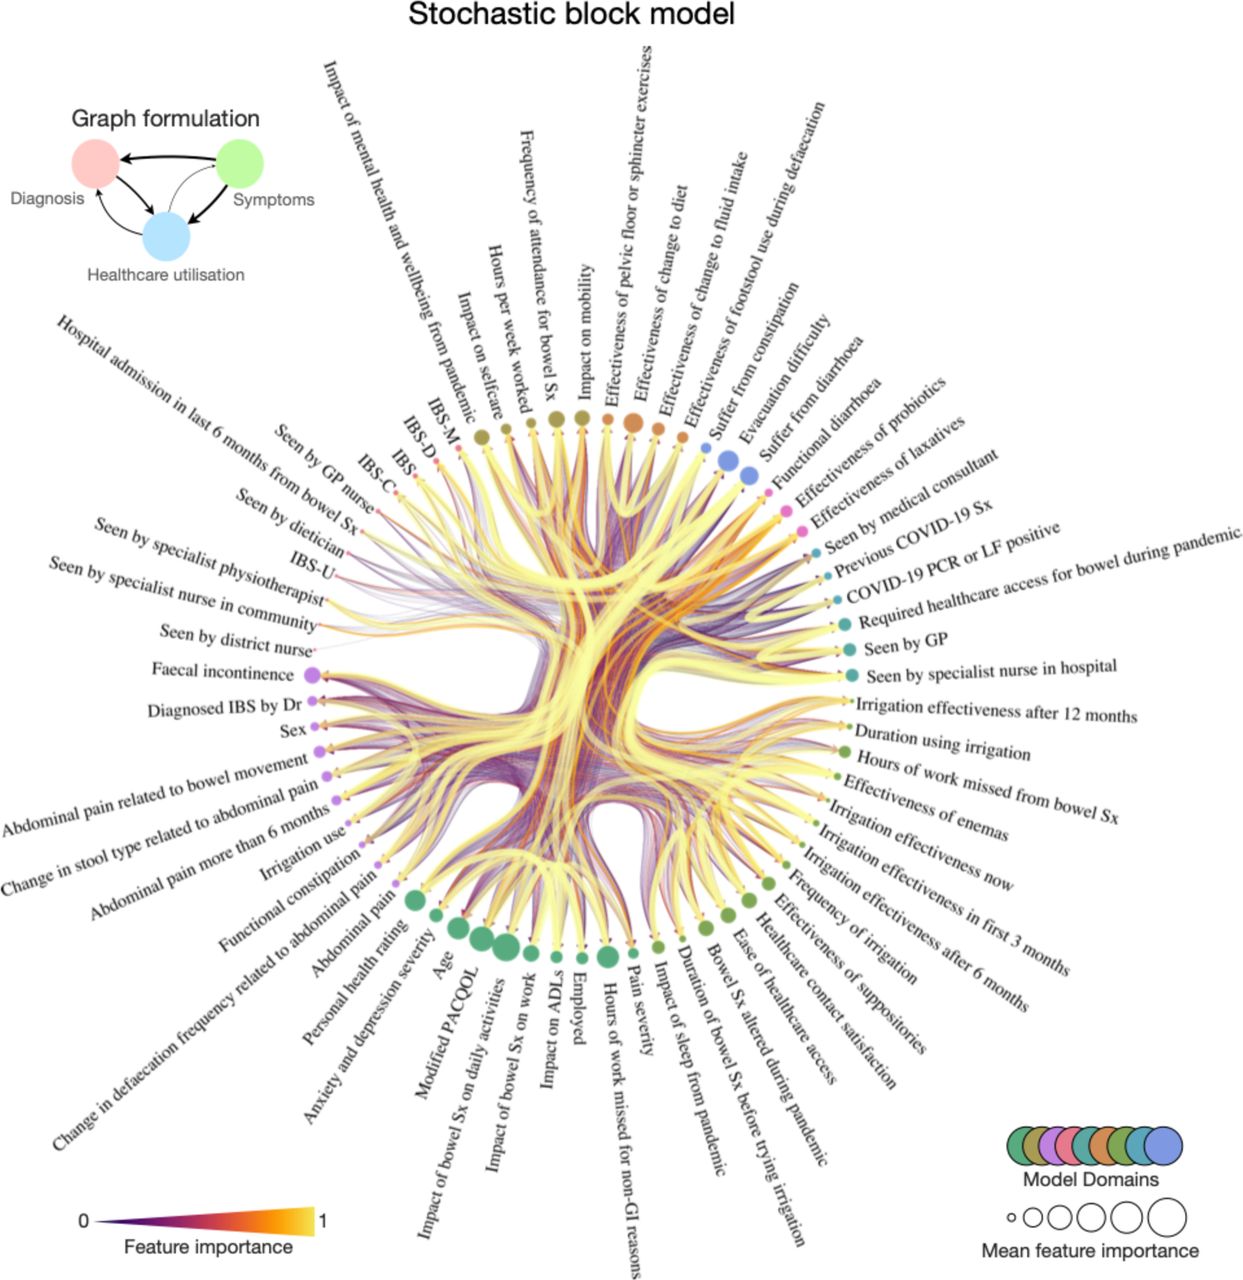
The foregoing analyses illuminate relationships between singular aspects of the patient lived experience. Whilst disclosing non-linear and higher-order relationships between sets of factors in predicting another, the approach lacks an all-encompassing compact summary of the patient lived experience that only an unsupervised approach could offer. This is best approximated by a generative model of a network. A nested generative stochastic block model comprising all factors as nodes, with weighted directed edges as feature contributions to each machine model, revealed a sophisticated community structure of patient factors (Figure 7). This was broadly organized into the domains of nosology, life impact, treatment effects, and symptomology. The network structure reiterated the importance of symptom and life impact factors, as opposed to those related to diagnosis.

Radial network of the nested, generative Bayesian stochastic block model community structure of patient factors. Nodes are individual circles with corresponding text label, sized according to their importance in predicting all other target nodes. Edges are weighted by the directional feature importance in predicting one feature over another, where edge width and color is proportional to the key. Node communities are similarly color coded as per the key at the second hierarchical level. Supplementary Figure 2 accompanies this figure with additional results.
We extracted the weighted eigenvector, hub, authority, and centrality metrics of each community block at the second nested level. Eigenvector centrality is a measure of a node’s ‘influence’ across the whole network29. The Hyperlink-Induced Topic Search (HITS) is a centrality algorithm historically developed for rating world-wide web pages, stemming from the observation that when the internet was originally forming, certain web pages operated as large directories – hubs – yet were not authoritative with respect to information contained within them, although were indeed helpful as catalogues to direct people to the authoritative pages30,31. Framed differently, a ‘good hub’ of a network of the internet is one that points to many other pages, whilst a ‘good authority’ would be a page linked by many different hubs32.
Analysis of our network found the node community consisting of constipation or diarrheal disease nosology had significantly greater hub centrality than all other node blocks (the measure of how often a node links to other factors irrespective of how informative or authoritative it may be) (one-way ANOVA with post-hoc Tukey p<0.0001) (Figure 8). Meanwhile, two communities consisting of treatment effects and life impact measures had significantly greater eigenvector centrality (the measure of a node’s ‘influence’ across the whole network) (one-way ANOVA with post-hoc Tukey p<0.0001). Similarly, the node community of treatment effectiveness related to probiotic and laxatives, and node community related to life impact, both yielded significantly greater authority centrality (the measure of how informative and authoritative a node is to the remaining network) (one-way ANOVA with post-hoc Tukey p<0.0001).

Box and whisker plots illustrating centrality metrics of A) the nosology node community from the nested stochastic block model comprising if the patient suffers from diarrhea, constipation, or any form of evacuatory difficulty; B) life-impact including to self-care, mobility, ability to work, healthcare access and mental wellbeing; C) the treatment effectivity node community comprising the effects of probiotics, effects of laxatives, and also a diagnosis of functional diarrhea; and D) the treatment effectivity node community comprising the effects of pelvic floor/sphincter exercises, dietary or fluid changes, and footstool use during defecation. Refer to Figure 7 for radial representation of this network community structure. **** denotes a post-hoc Tukey significance test of p<0.0001 following one-way ANOVA.
Discussion
The lived experience of functional bowel disorders
Modern medicine has become an algorithmic science: the clinician assesses symptoms, orders tests, and classifies the illness into a diagnostic category on which therapy is based. In FBDs there are no objective measures that sub-classify patients based on pathophysiology; instead, symptom-based classifications are crafted to aid management. Whilst this can be helpful, it may over-simplify the portrayal of a complex multi-dimensional condition. We have conducted a holistic characterization of a large cohort of patients with FBD using a multi-dimensional machine learning approach without prior assumptions on the determinants of the lived experience. The main pertinent findings are twofold:
(1) we reveal in unprecedented detail the determinants of patient-reported symptom burden, quality of-life, life impact, and treatment effectiveness, as well as providing the framework for predicting them. These determinants are, in many ways, at odds with what we, as healthcare professionals, often assign as the determinants of health and wellbeing; examples are discussed below.
(2) Our network analysis, summarizing the output of a comprehensive machine modelling framework, reveals the high-dimensional community structure of these patient factors. This process formally quantifies that, whilst the nosological domains of disease we categorize patients with are network hubs that link many aspects of patient health and wellbeing, they are poorly influential (or authoritative) in describing the broader aspects of patient health. Rather, it is a focus on patient-reported treatment effectiveness and impact on a patient’s daily life that are instead quantitatively authoritative and influential.
The value in developing a suite of machine models to predict these characteristics is not merely the depiction of those with high performance (which is often the case in machine learning research). Rather, the process illuminates what can, but equally importantly what also cannot, be determined from data routinely available in a clinical setting. It should come as no surprise that a diagnosis of IBS can be predicted perfectly from metrics of abdominal pain and gastrointestinal disturbance: these factors are definitional for a diagnosis of IBS by current classification systems2,4. More important however is the fidelity of models to ascertain other aspects of patient health, such as the effect of young age or employment status, which are not as intuitive.
The determinants of patient health and well-being
Machine learning models are often described as sophisticated in their ability to formulate a decision based on nonlinear interactions amongst complex multivariate data11,12, but the reality is that the healthcare professional reviewing a patient undertakes similar processes to inform their clinical decision making11. To that end, we have described the determinants of ill health from the perspective of the patient, such that these factors can be considered in the clinical consultation.
Symptom burden and quality of life
We find that the rating a patient ascribes to their personal health is not principally determined by severity of gastrointestinal symptoms or diagnosis, but instead by the impact of disease on their daily life, the presence of anxiety and depression, and being ill at a younger age. Whilst most of these factors are intuitive and unsurprising, the effect of young age on perception of well-being has not been previously highlighted.
The greatest determinants of patient-reported pain severity were the impact of illness on daily life activities, the presence of anxiety and depression, and the patient’s personal health rating. Quality of life was best determined by impact of the illness on daily activities, the presence of anxiety and depression, and the impact of bowel symptoms on work. These results formalize the importance of considering not only the gastrointestinal symptoms of FBDs, but rather the impact they exert on patient life.
Other than in suppository use for if there was a diagnosis of IBS-C (a trivial association), the diagnostic label that we as healthcare professionals assign to these patients as part of ‘best practice’ did not feature as a top 5 determinant for any machine model. Indeed, none of the top five determinants of a patient’s health rating specifically interrogated gastrointestinal symptoms, emphasizing the importance of quantifying the impact of life factors (such as employment and daily life) and mental wellbeing throughout their routine clinical care.
Life impact
Patient employment status could be determined by a machine learning model (the model correctly predicted employment status in 229 of 235 out-of-sample test cases). The greatest determinant of employment status was, by some distance, the degree of impact of bowel symptoms on daily activity. Conversely, the greatest determinant of patient-reported impact of bowel symptoms on daily activities was unemployment. It therefore seems reasonable to suggest simply ascertaining employment status is an especially strong predictor of life impact measures and something that should be considered in every consultation.
One of the highest performing machine models were in delineating the frequency of patient healthcare attendance for bowel symptoms (which achieved an out of sample R2 of 0.71). The greatest determinants of healthcare attendance were the hours of work missed, whether the patient had already been seen by a GP, the impact to their mental health, employment status, and if seen by a medical consultant before. Vitally, the determinants of patient frequency of healthcare attendance for bowel symptoms were not predicted by bowel symptomology, but instead a combination of healthcare access/gatekeeping (i.e., if already known to the service), impact on employment and life, as well as mental wellbeing. This is in keeping with the previously known evidence of healthcare seeking in IBS33,34. Naturally, the ability to quantify healthcare requirements is important, with implications in designing and budgeting for healthcare service provisions35.
Lastly, we briefly draw focus to our model predicting the impact of mental health and wellbeing during the COVID-19 pandemic. The strongest determinants in this cohort were frequency of attendance for bowel symptoms. Put another way, mental health in this FBD population was most greatly affected by the ability to access healthcare during a time at which the health service was under particular strain. This finding conveys the priority we should place in maximizing patient healthcare access to safeguard mental wellbeing.
Treatment effectiveness
Several models aimed to quantify patient-reported effectiveness of routinely provided FBD treatments, both medicinal (laxatives, enemas, suppositories, probiotics) and non-medicinal (dietary or fluid changes, footstool use during defecation, and pelvic floor/sphincter exercises). We would be wary of drawing conclusions in comparing the effectiveness of certain treatments over another, for the study was not designed as a clinical trial to facilitate this. However, the key insight was in the determinants of patient-reported treatment effectiveness. Namely, the greatest determinant of patient response to any treatment was patient response to any other. Once again, symptomatology, and disease classification were minimally predictive of treatment response, but other factors (social, psychological, and comorbid) combined to create, in some patients, a state of refractoriness. It is these patients, who respond poorly to all treatments that are seen in secondary and tertiary care and require a holistic approach. More research is needed to understand refractoriness in FBD.
The interacting structure of patient health and well-being
We harmonized the findings to construct a Bayesian generative network revealing the community structure of factors affecting those living with FBDs. Broadly, these feature communities coalesce to nosology, life impact, treatment effects, and symptomology. Interestingly however, we show that the nosological branch of these factors – i.e., the domains of disease leading to diagnostic labels we assign to these patients – are ‘hubs’ in this network (a feature that points to many other) but are in fact minimally influential29,30,36. Instead, it is the communities of life impact and treatment effectiveness that are quantitatively more influential (with higher eigenvector centrality) and authoritative (with higher authority centrality) in the remaining aspects of their health. Taken together, these findings suggest that the assignment of disease labels to these patients is in fact often minimally helpful in disclosing or influencing the broader FBD lived experience, as shown elsewhere in the comparison of constipation-predominant irritable bowel syndrome and functional constipation2,37. Instead, we should place greater efforts to reducing life impacts and improving treatment effects through a holistic approach.
Study limitations
The study quantified a breadth of patient factors feasibly acquired during routine clinical care, ranging from demographic, diagnostic, symptomology, quality of life, healthcare access, and patient-reported effectiveness of regularly given treatments. One limitation is that we did not quantify more comprehensive and/or specialist investigations (e.g., microbiota, gastrointestinal imaging, genetic, or an exhaustive list of comorbidity data) since this would have limited applicability and generalizability of the findings to centers in which these are not part of routine care. To our strength, in maximizing the quantification of variables that are routinely available, we were able to sample a large cohort from which we could construct a suite of machine learning models with proven fidelity that could be evaluated and/or deployed in similar centers.
Secondly, the study was not designed to clinically trial specific treatments. Rather, it was designed as a cross-sectional study, where patients could self-report the effectiveness of the range of therapies they had experienced throughout their care. This limits inference that could be drawn from an experimental allocation i.e., a randomized controlled trial, but it does quantify the response to treatment with explicit emphasis on the individual patient experience (as opposed to any biochemical/investigatory endpoint). In any case, our emphasis was to illuminate the determinants of patient-reported response to treatment in general, as opposed to quantifying the superiority/non-inferiority of one treatment over another.
Thirdly, our study was not designed to investigate directional effects. One might suggest a plausible directionality of impaired GI health leading to a triad of increased healthcare utilization, loss of productivity/employment, and worsening QoL/mental wellbeing, but must conform to the appropriate criteria for establishing causality38. An additional analytical route would be the use of dedicated causal inference, a task for future research39.
Conclusion
We characterize the lived experience of FBDs with a machine learning approach. Our framework reveals new insights into the determinants of patient-reported symptom burden, quality of-life, impact on daily life, and treatment effectiveness in a large representative cohort. These determinants are often at odds with what we, as healthcare professionals, typically pre-suppose are the greatest determinants of patient reported health. Instead of disease classification or symptom severity, this was defined by the impact on daily life, by employment status, access to healthcare, and mental wellbeing. To safeguard mental wellbeing, patient access to healthcare must be attainable and a holistic approach to the consultation is required. Patients tend to be responsive to multiple therapies or refractory to all, and a deeper understanding of refractoriness should form a future research priority.
Data Availability
All code will be made publicly available upon publication at https://github.com/jamesruffle/perspective-ai. Trained model weights are available upon request. Data and code availability is in line with UK government policy on open-source code. Patient data are not available for dissemination under the ethical framework that governs its use.
Supplementary Material
Method
Algorithmic approach
Handling of data missingness
In line with standard practices, we removed patients with missing data for >40% of feature columns (n=1), and conversely removed features with missing data for >40% of patients (f=19), resulting in 59 features. We established that the data was missing at random (MAR), and used multivariate imputation via chained equations (MICE)1 with predictive mean matching, 50 multiple imputations and 50 iterations (i.e., x10 the default for each), to impute remaining missing values.
Visualization of the patient-feature space
We next created a visualization of the feature space across all patient domains of demographic, nosological, pain, bowel habit, treatment, life impact, healthcare, and COVID-19, in the form of a cluster map. We computed the pairwise Pearson correlation matrix of all features and performed hierarchical clustering by Euclidean distance metrics to produce a dendrogram2–5. P values were adjusted by False Discovery Rate6. For cross-group comparisons, including patient reported treatment effectivity, we conducted one-way ANOVAs were post-hoc Tukey testing.
Machine learning
While Euclidean distance derived dendrograms can display linear, pairwise feature relationships, we anticipated that FBD complexity would necessitate machine learning models capable of capturing non-linear, interacting relationships within the feature space.
Data pre-processing
We partitioned data into 80:20 train (n=940) and test (n=235) sets; the latter was completely held out and evaluated only after complete development of all models. All hyperparameter optimisation was performed using cross-validation in the training set only.
To avoid trivially reductive predictions, we removed features that were directly related to the target with regular expression. For example, if the target involved irrigation, all predictive features involving irrigation were dropped. We retained features that were explicitly related to a given diagnosis (e.g., the presence of abdominal pain when predicting IBS) to be used as benchmark models ensuring appropriate fidelity with the modelling architectures and hyperparameters7,8.
Targets where the class imbalance exceeded 20:1 were excluded entirely due to insufficient data support. For those remaining, we used Synthetic Minority Over-sampling (SMOTE) to handle class imbalances9, a well-established technique that oversamples the minority class by creating new cases over a learnt linear manifold9. All data were clamped along the 0.1th and 99.9th percentile and normalised to limit influence of extreme outliers and variance of scale, in line with standard practices.
Model training
For all predictive modelling, we used eXtreme Gradient Boosting (XGBoost)10, an architecture that employs a parallel ensemble of gradient boosted weak-learner decision trees, which has shown superior performance in multiple machine learning tasks10. Models were constructed as classifiers for categorical targets, and regressors for continuous targets. All training runs of a single XGBoost model (for one given target, e.g., patient sex) were undertaken with 5-fold cross-validation, and hyperparameters were optimised by gridsearch across learning rate, number of estimators, maximum depth, subsampling, gamma, and the minimum sum of the instance weight (inside the 80% training data partition), using negative log loss for classifiers and root mean squared error for regressors. This required 16,200 individual model fits per target, which across all 59 targets equated to 955,800 model fits, which took approximately 4 days on a NVIDIA 2080Ti GPU.
Feature importance
We derived feature importance scores for all model runs by the number of times a feature is used to split the data across all trees (i.e., the XGBoost default10), as well as feature directionality with SHapley Additive exPlanations (SHAP)11.
Out of sample evaluation
After identifying the optimum fit, we evaluated model performance on the test set, for classifiers deriving the balanced accuracy, precision, recall, and F1 (all macro-averaged), and for regressors deriving the mean absolute error, mean squared error, RMSE, and R2. MAE and MSE were reported as a function of normalised and z-scored targets to facilitate performance comparison across targets with varying ranges (e.g., the age range was 20-85 years, whereas personal health rating was between 6-100).
Bayesian generative graph models of complex nonlinear feature relationships
The foregoing analyses characterise feature relationships criterion on predicting a singular task: the gender of a patient, their quality of life, burden of disease, et cetera. Whilst innovative in disclosing the non-linear and interacting relationships between sets of features in predicting another, the approach lacks an all-encompassing compact summary that only an unsupervised approach could offer. To that end we turned to graph theory for our solution. Graph theory provides a powerful method of modelling complex systems that combines flexibility with intelligibility12–17. It treats individual factors of interest as the “nodes” of a network, and their interactions as the connections, or “edges”, between them. Here, nodes were all patient features, and edges were the feature importance indices from XGBoost predictive models, the importance metric of one feature in predicting another. The value in this approach over simple metrics of pairwise similarity (e.g., correlation), is that each edge between features captures the importance of that feature in predicting another. This definitionally incorporates the impact of other features in the graph to yield a high-dimensional community structure, whilst formally implementing Occam’s razor by Bayesian inference17.
We evaluated the community structure of this graph with a non-parametric Bayesian hierarchical weighted stochastic block model. Having derived a community structure of patient features, we extracted block partitions and derived weighted centrality metrics. These centrality metrics were: i) eigenvector (a measure of node ‘influence’ on the overall graph), ii) authority centrality (a measure of node authority in information to other nodes), and iii) hub centrality (a measure of the propensity for a node to link many other nodes). The full mathematical derivation of these metrics is beyond the scope of this article, but well established, and discussed in significantly further detail elsewhere2,12,13,18–20.
A stochastic block model (SBM)21 is a generative model of the community structure of a graph composed of N nodes, divided into B blocks with edges ers between blocks r and s. The model can be framed hierarchically, where edge counts ers form block multigraphs with nodes corresponding to individual blocks and edge counts arising as edge multiplicities between block pairs, including self-loops. We seek to infer the most plausible partition (bi) of the nodes, where (bi) ∈ [1, B]N identifies the block membership of node i in observed network G, with maximisation of the posterior likelihood P(G|(bi)). The result is a hierarchically organised community structure of nodes assigned into blocks that yields the most compact representation of the graph, as indexed by its minimum description length22, ∑. The general approach is described in further detail elsewhere21. Directed feature importance weights were modelled as exponential. Having initialised a fit, we used simulated annealing to further optimise it, with a default inverse temperature of 1 to 10. We did not specify a finite number of draws, rather we specified a wait step of 1000 iterations for a record-breaking event, to ensure that equilibration was driven by changes in the entropy criterion, instead of driven by a finite number of iterations, as per2,12,23.
Software
Analyses were predominantly performed within a Python (version 3.6.9) environment with the following software packages: graph-tool24, imblearn25, Matplotlib26, NumPy27, pandas28, SciPy4,29, Scikit-learn29, seaborn3, SHAP11 and XGBoost10. MICE was performed in R (version 4.1.3)1.
Hardware
Analyses were predominantly performed on a local 32-core Linux workstation housing 135Gb of RAM and an NVIDIA 2080Ti GPU.
Results

Heatmaps of a) regression, and b) classification machine models, where target is shown on the y-axis, and input feature is shown across the x-axis. In regression models (a), y-axis target order is per the out-of-sample R2 performance, whereas in classification models (b), order is by out-of-sample balanced accuracy (bracketed values). Input features across the x-axes are coloured by the XGBoost feature importance index, with darker squares more important in target prediction. X-axis is sorted by mean-feature importance: features with higher mean importance scores in predicting the y-axis target tend to the left side of the heatmap.
Symptom burden and quality of life
First, a machine model could predict a patient’s personal health rating an out-of-sample performance of R2 of 0.35 and MAE of 0.34. The top five determinants of personal health rating were, in descending order: i) impact on ADLs, ii) anxiety and depression severity, iii) age, iv) impact on selfcare, and v) modified PACQOL. A machine model could predict pain severity with an out-of-sample performance of R2 of 0.37 and MAE of 0.33. The five most predictive determinants of patient-reported pain severity were, in descending order: i) impact on mobility, ii) impact on ADLs, iii) modified PACQOL, iv) personal health rating, and v) anxiety and depression severity. A machine model could also predict anxiety and depression severity with an out-of-sample performance of R2 of 0.54 and MAE of 0.38. The five most predictive determinants of anxiety and depression severity were, in descending order: i) modified PACQOL, ii) impact on ADLs, iii) personal health rating, iv) impact of mental health and wellbeing from the pandemic, and v) impact of bowel symptoms on daily activities. Lastly, a machine model could predict PACQOL with an out-of-sample performance of R2 of 0.46 and MAE of 0.37. The five most predictive determinants of PACQOL were, in descending order: i) impact on ADLs, ii) anxiety and depression severity, iii) impact of bowel symptoms on work, iv) impact of bowel symptoms on daily activity, and v) personal health rating.
Life impact from functional bowel disorders
A machine model could predict patient employment status with an out-of-sample balanced accuracy of 96% and AUROC 0.96. The five most predictive determinants employment status were, in descending order: i) impact of bowel symptoms on daily activities, ii) impact of bowel symptoms on work, iii) impact of mental health and wellbeing from the pandemic, iv) hours of work missed for non-GI reasons, and v) frequency of attendance for bowel symptoms. A machine model could predict the impact of bowel symptoms on daily activities with an out-of-sample performance of R2 of 0.67 and MAE of 0.18. The five most predictive determinants of impact on daily activities from bowel symptoms were, in descending order: i) employment status, ii) modified PACQOL, iii) faecal incontinence, iv) personal health rating, and v) pain severity. A machine learning model could predict frequency of patient attendance for bowel symptoms with an out-of-sample performance of R2 of 0.71 and MAE of 0.28. The five most predictive determinants of attendance were, in descending order: i) hours of work missed for non-GI reasons, ii) if already seen by a GP, iii) impact of mental health and wellbeing during the pandemic, iv) employment status, and v) if previously seen by a medical consultant. Lastly, a machine learning model could predict impact of patient mental health from the pandemic with an out-of-sample performance of R2 of 0.51 and MAE of 0.26. The five most predictive determinants of mental health and wellbeing during the pandemic were, in descending order: i) frequency of attendance for bowel symptoms, ii) anxiety and depression severity, iii) impact of sleep from the pandemic, iv) effectiveness of pelvic floor or sphincter exercises, and v) if seen by a GP.
Treatment effectiveness
Patient reported effectiveness of laxatives could be predicted with an out-of-sample performance of R2 of 0.16 and MAE of 0.57. The five most predictive determinants of laxative effectiveness were, in descending order: i) effectiveness of footstool use during defaecation, ii) effectiveness of pelvic floor or sphincter exercises, iii) modified PACQOL, iv) effectiveness of change to fluid intake, and v) frequency of attendance for bowel symptoms. Effectiveness of diet changes could be predicted with an out-of-sample performance of R2 of 0.37 and MAE of 0.47. The five most predictive determinants of diet change effectiveness were, in descending order: i) effectiveness of change to fluid intake, ii) pain severity, iii) impact on mobility, iv) frequency of attendance for bowel symptoms and v) effectiveness of footstool use during defaecation. Meanwhile, effectiveness of footstool use during defaecation could be predicted with an out-of-sample performance of R2 of 0.18 and MAE of 0.66. The five most predictive determinants of footstool effectiveness were, in descending order: i) effectiveness of pelvic floor or sphincter exercises, ii) laxative effectiveness, iii) personal health rating, iv) impact of mental health and wellbeing during the pandemic, and v) effectiveness of change to diet.
Patient reported effectiveness of changes to fluid intake could be predicted with an out-of-sample performance of R2 of 0.38 and MAE of 0.45. The five most predictive determinants of effectiveness in modifying fluid intake were, in descending order: i) effectiveness of change to diet, ii) effectiveness of pelvic floor or sphincter exercises, iii) effectiveness of probiotics, iv) abdominal pain, and v) impact of sleep from the pandemic. Patient reported effectiveness of pelvic floor or sphincter exercises could be predicted with an out-of-sample performance of R2 of 0.41 and MAE of 0.46. The five most predictive determinants of effectiveness in pelvic floor or sphincter exercises were, in descending order: i) impact of mental health and wellbeing from the pandemic, ii) effectiveness of footstool use during defaecation, iii) effectiveness of fluid intake changes, iv) modified PACQOL, and v) effectiveness of laxatives. Lastly, patient reported effectiveness of probiotics, suppositories, and enemas could only be predicted with an out-of-sample performance of R2 of 0.10 and MAE of 0.42; R2 of 0.08 and MAE of 0.20; and R2 of 0.09 and MAE of 0.11, respectively. The five most predictive determinants of effectiveness in probiotic use were, in descending order: i) effectiveness of change to fluid intake ii) frequency of attendance for bowel symptoms, iii) effectiveness of change to diet, iv) impact of mental health and wellbeing during the pandemic, and v) pain severity. Relatively few patients reported effects with enemas and suppositories, so were wary of drawing much inference as to their determinants of positive effect. For completion, we provide these in Figure 6, but would suggest some caution in their interpretation by virtue of the smaller sampling size).
Generative graph community structure
Model entropy, a goodness of fit criterion) was -635.54 nats after MCMC by simulated annealing, with iteration curve indicative of model convergence (Supplementary Figure 2).

Footnotes
Funding: JKR was supported by the Medical Research Council (MR/X00046X/1). PN is supported by the Wellcome Trust (213038/Z/18/Z) and the UCLH NIHR Biomedical Research Centre. The PERSPECTIVE study was funded by MacGregor Healthcare Ltd.
Conflict of interest: None to declare.
References


