
Abstract
Mass testing to identify and isolate infected individuals is a promising approach for reducing harm from the next acute respiratory virus pandemic. It offers the prospect of averting hospitalizations and deaths whilst avoiding the need for indiscriminate social distancing measures. To understand scenarios where mass testing might or might not be a viable intervention, here we modelled how effectiveness depends both on characteristics of the pathogen (R0, time to peak viral load) and on the testing strategy (limit of detection, testing frequency, test turnaround time, adherence). We base time-dependent test sensitivity and time-dependent infectiousness on an underlying viral load trajectory model. We show that given moderately high public adherence, achievable frequent testing can prevent as many transmissions as more costly interventions such as school or business closures. With very high adherence and fast, frequent, and sensitive testing, we show that most respiratory virus pandemics could be controlled with mass testing alone.
1 Introduction
Respiratory virus pandemics pose a major threat to human health and well-being, as evidenced by the impacts of COVID-19 and 1918 influenza pandemics. The UK government estimates between 5-25% chance of a new pandemic the magnitude of COVID-19 occurring within the next 5 years, which could potentially lead to up to 800,000 deaths as well as extensive social distancing measures [1]. Given the massive potential harm of future pandemics, it is important to make disease control tools more reliable. Vaccines and therapeutics currently take months or years to design, test, and manufacture, and are not guaranteed to work. Social distancing imposes a huge burden on the population and is not sustainable for a long period. With low enough disease prevalence, contact tracing can prevent transmissions more efficiently than social distancing [2]. However, contact tracing is often not reliable enough, on its own, to control airborne pathogens, especially for the short latent periods combined with pre-symptomatic and/or asymptomatic transmission seen for SARS-CoV-2 [3, 4]. Before there is another major pandemic, there is time to prepare strategies, technology, and infrastructure. It is important to understand which approaches would be most useful to invest in.
Mass testing, defined as frequent testing of most of the population and isolation of positives was proposed by several researchers as a promising approach to contain COVID-19 [5, 6, 7, 8, 9, 10, 11, 12]. On a relatively small scale (tens of thousands of people), several universities, professional sports teams and film studios succeeded in operating in-person with low disease burden during the COVID-19 pandemic by frequently testing people [13, 14, 15, 16]. Children in secondary school in the UK were recommended to test twice weekly in March 2021 [17], and Slovakia performed two rounds of mass antigen testing which Pavelka et al [18] estimated caused a 70% reduction in prevalence. However, prior to the availability of vaccines, and even with the pooling of samples, there was not enough testing capacity outside of China [19] to consistently test more than 0.1% of the nation-wide population per day [20].
Similar to previous studies [21, 22, 23], we evaluate the potential impact of mass testing on reducing transmission, by modeling different mass testing strategies with time-dependent test sensitivity conditional on viral load trajectories. Like Middleton and Larremore [24], we treat infectiousness as a function of the same underlying viral load trajectories. In contrast to previous work, our aim is to determine which pandemic scenarios mass testing could be useful for, rather than whether it would work specifically for COVID-19. This means we consider a range of values for viral characteristics (R0 and generation time), as well as testing policy characteristics (limit of detection, test delay, test frequency, and population adherence). Our aim is to provide a framework for understanding the potential effectiveness of different mass testing strategies that can inform investments into technology and infrastructure that might increase capacity beyond that available for COVID-19. Our model is available as an interactive application, to enable easy experimentation with different mass testing policies and modelling assumptions.
2 Methods
We start by computing the expected number of transmissions from a person who tests regularly and isolates perfectly when they learn they are positive. We later adjust this value to account for imperfect adherence, and then estimate the population-level effect of mass testing under the assumption that the population is well-mixed. Default parameter values are chosen based on SARS-CoV-2, and then we subsequently explore different parameter values to represent other pathogens.
Trajectories of log viral load for acute respiratory infections like influenza or SARS-CoV-2 are well modelled by piece-wise linear curves [15, 26, 22] (Figure 1A). For simplicity, we neglect withinpopulation diversity in trajectories; in Appendix D we demonstrate that this assumption does not substantially change the predicted effectiveness of PCR testing against most pathogens. This allows us to characterize pathogens according to the mean time from infection to reach peak viral load τp, the mean time from peak viral load to recovery, τr, and the peak viral load, Vp. Log viral load V is then:

(A) An example viral load trajectory, characterized by peak viral load and times from infection to peak, and from peak to recovery. All viruses are presumed to begin with V0 = 3 · 10−3, based on initial infection with one viral particle in roughly 300ml of respiratory fluid [25]. (B) Test sensitivity vs. viral load for a typical PCR assay. (C) Expected transmissions per day vs. viral load. (D) Test sensitivity vs. time since infection for this pathogen, computed by passing the time series in (A) through function (B). (E) Expected daily transmissions vs. time since infection, computed by passing the time series in (A) through function (C). The area under the curve in (E) is R0 for this pathogen. (F-G) The impact of mass testing on transmission. Expected transmissions are represented by areas under curves. The upper black lines illustrate the baseline scenario (with R0 = 4.5 expected transmissions). With mass testing, the purple areas show transmissions occurring before receiving a positive test result, while the non-overlapping orange areas show transmissions occurring from people that don’t adhere to either testing or isolation. Dashed lines show the fraction of people who have not yet tested positive. F) Testing every 4 days with a 24 hour test turnaround. G) Testing every 2 days with a 12 hour test turnaround. With less frequent and more delayed tests (F), transmission reduction is modest. With more frequent and less delayed tests (G), most transmissions are prevented, and the remaining transmissions are either early in infection or due to non-adherence 3to the testing and isolation policy. Both scenarios use tests with a limit of detection of 102 copies/ml (as described by Equation 2), 90% adherence to testing, 90% effective isolation (conditional on being a person who gets tested), 6 days from infection to peak viral load, and 6 days from peak viral load to recovery.
 For most of this analysis, we assume viral load trajectories are symmetric, i.e. τp = τr; al-ternative trajectory shapes can be explored further in the interactive app at https://frequent-testing.shinyapps.io/shinyapp. V0, the initial viral load when infected, is set to 3 · 10−3 based on initial infection with one viral particle and roughly 300ml of respiratory fluid [25].
Note that inactive virus material can persist for a long time following clearance of live, potentially infectious virions, which can prolong the time from peak viral load to a negative test result. This process might therefore be better modeled as the sum of exponential declines rather than a single exponential decline. In this context, our piecewise curves can be interpreted as live viral load peaking at VP. Test sensitivity (probability that a sample from an infected person is classified as positive) depends strongly on the person’s viral load at the time the sample is collected [27]. We neglect the contribution of dead viral load, because its only effect is, under less frequent testing regimes, to catch infected individuals too late to prevent transmission.
We model the dependence of test sensitivity on live viral load with the sigmoid function:
 This equation is characterized by peak test sensitivity, Smax, the viral load LOD50 at which Smax/2 of samples from infected people are classified as positive, and a parameter k that specifies the width of the intermediate region. For PCR tests, we set LOD50 = 102 copies/ml and k = 6 so that the distance between 5% and 95% sensitivity is about a multiple of 10 as in [27]. We set Smax = 99.5% to account for sample mishandling. Antigen tests are modeled as having a limit of detection of 105.4 copies/ml and k = 1.3 based on the average sensitivity Wagenhauser et al measured for the ancestral COVID-19 variant [28] (although this varies considerably between manufacturers, variants, and presumably different pathogens). The maximum sensitivity, Smax, is reduced to 90% to account for errors in self-administered antigen tests. Default PCR and antigen sensitivity curves are shown in Figure 1B.
While there is consensus that higher viral load increases the expected number of transmissions TV (V), quantitative data on this relationship is very limited. Ke et al. [29] used the measured relationship between SARS-CoV-2 viral load (as assessed by PCR) and cell culture positivity as a proxy for the relationship between viral load and transmission. We use Ke et al.’s saturation model [29] in Equation 3, with SARS-CoV-2-inspired default values of Nc = 13 contacts per day [30], shape parameter h = 0.51, and an infectiousness midpoint of Km = 8.9 · 106copies/ml. Ke et al. included a parameter θ to reduce the maximum infectiousness below 100%; we increased this from 0.2 to 0.3, corresponding to an increase from 18% to 26% per contact.
 These values of Km and θ are in broad agreement with Marc et al’s [31] use of SARS-CoV-2 contact tracing data to connect estimated viral load at time of exposure with transmission probability. Our assessment of agreement is focused on non-household contacts, because household contacts typically are exposed over multiple days, corresponding to multiple opportunities for transmission, with a correspondingly higher overall maximum probability of infection. Equation 3 for expected daily transmissions as a function of viral load is shown in Figure 1C.
Test sensitivity over time is computed as the composition of Equations 1 and 2, SV (V (t)), shown in Figure 1D. Similarly, the expected rate of transmissions as a function of time since infection is computed as the composition of Equations 1 and 3, TV (V (t)), shown in Figure 1E. For pathogens where noticeable symptoms cause people to reduce interactions and therefore transmit to fewer people, NC(t) can be made a function of time since infection. The simplest version of this symptomatic model is given by equation 4, where τs is the time of symptoms, and S is the fraction reduction in contacts when symptomatic.
 The expected number of transmissions per infected person (in an immuno-naive population with no behaviour modifications),
  · dt. To achieve a given R value, we modify the peak viral load, Vp, in Equation 1, as needed.
Similar to Ranoa et al. [13], we evaluate the effect of frequent testing by computing the fraction of transmissions it prevents, but we expand on their approach by explicitly modelling test sensitivity and infectiousness as depending on viral load over time. Let Tt(t) = TV (V (t)) be the expected number of daily transmissions evaluated t days after infection. Let St(t) = SV (V (t)) be the probability that a sample taken on day t is positive. Consider a testing policy with a set period, P, between sequential tests. An individual whose first post-infection sample is collected an offset κ days after infection will test negative on all samples collected on or before day t with probability
 We compute the probability that a person knows they are positive at time t after infection by averaging across values of κ drawn from Uniform(0, P) (because samples are collected every P days and infection timing is independent of test timing). Allowing for a fixed delay time, δ, between sample collection and receiving results, the probability that at least one sample taken before t − δ is detected as positive is
 The effective transmission rate at time t is reduced by a factor PP (t) when informing a person that they are infectious causes them to isolate effectively at that time. The expected number of transmissions prevented by frequent testing followed by perfect isolation after testing positive can then be calculated by integrating PP (t) · T (t) over time (Equation 7). We define σ as the fraction of transmissions that would be prevented by frequent testing given perfect adherence.
 Generalizing to imperfect adherence, let γ be the probability that a person adheres to regular testing, and β capture the degree to which a positive test results causes a person to reduce their transmission, with a fraction σ of their counterfactual expected transmissions having not yet occurred. Then mass testing reduces the effective reproduction number according to:

3 Results
Our results show that adhered-to mass testing can be an effective strategy to prevent infections and hospitalizations. To better understand this strategy, we begin by decomposing transmissions over the course of a typical infection into two broad failure modes: (1) non-adherence or (2) insufficiently sensitive, frequent, or rapid testing. Figures 1F-G show expected transmissions over time when using two testing strategies against an example pathogen. Individuals that do not adhere to testing or do not effectively isolate when detected as positive, transmit on the same schedule as in the unmitigated scenario, as shown by the orange regions in Figures 1F-G (which are identical because adherence is the same for both strategies). If testing is sufficiently frequent and results are not substantially delayed, then individuals adhering to the policy transmit at a much lower rate. In this case, transmissions from adherent individuals are usually earlier in infection, as shown by the purple region in Figure 1G. When testing is more delayed (in this example 24 hours instead of 12 hours) and less frequent (here every 4 days instead of every 2 days), then adherent individuals transmit substantially more and relatively later in infection, as shown by the larger purple region in Figure 1F.
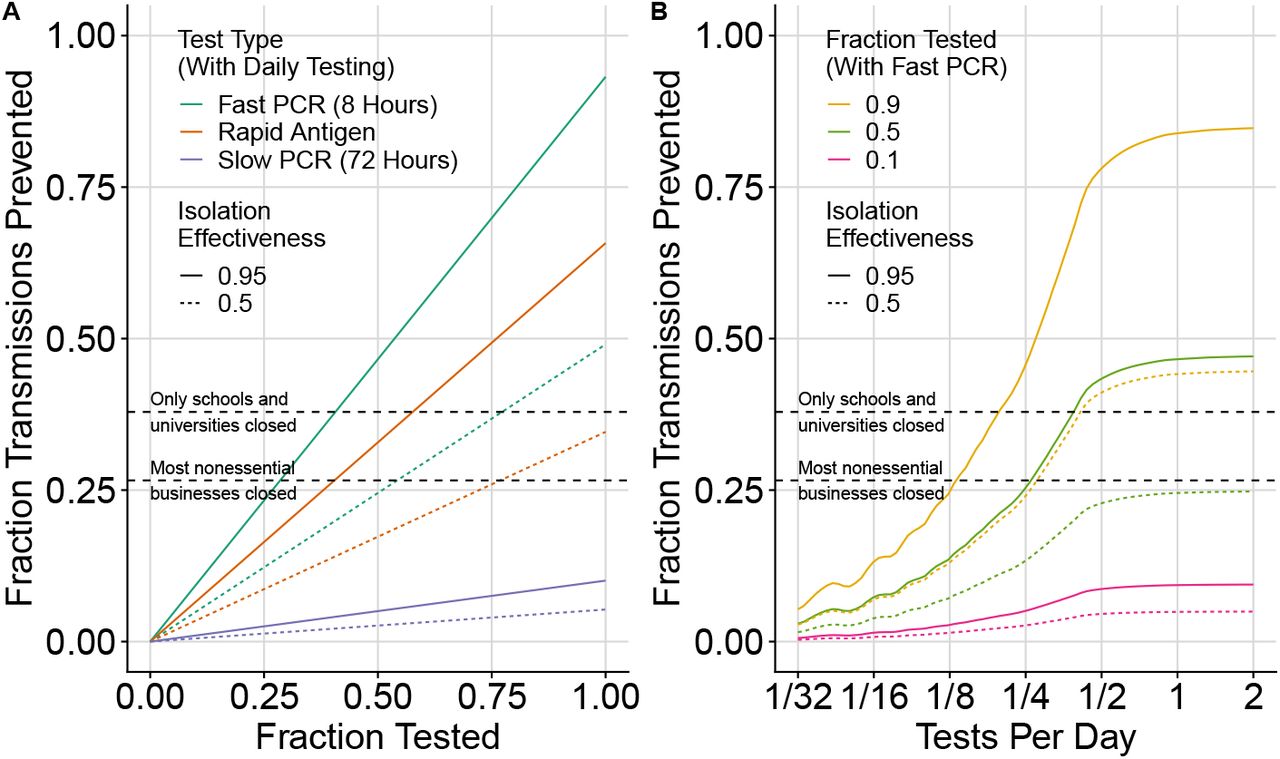
The number of infections averted depends on several factors, including adherence to testing, effectiveness of isolation, the frequency of testing, and the type of test. We compare transmissions prevented by mass testing with other commonly used strategies against the ancestral variant of SARS-CoV-2 in Figure 2. The proportion of prevented transmissions depends linearly on adherence to testing and isolation (figure 2A), as described by the dependence on γ and β in Equation 8. The benefit from frequent testing saturates when testing more than every 2 days for the ancestral variant of SARS-CoV-2 (Figure 2B), with 70% more infections averted when testing every 2 days compared to every 4 days. Fast PCR testing every 3 days with 50% adherence to testing and 95% effective isolation (Figure 2B) achieves the same fraction reduction in transmissions as school and university closures (38%, as assessed by Brauner et al. [32]). Higher adherence with more frequent testing is able to further reduce transmissions (curves in figure 2B above upper dashed line).

depends on adherence to testing and isolation (A) and test frequency (B). SARS-CoV-2 is parameterized as taking 5 days to reach peak viral load, symptoms occurring on the same day as peak viral load, a 50% reduction in transmissions after symptoms, and R0 = 2.75 (including the behaviour modification from symptoms). In (A) we model daily testing with either a rapid antigen test (0 hour delay, LOD50 = 105.4, orange), or a fast PCR test (8 hour delay, LOD50 = 102, green), or a slow PCR test (72 hour delay, LOD50 = 102, blue). For (B) we model only the fast PCR test. For this pathogen, the benefit of frequent testing saturates when testing more often than every 2 days (B). Estimates by Brauner et al. [32] of the fraction reduction in transmissions from school and university closures (38%) and business closures (27%) are added for comparison (dashed lines).
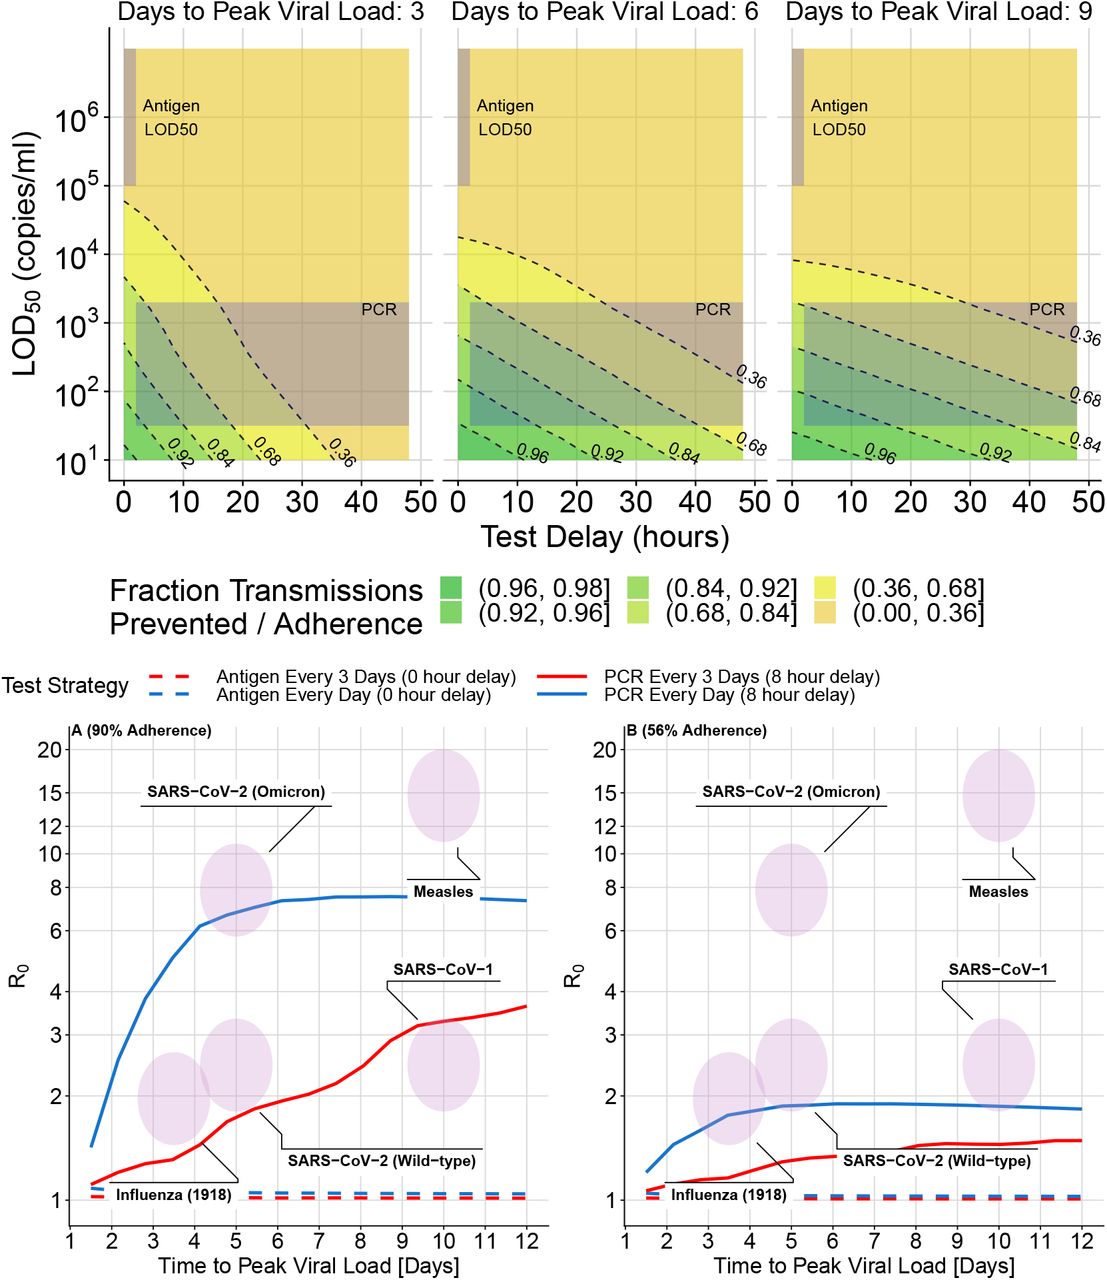
Fast reporting of test results is more important for diseases that reach peak viral load quickly (e.g. influenza). In Figure 3A, the fraction reduction in transmissions for a perfectly adhering individual is shown as a function of LOD50 and test delay for three example pathogens that take 3, 6, and 9 days to reach peak viral load, with peak viral load modified so that R0 = 3. The contours are much steeper for the pathogen that takes 3 days to reach peak viral load than for the other pathogens, which means that the relative importance of fast reporting is greater. When using PCR tests, the number of transmissions with a 20-hour delay compared to a 10-hour delay is 3.2x larger with 3 days to peak viral load, 2.0x larger with 6 days to peak viral load, and 1.6x larger with 9 days to peak viral load. With a low limit of detection (102 copies/ml) and fast reporting (10 hours), adhered-to daily testing is able to prevent more than 92% of transmissions for a pathogen with 3 days to peak viral load, and almost 99% of transmissions for a pathogen with 9 days to peak viral load.

for three hypothetical pathogens that take 3, 6, and 9 days to reach peak viral load. The extent of transmission reduction from an infected person who tests daily and isolates effectively if positive depends on test turnaround time (x-axis of (A)), test limit of detection (y-axis of (A)), and time to peak viral load, with peak load varying accordingly to maintain R0 = 3 (3 panels in (A)). For shorter latent periods (left of (A)) delays are more important (closer contour lines along horizontal transect). Test sensitivity is similarly important for all latent periods; (similarly spaced contour lines along vertical transect). Shaded areas indicate likely LOD50 and delay time values for PCR vs. antigen tests. We use k = 6 and Smax = 99.5% from Equation 2 for all tests in (A) and for PCR tests in (B) and (C). This is overoptimistic about the maximum sensitivity (Smax) of antigen tests, and invokes a sharper transition region than typical, so the shaded region in the upper left corner of each subplot in (A) corresponds with the LOD50 of antigen tests but not the shape of their test sensitivity curve. For (B) and (C), antigen tests are computed more accurately with LOD50 = 105.4, k = 1.3, and Smax = 0.9. Rapid PCR tests (e.g. 8 hour turnaround) achieve dramatic transmission reduction under all conditions considered. Calculations assume perfect adherence to daily testing and to isolation following a positive test result. The fractional reduction in transmissions is proportional to adherence, so results can be modified for other scenarios by multiplication (e.g. if the fraction reduction is 0.8 with perfect adherence, it would be 0.4 if 50% of people tested frequently and isolated effectively if positive). Pooled PCR tests will be shifted upwards by the appropriate pooling factor, and are likely to also have increased delay. (B) shows cross-sections that hold the limit of detection constant while varying the test delay and (C) shows intervals other than daily testing.
Because the limit of detection (LOD50) for antigen tests is close to the viral load where someone is substantially infectious (Km), the predicted number of transmissions prevented is lower than for PCR. LOD50 being close to Km also makes model results for antigen tests more sensitive to uncertainty in parameters, as demonstrated in Appendix A. Figure 3B shows that daily antigen testing prevents fewer transmissions than daily PCR testing unless the PCR reporting delay is more than a few days (e.g. 1 day for a pathogen with 3 days to peak viral load, and 2 days for a pathogen with 6 days to peak viral load). If antigen testing is done twice daily, Figure 3C shows that it could prevent almost 80% of transmissions; however this result should be interpreted with caution because this model assumes that subsequent test results are uncorrelated when viral load is controlled for (while in reality tests might have shared dependence on factors that might not change for a person in a day). The effectiveness of tests with different parameters can be explored using the app at https://frequent-testing.shinyapps.io/shinyapp.
To estimate the effectiveness of potential mass testing strategies against a broader range of pathogens, we compute Re while varying both R0 and time to peak viral load, finding that some strategies might be able to independently control a pathogen. Using the same approach as Figure 3, we find that daily PCR testing with an 8 hour delay could avert 0.96*adherence of transmissions for a pathogen like 1918 influenza (3.5 days to peak viral load, R0 = 2.5) and 0.98*adherence for a pathogen like wild-type SARS-CoV-2 (5 days to peak viral load, R0 = 2.5). Here, adherence is de-fined as the product γ·β from Equation 8, or equivalently E[Isolation Effectiveness|Tests Regularly]∗ P(Tests Regularly).
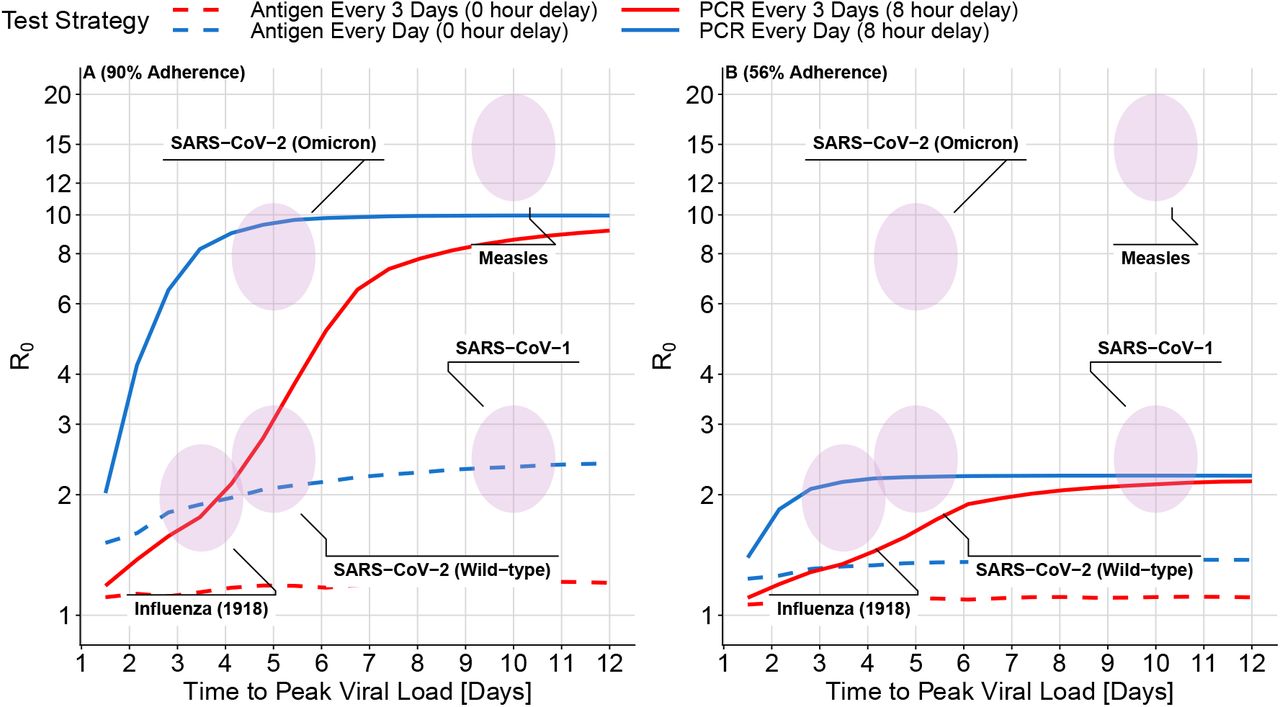
Mass PCR testing with overall adherence of 90% and an 8 hour reporting delay is sufficient, on its own, to control all of the example pathogens in Figure 4A except for measles (which has a very high R0). Lines in Figure 4, each representing a different testing policy, indicate the highest controllable value of R0 for each testing policy, found by increasing the peak viral load, Vp, until Re in Equation 8 is equal to 1. Figure 4A shows very high adherence (95% adherence to testing, and 95% effective isolation), B shows moderately high adherence (70% adherence to testing followed by 80% isolation adherence if positive). While antigen testing in Figure 4 is insufficient on its own to control most pathogens, it can still substantially reduce the number of transmissions that are most difficult to control otherwise: transmissions from cases that have high viral load and are therefore highly contagious even during brief exposures. Using antigen tests with a lower LOD50 value can also dramatically change the results; this can be explored further at https://frequent-testing.shinyapps.io/shinyapp.

Viruses in the area under each line can be controlled by that testing strategy alone, in the absence of other measures. High adherence (A not B) and high test frequency (blue) are required to control a wide variety of challenging viruses. The highest value of R0 that can be controlled with a testing strategy (computed by increasing peak viral load until Re in Equation 8 is equal to 1) is shown as a function of time to peak viral load (x-axis), test type (solid vs dashed), and testing interval (red vs blue). Shaded ovals indicate the approximate values of R0 and time to peak viral load for a variety of viruses. Panel A) shows high adherence: 95% adherence to testing and 95% adherence to isolation if positive. The maximum R0 depends on the product of these two numbers. Panel B shows more moderate 70% adherence to testing followed by 80% isolation adherence if positive. Moderate adherence (B) might be inadequate on its own to control an outbreak of the original wild-type SARS-CoV-2 variant, but makes an important contribution when combined with other measures. As the speed of viral exponential rise and fall (x-axis) is varied, the same R0 is achieved by adjusting peak viral load. For simplicity, symptom onset does not trigger behaviour modification; in Appendix B we show similar results when symptoms are detected 24 hours before peak viral load and cause a 75% reduction in contacts (while holding R0 constant and increasing the peak viral load to compensate for fewer contacts).
While the correct model parameters are unknown for novel pathogens (and only partially understood for existing pathogens), the predicted effectiveness of frequent PCR testing is quite robust to changes in parameters. Different pathogens might transmit with a different proportionality factor with respect to viral load, due e.g. to how well the virus binds human cells; this will be reflected in different values of Km. The minimum infectious dose for COVID-19 is thought to be around 100 particles [33] and the minimum infectious dose for any pathogen has to be ≥ 1. Therefore if transmission occurs via similar mechanistic routes to COVID-19 it is unlikely for Km to be reduced by more than a factor of 100. In Appendix A, we explore the effect of a 100-fold lower Km and show that antigen tests fail, on their own, to control any of the pathogens, while frequent PCR testing does only slightly worse. Similarly, the effectiveness of PCR testing is robust to behaviour modifications due to symptoms (Appendix B) and changes in viral load trajectory shape (Viral Load tab of app: https://frequent-testing.shinyapps.io/shinyapp).
Sustained mass testing was infeasible during much of the COVID-19 pandemic, but there is now time to develop testing technology and infrastructure, so that less socially costly disease control measures are available for future pandemics. Promising newer technologies like multiplexed sequencing are becoming faster and more affordable [34]. Alternatively, more mature technology like saliva-based PCR testing can be scaled up with less technical risk, as discussed in Appendix C. In Appendix C we also discuss the feasibility of a potential implementation in terms of cost, public acceptability, infrastructure, and timing in a pandemic. We find that there are feasible solutions to deploy a relatively inexpensive mass testing program early in a pandemic, but that the primary logistical barrier is building and maintaining enough testing infrastructure in advance.
4 Discussion
Our findings illustrate that large-scale, rapid testing can effectively control a respiratory virus pandemic, but that adherence to frequent testing and to isolation is crucial to achieve this impact. A partially adhered-to mass testing strategy could also be used to replace more restrictive interventions such as school or business closures. For the wild-type SARS-CoV-2 variant, assuming 5 days to peak viral load and R0 = 2.5, overall adherence of 61% would be needed to bring Re < 1 in the absence of other measures. If work from home, masking, voluntary outdoor socializing etc. succeed in achieving Re = 1.5, then adherence of 34% would be needed in a homogeneous population to further reduce Re < 1 and achieve control. This modest level of adherence seems achievable, and could avoid the need for more draconian lockdowns. However, in scenarios where the test result delay time is long (e.g. 72 hour) compared to the time to peak viral load, mass testing becomes substantially less useful, bringing down from R0 = 2.5 to Re = 2.3 and 2.4 in these two examples of 61% and 34% adherence. Contact tracing will magnify the benefits of mass testing [35], and with long test delays, the indirect benefits of testing on contact quarantine become more important than the direct effects on case isolation.
Our model assumes a well-mixed population, but we note that if there is a connected group of people that are unable or unwilling to adhere to testing or isolation, then the epidemic could escape control within that sub-network. Conversely, as seen for COVID-19 in some universities and film studios, smaller groups of people might adopt frequent testing to control transmission within their sub-network, in scenarios where there isn’t broader public support for disease elimination. The smallest, simplest example of this is rapid testing of a caregiver for someone at elevated risk of severe disease, which can reduce the probability of infecting the shielded person by 90+% (see Figure 3).
A scenario where massive but non-universal testing capacity could be useful is to avoid school closures by frequently testing students and staff. School closures in the US were estimated to have cost $6 trillion USD during COVID-19 pandemic, but some schools avoided closures by testing frequently. If testing is done frequently enough and a negative test is a prerequisite for attendance, then the probability of an infected contact at school transmitting the disease could be 10-20 times lower than otherwise (see Figure 3 for the 90-95% fraction reduction in transmissions - depending on the virus). Unless closing schools reduces children’s contacts by a factor of at least 10-20, effective testing at school could actually be safer than closing schools and not testing. This might be a good use of testing capacity that, while massive, is nevertheless insufficient on its own to control a pandemic - potentially not avoiding all social distancing measures, but avoiding school closures. While the school setting might have above the usual R0, it is also conducive to the enforcement of test and isolation policies.
In a scenario where a pathogen causes sufficiently severe disease such that most people adopt social distancing, essential workers might choose not to work because of fear of infection. Frequent testing of essential workers and people they interact with could dramatically improve their safety (in addition to other important safety measures like effective PPE [36]), and reduce the probability of infecting their family, which could increase the number willing to continue working [37].
Frequent mass testing of asymptomatic individuals inevitably risks large numbers of false positive tests leading to isolation both of individuals who are not infected, and of individuals who were infected but are no longer infectious. However, even with less specific antigen tests, the total number incorrectly isolated is manageable and fairly small, despite an expected reduction in positive predictive value as true positive individuals are removed from the population and thus prevalence in the remaining tested population goes down [38]. The number of false positives could be further reduced by using more specific tests like PCR, or the duration of unnecessary isolation could be shortened by re-testing and ending isolation early after multiple negative results.
This work focuses on population-wide asymptomatic testing, but given limited testing capacity, it is most efficient to prioritize symptomatic testing before asymptomatic testing [39]. For simplicity, we did not model people seeking additional testing because of symptoms, although we did model behavior modification due to symptoms even in the absence of a positive test. In a related work, we use a branching model to estimate the benefit of adding symptomatic testing and contact tracing to a mass testing policy, finding that in some scenarios adding contact tracing could allow the mass testing frequency to be halved with the same reduction in transmissions [35].
We made the simplifying assumption of transmission risk being independent of location and time, but testing policies could be made more efficient by focusing on higher risk settings. For example, collecting samples from people so that their test results are returned right before attending an event would prevent even more transmissions. A location-based strategy could target more frequent testing to regions with an active outbreak, and less frequent surveillance testing for new outbreaks in previously clear regions, requiring fewer tests in total as a country approaches elimination.
The COVID-19 pandemic caused an estimated $16 trillion USD in harm in the USA [40], and efforts to contain it were also very costly (e.g. $2.5 trillion USD in lost future productivity from four months of school closure in the USA [41]). Another pandemic at least as severe as COVID-19 is likely in the next few decades, and many countries are not prepared. We show that with sufficient testing capacity and good adherence, mass testing could be effectively used to mitigate transmission and avoid the much more costly interventions and harms of future pandemics or reactions to future pandemics. This motivates substantial effort to design a testing system with high enough throughput, and to build it before the next pandemic.
Data Availability
All code developed for this study is available online at
A Sensitivity to Infectiousness Midpoint
To test the sensitivity of our results to the infectiousness function in Equation 3, we reduce the viral load at which half of peak infectiousness has been reached from Km = 8.9 · 106 to Km = 8.9 · 104. With a 100 times smaller value of Km, the viral load needed to transmit is substantially lower, while the viral load needed to detect infection stays the same. In Figure 5 we see that with the reduced value of Km, frequent PCR testing does slightly worse than in Figure 4, while antigen testing fails to control any of the pathogens. This is because in this extreme scenario, PCR tests are still able to detect infections before people become substantially infectious, while the antigen tests fail to detect infected people even at their highest viral load.

Figures 3 and 4, are recomputed with the viral load midpoint for infectiousness reduced from Km = 8.9 · 106 to Km = 8.9 · 104. In the upper 3 panels we see that for PCR tests, the number of transmissions prevented is slightly lower than in Figure 3, and for antigen tests less than 30% of the transmissions are prevented. In the bottom two panels, PCR tests are able to control a similar range of epidemics as in Figure 4 (with slightly reduced effectiveness) and antigen tests are unable to substantially control any outbreaks.
B Sensitivity to Symptom-Based Behaviour Modification
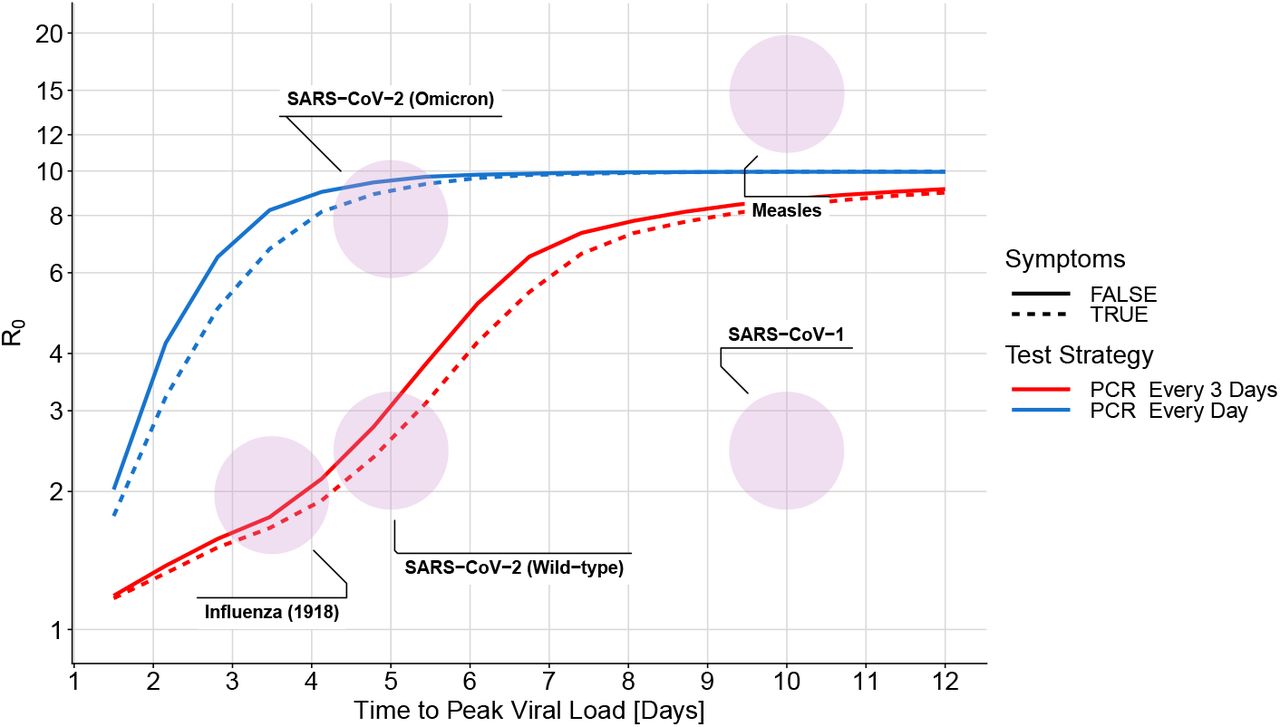
Modified assumptions regarding timing of symptoms and behaviour change due to symptoms do not substantially change the estimated effectiveness of mass testing. Figure 6 is generated using the same parameters as Figure 2, except symptoms occur 24 hours before peak viral load instead of at the time of peak viral load, and contacts are reduced 75% instead of 50% after symptoms. Because R0 is held at the same value of 2.75, the peak viral load for the scenario with earlier symptoms is higher. The predicted impact of testing in these two scenarios is almost identical, except with earlier symptoms, slightly more frequent testing is needed. This is mainly because the increase in peak viral load shifts more transmissions earlier in the infection, which requires more frequent testing to detect in time. Similarly, Figure 7 shows a modified version of Figure 4 in the scenario where symptoms are detected 24 hours before peak viral load, and cause a 75% reduction in transmissions. For a fixed R0, the addition of symptoms changes the shape of the infectiousness profile. Daily testing performs slightly worse in this scenario because more transmissions occur earlier in infection. With testing every 3 days for fast viruses, the increase in test sensitivity from a greater viral load is a more important effect, causing the testing effectiveness to increase slightly.

Compare to symptoms 0 days before peak viral load and a 50% reduction in contacts in Figure 2). Because R0 is kept at 2.75, the additional behaviour modification from symptoms causes the computed peak viral load to increase slightly, causing transmissions to shift earlier in infection. Except for a slight reduction in the effectiveness of slow PCR tests, the modified symptom parameters do not substantially change Figure 2.

As in Figure 4, the solid lines do not include symptoms. The dashed lines are computed with symptoms 24 hours before peak viral load and a 75% reduction in contacts after symptoms. For a fixed value of R0, the addition of symptoms causes the computed viral load to increase and transmissions to shift earlier in infection. Earlier transmissions are generally more difficult to control, so the effectiveness of mass testing decreases slightly because of this.
C Implementation Feasibility
For a mass testing strategy to be effective, there are several things that must go right: (1) tests must be available early in a pandemic; (2) there must be scalable logistics for fast transportation of tests/samples; (3) there must be sufficient public support for the strategy; (4) this support must be translated into sufficient adherence to testing and effective isolation; (5) there must be enough test equipment and skilled technicians; (6) the variable cost per test must be affordable. While these challenges are significant, the massive costs of either social distancing or unchecked disease, and the difficulties of effective contact tracing, motivate a thorough investigation of mass testing as a potential solution, either as an alternative to distancing and contact tracing, or as an adjunct.
In this section we focus on PCR testing of saliva samples because it is a mature technology that has been proven at scale and can be functional within weeks of detecting a pandemic. Rapid antigen testing is another option that has been proven at scale, but for it to be useful in future pandemics, development, manufacturing, and deployment would have to be much faster than they were during the COVID-19 pandemic. Specifically, rapid antigen tests became available almost a year after detecting the COVID-19 pandemic [42]. There are also several other promising technologies, e.g. based on multiplexed next-generation sequencing [34, 43], LAMP [44], CRISPR [45], or even particle imaging [46]. The aim of this section is to demonstrate one relatively low-risk strategy for scaling up, but not to argue that it is the best or only possible solution for mass testing. In the ideal case, redundant technological approaches and infrastructure could improve robustness to unanticipated challenges.
C.1 Time to Deploy
PCR can be ready within weeks of detecting a pathogen; e.g., Corman et al. published a protocol for SARS-CoV-2 on January 23, 2020, 13 days after the pathogen sequence was first published [47]. The main decision that needs to be made is which amplicon targets to use to selectively amplify RNA or DNA from the pathogen of interest (e.g. distinguishing SARS-CoV-2 from other coronaviruses) [48]. After a protocol is chosen, oligonucleotides for the target amplicons can be synthesized with a high-throughput solid phase process [49] and distributed to testing labs. Redundancy in protocol design and test kit manufacturing would be prudent to avoid delays like the ones experienced by the USA in early 2020 [50].
C.2 Logistics: Sample Collection and Transportation
Cost-effective deployment at scale could be achieved by borrowing approaches from home delivery services, a market that has recently expanded and successfully overcome many logistical challenges. As an example, both unused sample collection kits and self-collected saliva samples could be left at unstaffed booths (potentially with security cameras to deter misuse). This could be done cheaply by providing a tray of empty tubes from which users detach a QR code, collect and seal a saliva sample, and place the tube in a box. Rideshare or delivery companies could be hired on demand to frequently (i.e. ideally with less than 4 hours wait time to achieve a total turnaround less than 8 hours) pick up the boxes of samples at a low average cost per sample (e.g. if 50 samples were transported by a $30 USD Uber ride). In low or middle income countries (LMICs) the available budget would likely be lower, but the cost of labour would also be lower. The right choices for logistics depend on the setting, but using self-collected samples with batched delivery through existing consumer delivery services or similar could likely keep the cost of logistics below $1 per sample in high income countries and considerably lower in LMICs.
C.3 Public Support
Mass testing depends on public support, which could potentially be improved by making the overall approach simple and non-invasive. For example, several schools used saliva or gargle based testing because it avoids the discomfort of nasopharyngeal swabs [51] and samples are easily self-collected without specialized supplies. Saliva tests sometimes had higher sensitivity early in infection [52], although the cheap, low-volume SalivaDirect test had slightly worse sensitivity [53]. Using easily accessible locations where tests can be completed with a few minutes could also improve the overall experience. Because public support is so important for mass testing to be successful, it is likely worthwhile to make significant trade-offs in test sensitivity, delay time, or cost if necessary. However, if there remains insufficient public support for mass testing of the entire population, testing could be focused on schools or senior living facilities.
C.4 Testing and Isolation Adherence
The achievable level of testing and isolation adherence depends on public sentiment, which likely depends strongly on the severity of the pandemic. In milder pandemics, adherence might depend on voluntary participation, as enforcement might be too extreme of an infringement on civil liberties. However, in a very deadly pandemic without viable alternative control strategies, there might be support for more strictly enforcing adherence. This might be easier if the verification process is smooth, and if those who do not wish to adhere have some viable (albeit restrictive) alternative option to partially quarantine rather than test. E.g., proof of a recent negative test could be required for entry into public spaces where there is substantial risk of transmission (similar to testing requirements for flights or some schools or workplaces for SARS-CoV-2).
Data on the effectiveness of home isolation is limited [54], but isolation in dedicated facilities is likely to be highly effective. Even quarantine in poorly chosen facilities that mixed air between the infected and uninfected was shown to be at least 99.4% effective at preventing transmissions of SARS-CoV-2 from infected cases in Australia [55]. Isolation could be incentivized by fully replacing lost wages (the COVID-19 pandemic typically saw partial wage replacement at best [56]), and providing generous support (e.g. accommodation, food, childcare, medical care) [54]. Successful local control of a pandemic corresponds to fewer than 1/1000 people infected at any time (and hopefully far fewer), meaning that spending double each person’s salary to support their isolation would cost less than 2/1000 of GDP.
C.5 Testing Capacity: Equipment and Skilled Labour
Test capacity depends on equipment and skilled labour. Capacity was a significant barrier to performing mass testing during the COVID-19 response when there was little time to manufacture, let alone design, new equipment. Sample pooling was sometimes used to test more people using a fixed amount of available equipment, at the expense of decreased sensitivity, increased complexity, and many re-tests when prevalence is high [57].
A simple way to build PCR capacity in preparation for future pandemics is to manufacture more conventional PCR equipment with the plan of using sample pooling. Minhas et al’s description of a national lab in Pune, India [58] can be used as a basis to estimate the upfront investment and number of trained staff needed for this strategy, although we note that locations with high labour costs would probably employ fewer people while using more expensive equipment. Their peak capacity was 1800 samples per day, they employed around 100 people, and the cost of their diagnostic equipment was 15,592,420 INR, which is roughly equivalent to $188,000 USD. The same lab could process samples that were pooled 10x at time of collection (having all 10 individuals home isolate until individually retested), thus processing roughly 18,000 samples per day. 100 people employed in a lab per 20,000 sampled is 1/200 of the total population; this would be highly costly to staff in preparation. As a comparison, 1/2000 people are on ‘standby’ as firefighters in the UK [59]. Rapidly recruiting skilled technicians when a pandemic is detected is another option, but this would be difficult to do in 1-2 months and only about 1/1000 people are currently employed in the medical diagnostics industry in the US [60].
Alternatively, there has been recent progress on highly automated workflows for PCR diagnostics [61, 62, 63] that require fewer lab technicians. One example is endpoint PCR [64], which uses a waterbath instead of the more common piezoelectric system, for higher-throughput thermal cycling at lower cost. A large British diagnostics company, LGC Group, claims to be able to test 150,000 samples per day [65] with two technicians per shift and an upfront cost of $902,000 USD for the equipment [personal communication]. We note however that a real-world deployment of this technology only reached 65,000 samples/day with an infrastructure cost of $186M USD [66]. The reasons for such a high cost include construction of a 220,000 square foot facility, while the low output likely reflects reliability issues with early-stage technology [67].
One strategy for building and maintaining high-throughput PCR for the purpose of pandemic readiness, within a developed country, is to make research institutions eligible for targeted grants. These grants would provide standardized ultra-high-throughput PCR equipment, which the grantee would be free to put to innovative research use between emergencies. In exchange, grantees would guarantee a mobilizable workforce able to use the equipment for mass testing, as assessed through a system of occasional drills. Such a scheme would have the benefit of standardizing the equipment, once an appropriate prototype is available. The current LGC technology would first need clearer proof of concept, and it is possible that more R&D is first required to build an adequate system.
C.6 Variable Cost per Test
Even when there is sufficient equipment and trained personnel, there is a per-test cost that determines how much countries can afford to test in a pandemic. This cost depends on the price of consumables and the price of logistics (discussed in Section C.2), and was fairly high in most countries during the COVID-19 pandemic (e.g. $24 - $55 USD per test in the UK [68]). Pooled testing substantially reduced the cost of PCR testing during the COVID-19 pandemic by using less consumables per sample (e.g. Mirimus Inc. tested students in New York for $10/sample [69], and China tested millions of people for $1.50/sample [57]). SalivaDirect demonstrated that low prices could be achieved by using a small volume of the cheapest available reagents, reducing the cost of consumables to $1.21/sample with an extraction free protocol [53]. In Section C.5 we argued that the cost of logistics in high income countries could be less than $1 per sample, so with consumables included the cost per test could be around $2. For wealthier countries, a cost of $2/person/day is very affordable if it averts most of the harm of the pandemic, and for LMICs, the cost could potentially be further reduced with sample pooling and when considering the lower cost of delivery. For the USA, the cost of testing every person daily for a year would be about $240 Billion, which is almost 10 times smaller than the $2.2 Trillion spent on the CARES Act [70] in response to the COVID-19 pandemic.
D Impact of Heterogeneity in Transmissibility and Time to Peak Viral Load
We modeled each pathogen as having a fixed expected number of transmissions (R0) and time to reach peak viral load (τp) for every infected person. In reality, viral load trajectories will be different for every person who is infected, which could be more accurately modelled as drawing R0 and τp from a distribution. By only computing Re at the average parameter values instead of integrating over the entire parameter distribution we might introduce some error. I.e., we made the approximation that E[Re(τp, R0)] ≈ Re(E[τp], E[R0]), where [τp, R0] is a random vector.
If Re(τp, R0) is a linear function, then this approximation is exact. If Re(τp, R0) is well approximated by a linear function in the neighborhood occupied by the parameter distribution for a pathogen, then the error introduced by this approximation is therefore small. Figure 8 shows how Re depends on R0 and τp for PCR tests and antigen tests (assuming perfect adherence - lower adherence can be computed with a linear transformation of the displayed function). Approximately linear regions in the function are shown as either not having any contour lines (flat) or having consistent spacing between straight contour lines (increasing linearly in the direction of a constant vector). For both types of tests the function is nonlinear when τp < 3 days, and for antigen tests the function becomes nonlinear with lower values of R0. If the [τp, R0] distribution for a pathogen does not have much mass in these non-linear regions, then the point approximation does not cause significant error.

Re vs. R0 and τp for daily antigen testing (with immediate results) and PCR testing (with an 8 hour result delay).
Acknowledgements
We would like to thank Nirav Merchant and Greg Gibson for sharing their experience with real-world testing programs, Kayla Zochowski for advice on PCR technology, Christophe Fraser for suggestions on figures, and Luca Ferretti and Chris Wymant for advice on framing. JP’s work is supported by Open Philanthropy and the Wellcome Trust (Collaboration Award 206298/Z/17/Z, ARTIC-Network). JAH is supported by a Wellcome Trust Early Career Award (grant 225001/Z/22/Z). CW is supported by Sir Henry Wellcome Postdoctoral Fellowship (reference 224190/Z/21/Z). JPG’s work is supported by the UK Health Security Agency and the UK Department of Health and Social Care. These funders had no role in the study design, data analysis, data interpretation, or writing of the report. The views expressed in this article are those of the authors and not necessarily those of the UK Health Security Agency or the UK Department of Health and Social Care.
Appendices
Footnotes
Funding statement updated along with minor edits to the language in the main text and appendix.
References


