
Abstract
Background APOL1 variants G1 and G2 are common in populations with recent sub-Saharan African ancestry. They are known to influence health conditions: most notably being associated with protection from human African trypanosomiasis and increased risk of susceptibility to chronic kidney disease. Association studies have often considered G1 and G2 as equivalent, however we recently presented evidence of substantial phenotypic differences between carriers of the two variants. An additional APOL1 variant, N264K, has previously been shown to modify the damaging effect of G2 on the kidney. Here, we examine the influence of these variants on APOL1 protein concentration.
Methods Using a cohort of 1,050 UK Biobank participants with recent African ancestry, we compared APOL1 protein concentration in carriers of variants G1, G2, and N264K and performed a genome-wide association study to identify additional modifiers of APOL1 concentration. We also compared APOL1 concentration across self-reported ethnicities for all 43,330 UK Biobank participants for whom APOL1 concentration data was available.
Findings APOL1 G1 and G2 are both associated with increased APOL1 protein concentration, however the effect of G2 is more marked, and it was the only locus that reached genome-wide significance in terms of association with APOL1 concentration (p = 3×10−155). In a G2 background, the presence of N264K is associated with a reduction in APOL1 concentration (p = 6 × 10⁻⁵). People with self-reported Black or Black British ethnicity have higher APOL1 concentrations all other self-reported ethnicities in the UK Biobank.
Interpretation These findings demonstrate the influence of APOL1 variants and APOL1 protein concentration and identify additional phenotypic differences between the G1 and G2, highlighting the value in considering them as distinct in molecular and association studies. This work also provides further detail on the relationship between the G2 and N264K variants, which has significant implications for diagnosis and therapy in kidney disease.
Introduction
People of recent African origin are disproportionately affected by chronic kidney disease (CKD)(1). This excess risk has been, in part, attributed to two independent variants of the apolipoprotein L1 (APOL1) gene known as G1 and G2(2), which are common in sub-Saharan Africa and its diaspora, but rare or absent in other populations. G1 (amino acid substitutions S342G and I384M) and G2 (deletion of N388 and Y389) are found in the same domain at the C-terminus of APOL1, and are in complete linkage disequilibrium with each other such that haplotypes with both G1 and G2 alleles are either very rare or absent, as a result, six combined genotypes with respect to APOL1 G1 and G2 have been observed (Table 1).
Genotypes with G1 and G2 on the same haplotype are theoretically possible but have not been observed.
Heterozygosity for G1 or G2 has been shown to be associated with protection from human African trypanosomiasis (sleeping sickness)(3). The two Trypanosoma brucei subspecies that infect humans and cause human African trypanoosomiasis, T.b. gambiense and T.b. rhodesiense, have developed specific mechanisms for avoiding lysis by APOL1(4). In T.b. gambiense infection, G1 and G2 are associated with decreased and increased risk of severe disease, respectively, while carriage of the G2 variant prevents infection by Trypanosoma brucei rhodesiense(3). Despite the association of different genotypes with distinct phenotypes in human African trypanosomiasis, studies of the association between kidney diseases and APOL1 G1 and G2 have often grouped the two variants together as recessively ‘high-risk’ in any combination. Carriage of two such alleles (i.e. G1 homozygotes, G2 homozygotes, and G1/G2 compound heterozygotes) is associated with a spectrum of kidney and related conditions including focal segmental glomerulosclerosis, hypertension-associated kidney failure, and HIV-associated nephropathy(2,5–7).
Using data from the UK Biobank, we previously highlighted differences in association between the two-variant APOL1 genotypes with kidney phenotypes, and demonstrated that one combined APOL1 genotype, G1/G2 (carried by millions of people worldwide), is deleteriously associated with 26 different conditions spanning human health(8). Our analysis exposed complexities in the relationship between APOL1 risk alleles and disease that are not evident when two-variant APOL1 genotypes (G1/G1, G1/G2, and G2/G2) are grouped together as a homogeneous risk category.
APOL1 also contains additional variants that modify its impact on the kidney and in response to trypanosome infections. One such variant, N264K, was initially identified in a G2 homozygous individual infected with an atypical T.b. gambiense strain that lacked the characteristic TgsGP virulence gene. Parallel in vitro experiments with N264K demonstrated a reduction in the lytic activity of APOL1 containing this mutation against trypanosomes in vitro(9). This reduced trypanolytic activity was mirrored by a reduction in cytotoxicity in HEK293 cells expression G1 and G2 variants alongside the N264K mutation(10). Subsequently, it was shown that N264K, when co-inherited with G2, also reduces the renal toxicity associated with the G1/G2 and G2/G2 genotypes(11,12).
These APOL1 variants are incompletely penetrant and little is still known about how they drive disease. A minor fraction of APOL1 is expressed by the kidney and other tissues but the majority is produced by the liver and circulates bound in protein complexes as a component of plasma HDL. The contribution of circulating APOL1 to disease processes remains a point of investigation. Serum APOL1 levels have been correlated with some pathologies such as sepsis and COVID-19 severity(13), whereas other studies found no correlation with kidney disease risk, but genotype and ethnic variation in APOL1 levels(14). Further investigation in this area is warranted to discover the genetic drivers that influence APOL1 protein concentration.
In October 2023, the UK Biobank released plasma protein quantification data generated on the Olink platform for 3072 proteins(15,16), including APOL1. A genome-wide association study screening for associations with protein concentration in the UK Biobank identified APOL1 G2 (alongside SNPs rs138477541 or rs1053865678 on chromosomes 3 and 5 respectively) as having an association with APOL1 concentration(16). Here, we examine the impact of APOL1 G1 and G2 variants on APOL1 protein concentration in detail and determine whether APOL1 protein concentration in a G1 or G2 background is modified by N264K.
Methods
Study design and participants
The UK Biobank is a prospective cohort study of 502,460 adults aged 40 to 69 years at enrolment between 2006 and 2010 from 22 assessment centres across the United Kingdom(17). At the baseline study visit, participants underwent nurse-led interviews and completed detailed questionnaires about medical history, medication use, sociodemographic factors, and lifestyle in addition to a rage of physical assessments and provided blood and urine. The UK Biobank study was approved by the North-West Multi Centre Research Ethics Committee, and all participants provided written informed consent.
Genotyping
APOL1 genotypes were obtained from the UK Biobank, which used a custom Affymetrix array for the G1 (rs73885319) and N264K (rs73885316) alleles. G2 (rs71785313) genotypes were imputed by the UK Biobank as previously described(17). By analysing genetic principal components, we previously identified a cohort of UK Biobank participants who had recent sub-Saharan African ancestry(8). Briefly, using principal components (PC) calculated by the UK Biobank genetic data of all UK Biobank participants, the large majority of participants with PC1 > 100 and PC2 > 0 described their ethnic background as ‘Black or Black British’ or ‘Mixed’. We then used UK Biobank whole genome Affymetrix genotype data to calculate principal components for this cohort after removing linked SNPs. Inspection of a plot of the new PC1 and PC2 identified a core set of participants with PC1 > -0.0135, which captured 93% of the individuals in the UK Biobank with a two-risk-variant APOL1 genotype, enabling comparison of these individuals with UK Biobank participants who were of the most similar ancestry. The data was further filtered to include only participants with complete, unambiguous APOL1 G1 and G2 genotype data. The final cohort for analysis described here included 7,969 UK Biobank participants.
UK Biobank Olink protein quantification data
Olink protein quantification was performed on 54,219 UK Biobank participants(16). APOL1 protein quantification data is available for 43,330 of these. Olink data is expressed in the Normalized Protein eXpression (NPX) scale, enabling relative quantification of the same protein across multiple samples. As NPX values are calculated on a log2 scale, an NPX difference of 1 represents a doubling of protein concentration.
UK Biobank self-reported ethnicity data
Self-reported ethnicity data was obtained from UK Biobank data field 21000. The descriptors of ethnicity used here (Asian or Asian British, Black or Black British, Chinese, Mixed, and White) represent the top level descriptors of ethnicity used in data field 21000.
Statistical analysis
APOL1 protein concentration was tested for association with APOL1 genotypes with, age, sex, and genetic principal components 1-4 were selected as covariates. Linear regression as implemented in R was used to compare the effects of APOL1 genotypes and individual risk alleles. All statistical tests were 2-sided, and p < 0.05 was considered statistically significant.
Genome-wide association
A total of 784,256 loci from the UK Biobank Affymetrix genotype data were used in a genome-wide association study for loci associated with APOL1 concentration. We scanned for associations within our previously-defined cohort of UK Biobank participants with recent sub-Saharan African ancestry. Association testing was done using Plink2(18) with a general linear model(19), using age, sex, and the first four principal components of the relevant sample set as covariates.
Results
Olink APOL1 protein concentration data and complete APOL1 genotypes were available for 1,050 UK Biobank participants within our previously defined cohort of participants with recent sub-Saharan African ancestry(8). Olink data is expressed in the Normalized Protein eXpression (NPX) scale, enabling relative quantification of the same protein across multiple samples. As NPX values are calculated on a log2 scale, an NPX difference of 1 represents a doubling of protein concentration. We examined whether differences in APOL1 protein concentration were associated with the number of G1 or G2 copies present.
APOL1 G1 is associated with moderate increases in APOL1 protein concentration
In the first instance, we compared the number of APOL1 G1 alleles with APOL1 protein concentration. There was no significant difference in protein levels between participants who had no G1 alleles (G0/G0, G0/G2, G2/G2) and individuals carrying one G1 allele (G0/G1 or G1/G2). Similarly, there was no significant differences in APOL1 protein levels between participants who had no G1 alleles and individuals carrying two G1 alleles (G1/G1). Likewise, there was no significant difference in APOL1 protein levels between participants who had one G1 allele and individuals carrying two G1 alleles (Table 2, Figure 1). However, when participants who carried no G1 alleles (n=637, mean APOL1 concentration = 1.06 NPX) were compared to those who were either homozygous or heterozygous for G1 (G1/G1, G0/G1 or G1/G2) (n=413, mean APOL1 concentration 1.24 NPX) a significant difference was detected (t-test, p = 0.0003).
Associations were estimated using linear regression, with age, sex, and the first four principal components of the samples as covariates. NPX values are calculated on a log2 scale.

APOL1 G2 strongly influences APOL1 protein concentration
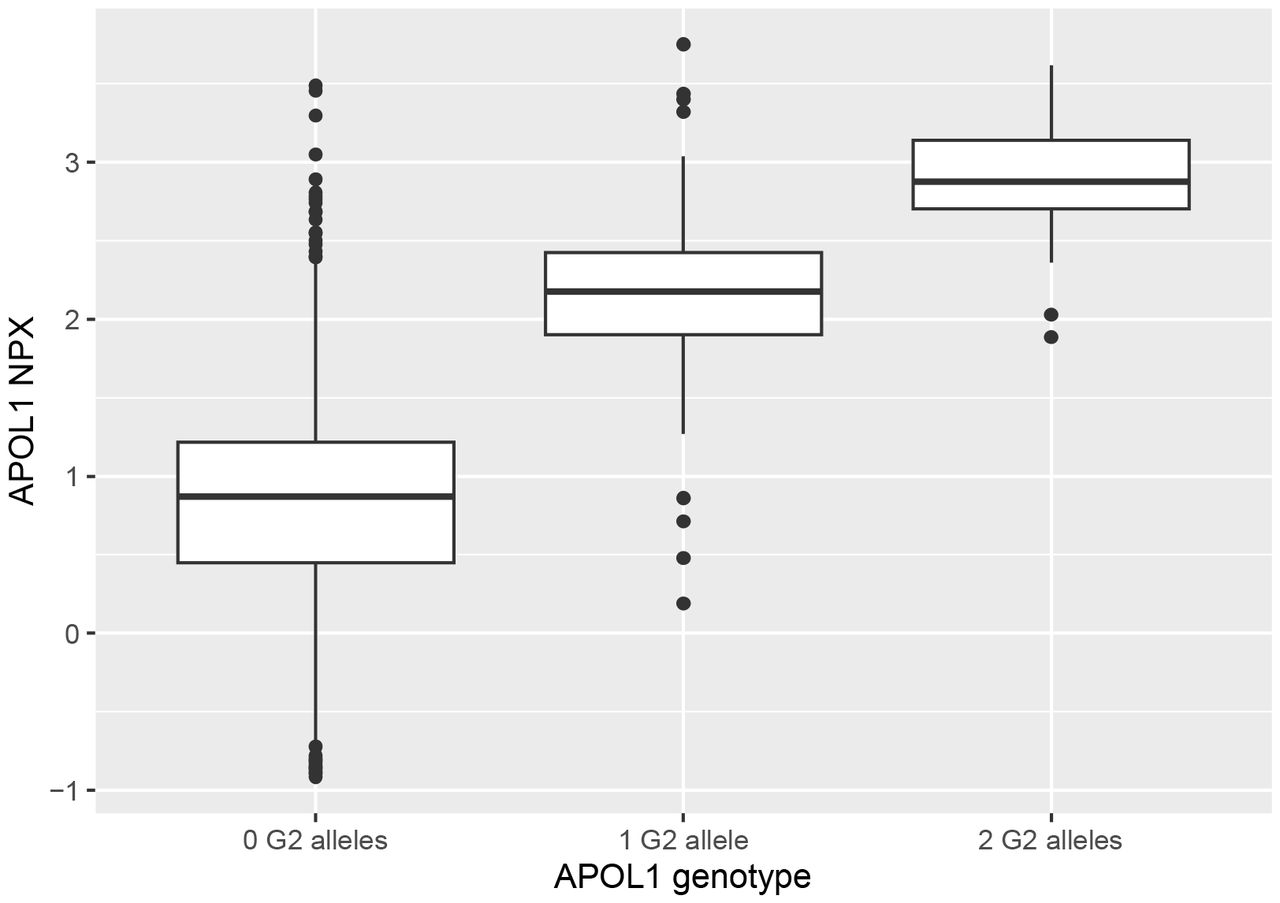
When participants were similarly grouped according to the number of G2 alleles carried, all comparisons between groupings yielded significant p-values (Table 3, Figure 2). The difference in mean NPX between participants who had 2 G2 alleles (2.88 NPX) and 0 G2 alleles (0.85 NPX) indicates a 4.1-fold difference in mean APOL1 concentration between the two groups.
Associations were estimated using linear regression, with age, sex, and the first four principal components of the samples as covariates. NPX values are calculated on a log2 scale.

Evidence that N264K is detected in G0 and G2 haplotypes, but not G1 haplotypes
Our previously defined cohort(8) of UK Biobank participants with sub-Saharan African ancestry (n = 7,969) includes 7,764 individuals with an identifiable genotype at the N264 locus. It had previously been reported that the N264K variant occurs on G0 and G2 haplotypes as a result of two independent mutational events, and that N264K is mutually exclusive with the APOL1 G1 allele(12). UK Biobank data supports this observation: at least one haplotype containing the N264K variant was observed for 88/2,984 (2.9%) G0/G0 participants and 9/155 (5.8%) G2/G2 participants, but none of the 681 G1/G1 participants (Table 4).
In a G2 background, N264K reduces APOL1 concentration Of the 1,032 cohort members with APOL1 protein data and complete G1, G2, and N264 genotype data, 211 carried at least one copy of G2, among whom 32 also carried the N264K variant. The presence of N264K on a G0 background (G0/G0) (t-test, p = 0.88) or in a G1 background (genotypes G0/G1, G1/G2, or G1/G1) (t-test, p = 0.85) had no effect on APOL1 protein concentration. However on a G2 background (genotypes G0/G2, G1/G2, or G2/G2), the presence of N264K was associated with significantly lower APOL1 protein level (t-test, p = 6×10⁻⁵) (Table 5). The mean APOL1 protein concentration was 28% lower among participants who carried N264K and G2 than those who carried G2 alone.
NPX values are calculated on a log2 scale.
APOL1 G1 and G2 combined genotypes differ in terms of APOL1 protein concentration
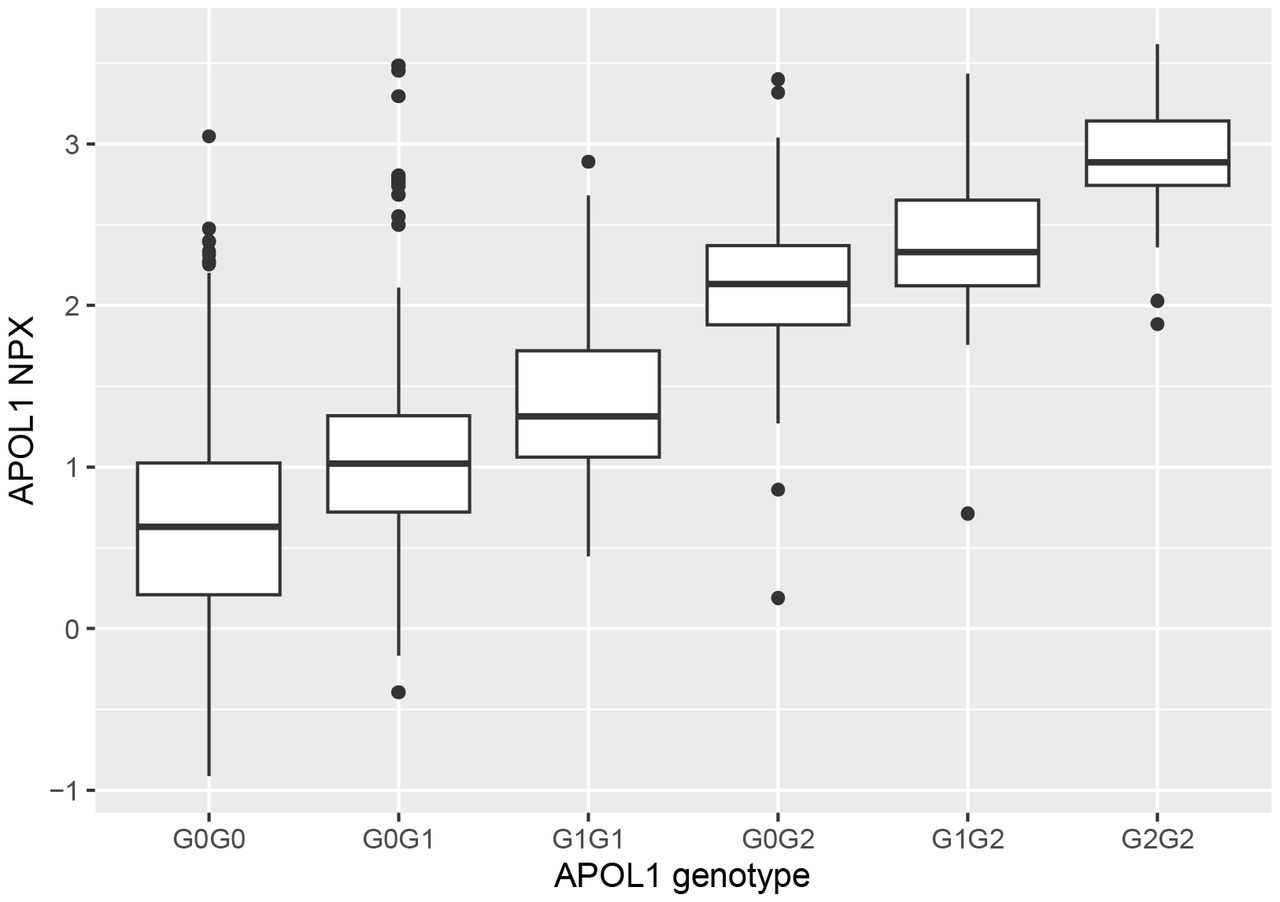
Previously, phenome-wide analysis highlighted differences between the six observed combined APOL1 G1 and G2 genotypes(8). These differences extend to protein concentration (Table 6, Figure 3). All comparisons between genotypes yielded significant p-values (< 8x10⁻⁵), except for the comparison between G0/G2 and G1/G2 (Table 6). The contrast in mean APOL1 concentration between participants who were G2/G2 (2.88 NPX) and G0/G0 (0.62 NPX) (the two most divergent genotypes) was 4.8-fold.
Associations were estimated using linear regression, with age, sex, and the first four principal components of the samples as covariates. NPX values are calculated on a log2 scale.

Notably, the sub-Saharan African cohort described in this study had a mean APOL1 normalised protein expression reading of 1.14 PX: significantly higher (p < 2×10⁻¹⁶) than the remainder of UK Biobank participants for whom APOL1 concentration data is available (0.06 NPX), indicating that APOL1 protein concentration is higher on average among groups with recent sub-Saharan African ancestry. However, as described above, a proportion of this difference can be attributed to the overrepresentation of G1 and G2 alleles in this cohort, which are rare or absent in non-sub-Saharan African populations. However, among sub-Saharan African cohort members with the G0/G0 genotype, APOL1 concentration (0.62 NPX) was also 47% higher (p < 2×10⁻¹⁶) than the remainder of UK Biobank participants with that genotype (mean = 0.07 NPX).
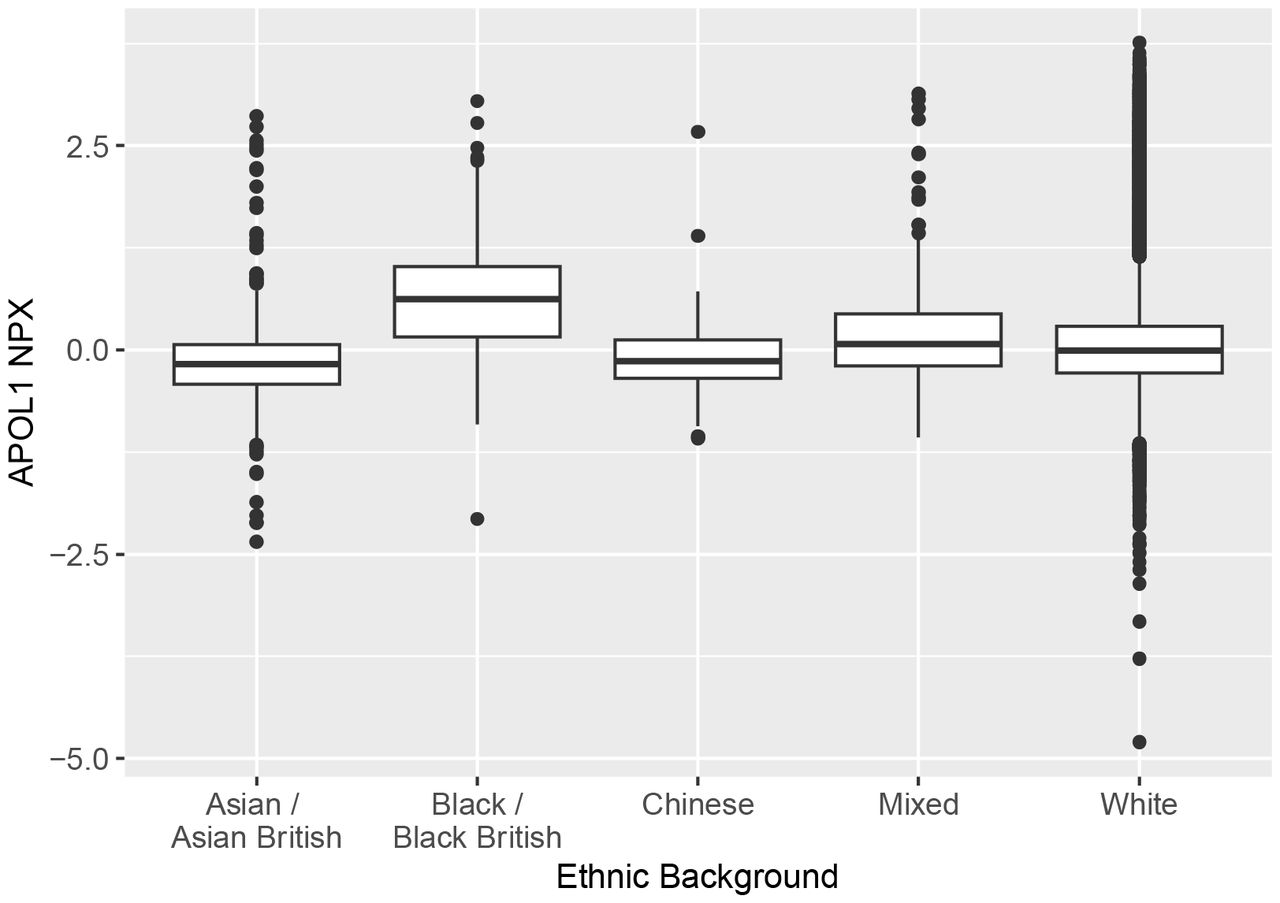
To examine differences across ethnicity in further detail, we compared APOL1 protein concentration across self-reported ethnicities as defined by the UK Biobank: White; Mixed; Asian or Asian British (which includes Indian, Pakistani, and Bangladeshi ethnicities); Black or Black British; Chinese. To eliminate the influence of APOL1 G1 and G2, only participants who had the G0/G0 genotype were considered in this analysis. All comparisons between self-reported ethnicities yielded significant differences (<3×10⁻⁵), with the exception of the comparison between Asian and Chinese ethnicities (Table 7, Figure 4). Consistent with the data described above, UK Biobank participants with self-reported Black or Black British ancestry had higher concentrations of APOL1 than other ethnicities.
The mean of each population was significantly different from the mean of each other population, with the exception of the comparison between self-reported Asian and Chinese participants. The mean APOL1 NPX was highest in participants who identified as Black or Black British.

Genome-wide association study to identify additional loci regulating APOL1 concentration A previous genome-wide scan for association with APOL1 concentration reported associations in people of African ancestry between APOL1 concentration and APOL1 G2, rs138477541 (chromosome 3) and rs1053865678 (chromosome 5)(16). We repeated this analysis for the 1,050 UK Biobank participants with APOL1 protein concentration data within our previously-defined recent sub-Saharan African ancestry cohort. Age, sex, and the first four principal components were taken as covariates. Our GWAS confirmed the association with APOL1 G2 (p = 3×10−155), however no association with rs138477541 or rs1053865678 was detected. A SNP at a separate location on chromosome 3, rs112693005 (no previous associations reported), almost reached genome-wide significance (p = 6 × 10⁻⁸), however we did not detect genome-wide significance (p < 5 × 10⁻⁸) on any other chromosomes. The genome-wide scan failed to identify genetic factors or covariates that would explain the elevated APOL1 concentration among sub-Saharan Africans.
Discussion
Recent laboratory and association studies have transformed our understanding of the human APOL1 gene: widening the scope of potentially detrimental effects in current populations as an evolutionary cost of surviving historic sleeping sickness epidemics (8,13,20–22) as well as identifying an additional modifying variant that mitigates APOL1 impact both on trypanosomiasis and CKD(9–12), and demonstrating significant phenotypic differences between the G1 and G2 variants(8). In studies examining the role of APOL1 in trypanosomiasis, these differences are well-established: G1 is protective against severe disease in T.b. gambiense; G2 prevents T.b. rhodesiense infection, but is associated with increased disease severity in T.b. gambiense (3), and the two variants are considered separately, with distinct phenotypes. Despite this, studies of APOL1’s role in other conditions such as CKD have typically considered G1 and G2 as equivalent, grouping genotypes G1/G1, G1/G2, and G2/G2 together as collectively ‘high-risk’. Recently, we demonstrated that this approach masks a deeper level of complexity, and identified conditions and phenotypes within CKD that were associated with particular two-variant APOL1 genotypes(8). Here we show that these differences extend to APOL1 serum protein concentration, and also provide further evidence that the APOL1 N264K variant modifies the G2 protein concentration phenotype.
Our data indicates that APOL1 G1 and G2 are both associated with increased APOL1 serum protein concentration, however the effect of G2 is far larger and dose-dependent. Previous studies have demonstrated G2-specific phenotypes in human African trypanosomiasis and CKD. In T.b. rhodesiense infection, a parasite serum resistance-associated (SRA) protein binds and blocks APOL1-mediated trypanolysis, permitting human infection. However the two amino acid deletion present in the G2 variant modifies APOL1 to prevent SRA binding, thus restoring APOL1 lytic function and protecting against trypanosome infection(23). The G2/G2 genotype has also been associated with reduced (< 60 mL/min/1·73m2) estimated glomerular filtration rate(8): an indicator of CKD. The mechanisms resulting in APOL1-mediated cell injury in CKD are unclear: multiple pathways have been proposed, and studies have typically examined genotypes G1/G1, G1/G2, and G2/G2 collectively as ‘high-risk’. The molecular pathways underpinning CKD phenotypes might be specific to individual APOL1 genotypes.
Phenome-wide screening of APOL1 G1 and G2 genotypes revealed multiple deleterious associations specifically with the G1/G2 genotype (8), however the analysis did not detect any International Classification of Disease (ICD) codes associated with G2/G2 (either protective or deleterious). Given the substantial increase in APOL1 protein concetration in G2/G2, this is surprising. The lack of associations may be due to reduced statistical power (G2/G2 is the least common of the six observed APOL1 genotypes, and the phenome-wide screen included only 153 G2/G2 participants compared to 320 who were G1/G2) or there might be additional, as yet undetected modifiers that mask the effects of G2 homozygosity. Alternatively, the presence of APOL1 G2 protein at increased concentration might not impact on ICD phenotypes.
The APOL1 N264K variant in a G2 background has previously been associated with reduced trypanolytic function (9). Subsequently, N264K has been shown to be associated with a protective effect against G2-associated kidney disease, interrupting APOL1 G2 pore-forming function and ion channel conduction(11,12). Here, we demonstrate that in the presence of G2, the N264K variant also reduces protein concentration. Although genotypes containing G2 and N264K have higher APOL1 protein concentration than G0/G0, the protein concentration reduction and pore disruption actions of N264K might be sufficient to reduce the severity of the phenotype. N264K may also have additional, as yet unidentified, phenotype-modifying actions. The presence, simultaneously of N264K and G2 in an individual has potential clinical implications: the G2 carriers who do not carry the N264K variant are potentially at highest risk of developing kidney disease, and perhaps require more frequent monitoring of their condition.
The data presented here demonstrates the association between APOL1 variants and protein concentration, however the elevated protein concentration among individuals with the G0/G0 genotype who have sub-Saharan African ancestry (relative to those of non-sub-Saharan African ancestry) indicates that APOL1 protein concentration is influenced by additional factors. The difference might be attributable to many loci of small effect as well as environmental factors that were not incorporated into our model. The identification of additional loci and environmental factors that influence APOL1 protein concentration, and an assessment of their impact on human health would further develop our understanding of the protein and inform diagnostics and maangement for APOL1-related conditions.
Conclusions
This study demonstrates the relationship between APOL1 variants and APOL1 protein concentration. It identifies further phenotypic differences between the G1 and G2 variants, highlighting the value in considering them as distinct in molecular and association studies. Furthermore, it provides further detail on the relationship between the G2 and N264K variants, which has significant implications for diagnosis and therapy in kidney disease.
Data Availability
This research has been conducted using data from the UK Biobank, a major biomedical database.
Data sharing statement
This research has been conducted using data from the UK Biobank, a major biomedical database: www.ukbiobank.ac.uk.
Acknowledgements
We thank NHS England (Copyright 2023, NHS England. Re-used with the permission of the NHS England. All rights reserved. This work uses data provided by patients and collected by the NHS as part of their care and support.
We thank Public Health Scotland. (This research used data assets made available by National Safe Haven as part of the Data and Connectivity National Core Study, led by Health Data Research UK in partnership with the Office for National Statistics and funded by UK Research and Innovation).
This study was funded by the Wellcome Trust (209511/Z/17/Z) and H3Africa (H3A/18/004).
References


