
ABSTRACT
Genetic variation within intron 3 of the CACNA1C calcium channel gene is associated with schizophrenia and bipolar disorder, but analysis of the causal variants and their effect is complicated by a nearby variable-number tandem repeat (VNTR). Here, we used 155 long-read genome assemblies from 78 diverse individuals to delineate the structure and population variability of the CACNA1C intron 3 VNTR. We categorized VNTR sequences into 7 Types of structural alleles using sequence differences among repeat units. Only 12 repeat units at the 5′ end of the VNTR were shared across most Types, but several Types were related through a series of large and small duplications. The most diverged Types were rare and present only in individuals with African ancestry, but the multiallelic structural polymorphism Variable Region 2 was present across populations at different frequencies, consistent with expansion of the VNTR preceding the emergence of early hominins. VR2 was in complete linkage disequilibrium with fine-mapped schizophrenia variants (SNPs) from genome-wide association studies (GWAS). This risk haplotype was associated with decreased CACNA1C gene expression in brain tissues profiled by the GTEx project. Our work suggests that sequence variation within a human-specific VNTR affects gene expression, and provides a detailed characterization of new alleles at a flagship neuropsychiatric locus.
INTRODUCTION
Genome-wide association studies (GWAS) hold great promise to decipher disease biology, but their utility has been checked by the challenge of identifying causal variants, target genes, and relevant cellular contexts (Maurano et al. 2012; Forgetta et al. 2022; Sobreira et al. 2021). A prime example is schizophrenia, a severe and etiologically complex psychiatric disorder with few effective treatments despite a high heritability of 70% and an incidence of 1% (Lichtenstein et al. 2009; Sullivan et al. 2003). Realizing the promise of translating psychiatric genetics into mechanistic insights will require systematic analysis of key association loci.
A top GWAS signal for schizophrenia, bipolar disorder, and major depression (Mullins et al. 2021; Stahl et al. 2019; Pardiñas et al. 2018; Ruderfer et al. 2014; Schizophrenia Working Group of the Psychiatric Genomics Consortium 2014; Cross-Disorder Group of the Psychiatric Genomics Consortium 2013; Liu et al. 2011; Ripke et al. 2011; Psychiatric GWAS Consortium Bipolar Disorder Working Group 2011; Ferreira et al. 2008) lies deep within the large 328-kb third intron of the 645kb CACNA1C gene, well away from other potential target genes (Fig. 1A). CACNA1C encodes the pore-forming subunit of CaV1.2, the predominant L-type voltage-gated calcium channel expressed in human central nervous system neurons (Hodge et al. 2019; Miller et al. 2014; Catterall 2023). CaV1.2 channels on the somatodendritic membrane play a dominant role in triggering a signaling cascade that culminates in the phosphorylation of the nuclear transcription factor CREB (Deisseroth et al. 1996; Wheeler et al. 2012; Ma et al. 2014; Li et al. 2016; Greenberg et al. 1986), which is important for learning and memory across the evolutionary tree (Yin et al. 1995; Impey et al. 1996; Bartsch et al. 1998). A single missense variant in CACNA1C is responsible for the monogenic disorder Timothy Syndrome type 1 (Splawski et al. 2004, 2005; Barrett and Tsien 2008), which along with other CACNA1C-related disorders, has psychiatric symptoms (Levy et al. 2023). The broader calcium channel gene family is robustly implicated in schizophrenia and other psychiatric disorders (Trubetskoy et al. 2022; Curtis et al. 2011). Thus CACNA1C has wellestablished relevance for psychiatric disorders, but the genetic and molecular underpinnings of the GWAS association remain unclear.

(A) CACNA1C gene showing SNPs associated with schizophrenia (Pardiñas et al. 2018), bipolar disorder (Mullins et al. 2021), and CACNA1C expression (GTEx Consortium 2020). (B) Schematic of CACNA1C VNTR analysis strategy. CACNA1C VNTR sequences are identified in long-read genome assemblies from the Human Genome Structural Variation Consortium (HGSVC2) (Ebert et al. 2021), the Human Pangenome Reference Consortium (HPRC) (Liao et al. 2023), and the Telomere-to-Telomere project (Nurk et al. 2022). (C) Sequence logo of the CACNA1C repeat unit. Letter height is proportional to base frequency across all sequences. (D) Repeat unit key for (D-E). Each common repeat unit (frequency > 0.0005) is shown as a different color, collectively representing > 98% of analyzed CACNA1C VNTR sequences. Nucleotide differences from the consensus repeat unit are colored and underlined. Remaining low-frequency repeat units are represented by one of two colors depending on their length (either 30 bp or not). The chimpanzee genome contains a single copy slightly diverged from the human consensus. (E) Seven VNTR Types. Repeat unit frequencies (y-axis) per position (x-axis) are shown above a consensus sequence. Numbers in parentheses indicate VNTR Type frequency among 155 sequences. Type 6 and Type 7 each represent single CACNA1C VNTR sequences dissimilar to any other Type.
Complicating matters, the CACNA1C association locus overlaps a human-specific variable number tandem repeat (VNTR; repeat unit length=30 bp, mode length=5.61 kb) (Song et al. 2018). Tandem repeats have been implicated in a wide variety of human traits and diseases (Mukamel et al. 2021), including Amyotrophic Lateral Sclerosis (ALS) (Course et al. 2020), Alzheimer’s disease (De Roeck et al. 2018), progressive myoclonic epilepsy (Lalioti et al. 1997), and others. Tandem repeats show widespread association with expression of nearby genes (Lu et al. 2021; Bakhtiari et al. 2021; Garg et al. 2022; Lu et al. 2023; Mukamel et al. 2023), and can modulate transcription factor binding (Horton et al. 2023). Thus several lines of evidence suggest the involvement of VNTRs in the regulation of gene expression and disease. However, typical genomic analyses exclude repetitive regions. VNTRs, defined by repeat units longer than 6 bp, are especially difficult to analyze. Indeed, the CACNA1C VNTR is collapsed to 300 bp in the human reference genome (Song et al. 2018). Specialized tools can estimate VNTR length from short-read data (Lu et al. 2021; Bakhtiari et al. 2021, 2018), but accurate inference of repeat structure and variation is difficult when VNTRs exceed sequencing read lengths.
The recent development of high-quality long-read assemblies offers the potential for detailed assessment of polymorphic VNTR sequences (Bakhtiari et al. 2018; Chaisson et al. 2019; Ebert et al. 2021; Nurk et al. 2022; Liao et al. 2023). Here we analyzed the CACNA1C VNTR in 155 longread haplotype assemblies to characterize its structure, variation, and relationship to the schizophrenia disease association. Our analysis uncovers unexpected patterns of structural diversity within the repeat and delineates a series of common alleles at two variable regions within the predominant VNTR sequence type. We show that one of these variable regions is tightly correlated with both the schizophrenia GWAS association and gene expression in brain. Our work thus serves as an example for investigation of other difficult association loci.
RESULTS
Analysis of the CACNA1C VNTR in long-read assemblies
To comprehensively map the repeat structure and variation of the CACNA1C VNTR, we analyzed phased, long-read genome assemblies from the Human Genome Structural Variation Consortium Phase 2 (HGSVC2) (Ebert et al. 2021), the Human Pangenome Reference Consortium (HPRC) (Liao et al. 2023), and the Telomere-to-Telomere project (Nurk et al. 2022). This collection contained 155 haplotypes assembled from 78 distinct individuals, including 3 trios and a haploid genome assembly from the homozygous hydatidiform mole CHM13 (Fig. 1B, Table S1). For each assembly, we identified the contig containing the previously identified consensus repeat unit of this VNTR (Song et al. 2018) and extracted the full repeat sequence for analysis (Data S1, Table S2). We confirmed that each identified VNTR sequence was present on a single contig and flanked by unique sequence.
These sequences recapitulated the known repeat unit sequence motif, with strict conservation at 22 out of 30 positions (Fig. 1C). We identified 34,172 repeat units in total and 158 distinct repeat units, most of which were 30 bp in length (Fig. 1D, Table S3). A subset of 35 distinct repeat units with frequency > 5×10⁻⁴ comprised > 98% of CACNA1C VNTR sequences. The most common repeat unit, defined as the consensus, was present at 32% of positions across all CACNA1C VNTR sequences and differed from other units by an average of 2.3 substitutions. Of the 8 nucleotide positions that were most frequently variable relative to the consensus, 7 showed a consistent change to one nucleotide in all respective repeat units. Infrequent repeat units fell into two categories: repeat units of size other than 30 bp (n=11) and infrequent 30-bp units (frequency ≤ 5×10⁻⁴, n=111). Thus while the CACNA1C VNTR has a strong consensus sequence, there is significant variability which permits structural analysis within the repeat.
Structural characterization of the CACNA1C VNTR
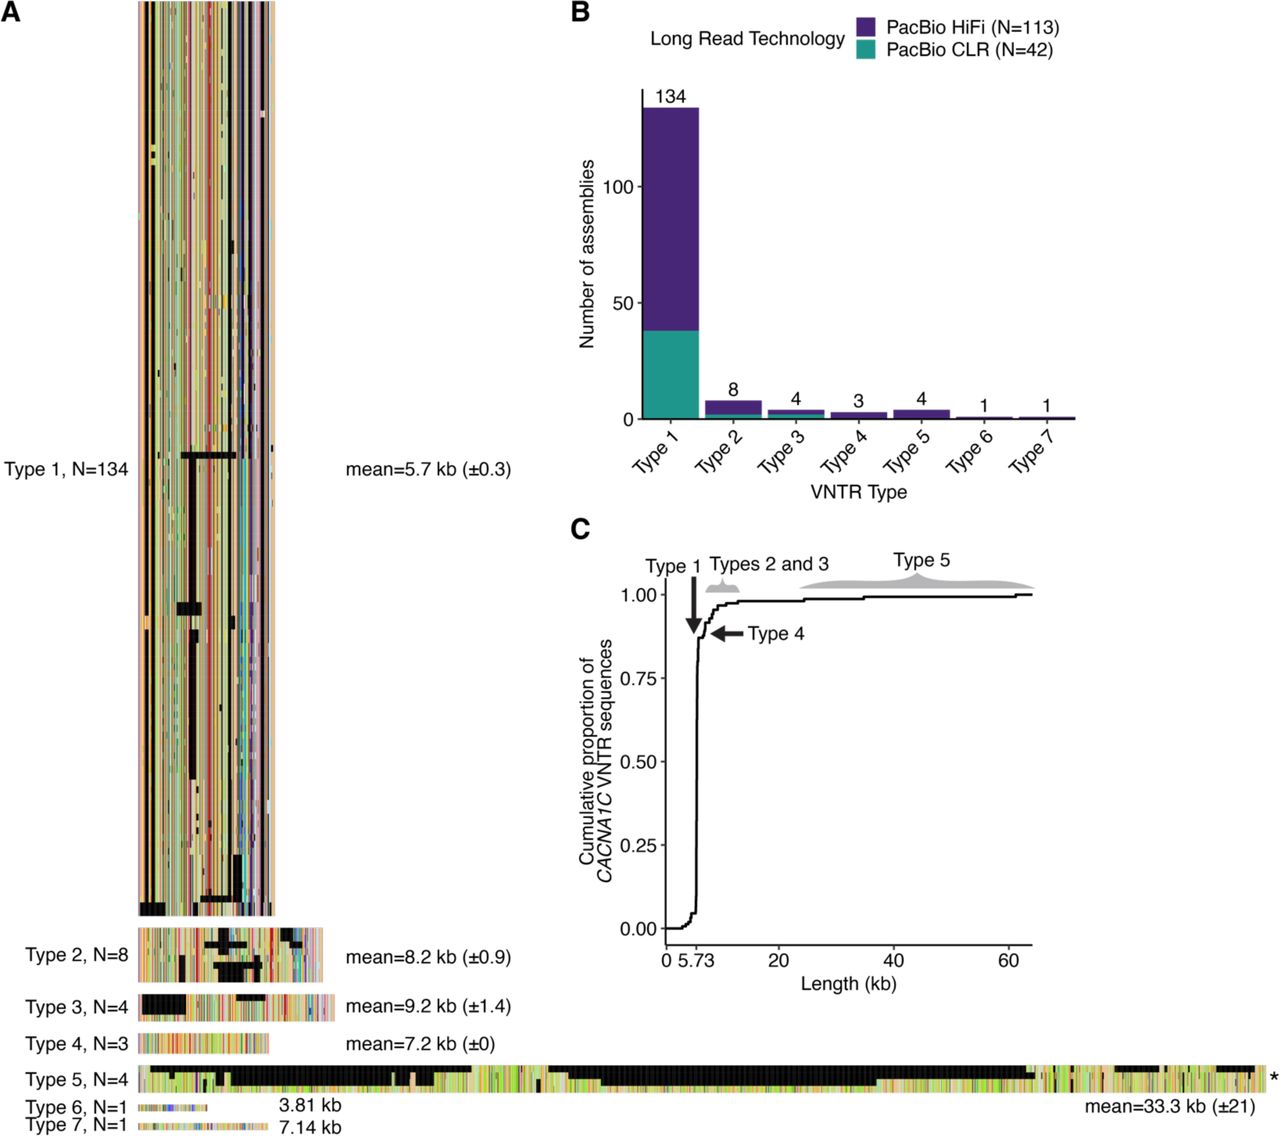
We iteratively performed multiple sequence alignments starting from all 155 repeat sequences, and converged on 7 distinct Types of the CACNA1C VNTR (Fig. 1E, Fig. S1A). Alignments within each Type showed a high proportion of a single repeat unit at each non-gap position (Fig. 1E). Each VNTR Type was supported by at least one PacBio HiFi assembly (Fig. S1B). For each VNTR Type, we generated a consensus sequence from the most frequent repeat unit at each position that best represented its distinct length and repeat unit order (Fig. 1E, Data S2).
Type 1, representing about 90% of sequences, defined the most common length (mode=5.73 kb) (Fig. S1C). Type 2 and Type 3 sequences were 30-40% longer than Type 1 sequences with less consistency in length. Type 4 sequences (frequency=0.02) had identical lengths (7.2 kb) and very few sequence differences among them. Type 5 sequences (frequency=0.03) were the longest (12.87-61.198 kb) and most variable (s.d.=21 kb). Types 6 and 7 were defined by single sequences that were distinct from other Types in length (Fig. 1E) and repeat unit order (Fig. S1A).
A minority of distinct repeat units were shared across all VNTR Types (8.2%, n=13/158), but these repeat units comprised at least 85% of units in each Type. The most common repeat unit had a similar amount within each Type (Fig. 2A-B), while the next 24 most abundant repeat units had varying representations of Types (Fig. 2B). Type-specific repeat units were found in low frequencies (Fig. 2A-C). Thus a set of common and infrequent repeat units stereotypically compose the CACNA1C VNTR, with varying proportions across Types. The relative quantity of each repeat unit was nearly identical across Types 1, 2, and 3, while Types 4-7 were characterized by increased presence of rare repeat units. (Fig. 2D).

(A) Count of each CACNA1C VNTR repeat unit across all 155 sequences. (B) Representation of Types for each distinct repeat unit. Repeat unit frequencies are calculated within each Type, summed, then shown as proportions of this sum to normalize for Type frequency. (C) Number of 155 sequences containing at least one copy of each CACNA1C VNTR repeat unit. (D) Repeat unit frequencies within each Type. Colors are as in Fig. 1D. Stacked bars are ordered from bottom to top by decreasing repeat unit frequency in Type 1. (E-F) Count of identical repeat units across the first (E) and last (F) 18 repeat units of each Type consensus sequence. Colors are as in Fig. 1D.
These Types represented dissimilar structural CACNA1C VNTR alleles. Only the first repeat unit was shared among all Types, though the first 12 repeat units were shared among most Types (Fig. 2E). The 3′ end was also variable and no position was shared across all Types (Fig. 2F). Overall, these sequences attest to an exceptional diversity in repeat structure.
Kilobase-scale duplications within the CACNA1C VNTR
Given the high degree of similarity between repeat unit frequencies of Types 1, 2, and 3, we reasoned that they may be structurally related. We computed dosage of a sliding window (width=6 repeat units) across these three consensus sequences to systematically assess their shared and unique sequences. This identified two separate kilobase-sized tandem duplications (Duplication 1 and Duplication 2) that distinguished Type 2 and Type 3 from Type 1 (Fig. 3A). Duplication 1 breakpoints varied across Type 2 sequences, while Duplication 2 breakpoints in Type 3 sequences were identical (Fig. S1A). We identified a single Type 3 sequence (NA21309_paternal) that had a third copy of Duplication 2 with the same breakpoints (Fig. 3B). This suggests that Type 2 and Type 3 sequences are derived from Type 1.

Analysis of Types 2 and 3 (A,B), and Type 5 (C,D) CACNA1C VNTR sequences. (A,C) Y-axis measures copy number of a sliding window within an exemplar sequence (x-axis). Sliding window width is 6 (A) or 8 repeat units (C). Type 1 consensus was used as the exemplar in (A). For (C), an exemplar was derived from HG00735_paternal by removing sequence not found in other Type 5 sequences. Large tandem duplications are indicated by vertical dashed lines (paired by color) and yellow triangles. Arrows in (D) indicate tiling paths. Repeat unit colors are as in Fig. 1D. Non-gap mismatches to the exemplar sequence are shown with red ticks.
Two smaller tandem duplications were identified in Types 1, 2, and 3 using this approach. A 420-bp duplication (Duplication 4) was not exactly in tandem; it was separated by one repeat unit. A 300-bp duplication (Duplication 5) overlapped part of VR1. Their partial overlap with Duplication 1 and Duplication 2 in Type 2 and Type 3 suggested that the smaller tandem duplications preceded larger ones in time. This pattern reveals that one mechanism of expansion of this VNTR is successive tandem duplication of incrementally larger VNTR segments.
The alignment of Type 5 sequences showed significant heterogeneity (Fig. S1A). Scanning for duplications within Type 5 revealed multiple kilobase-sized tandem duplicated segments (Fig. 3C). To facilitate analysis of Type 5, we established a Type 5 exemplar sequence from HG00735_paternal, omitting several small insertions not found in other Type 5 sequences (Fig. 3D, Fig. S1A). HG00735_paternal was selected because it had a dosage of the sliding window equal to 1 across most of the sequence. The other Type 5 sequences also showed structural variety: HG02717_paternal contained large deletions, HG03579_maternal had a kilobase-sized tandem Duplication 1, and HG02818_maternal contained a complex tiling path starting with Duplication 2 and proceeding with multiple smaller interspersed duplications, followed by two more kilobase-scale duplications, suggesting genesis of this sequence through a complex mechanism of expansion (Fig. 3D). This degree of structural variation might indicate that Type 5 is particularly prone to rearrangement.
Type 5 was also distinguished from Types 1-3 by the high density of repeat unit mismatches throughout the sequence relative to the exemplar sequence. Relative to HG00735_paternal, the other three Type 5 sequences had repeat unit mismatches that occur across the entire sequence. In contrast, Types 1-3 had repeat unit mismatches concentrated in a 690-bp segment, leading us to reason that this segment had a different repeat unit composition in Types 1, 2, and 3.
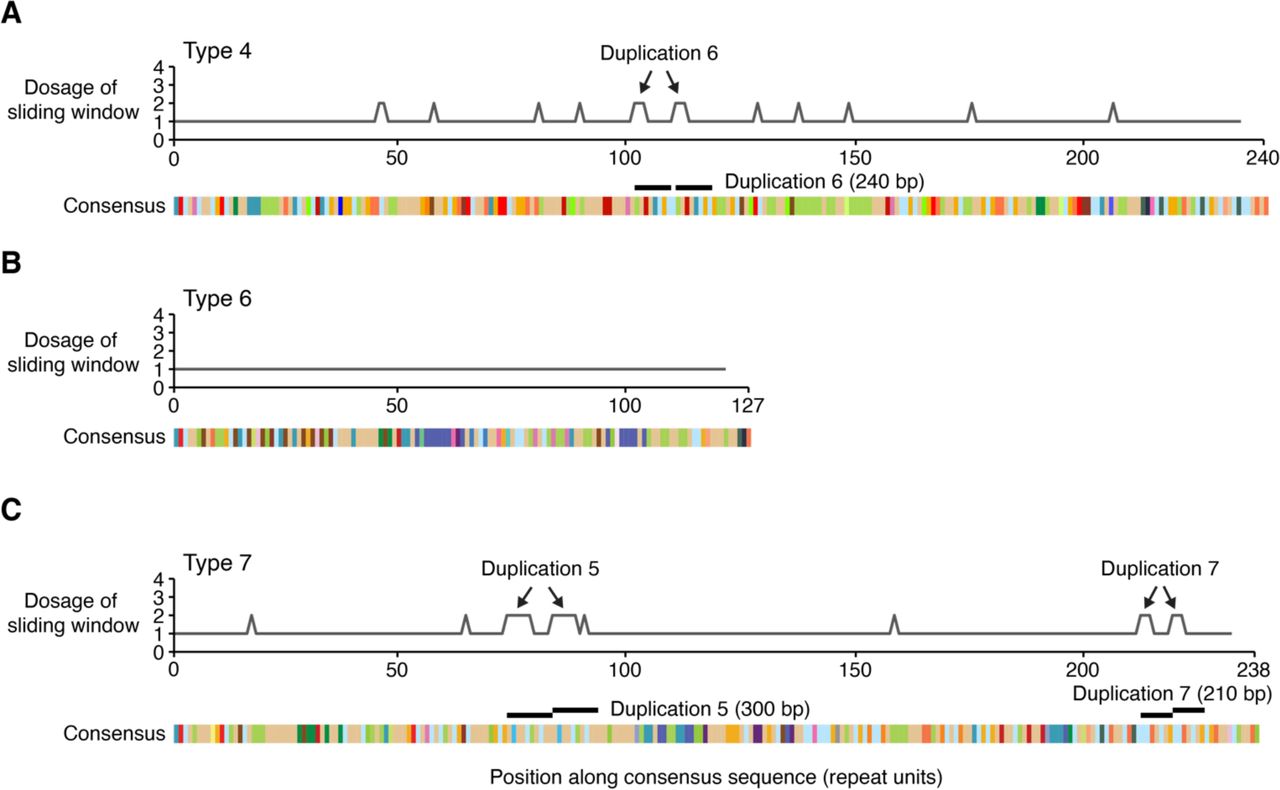
We also scanned for duplications within the Type 4, 6, and 7 consensus sequences, and did not find kilobase-scale duplications, but did observe a handful of smaller tandem duplications (Fig. S2) as noted in Types 1, 2, 3, and 5. Thus the CACNA1C VNTR is characterized by a predominant structure (Types 1-3) that accounts for 95% of sequences, but the remaining 5% of sequences harbor a significant amount of structural diversity.
Common CACNA1C repeat polymorphism
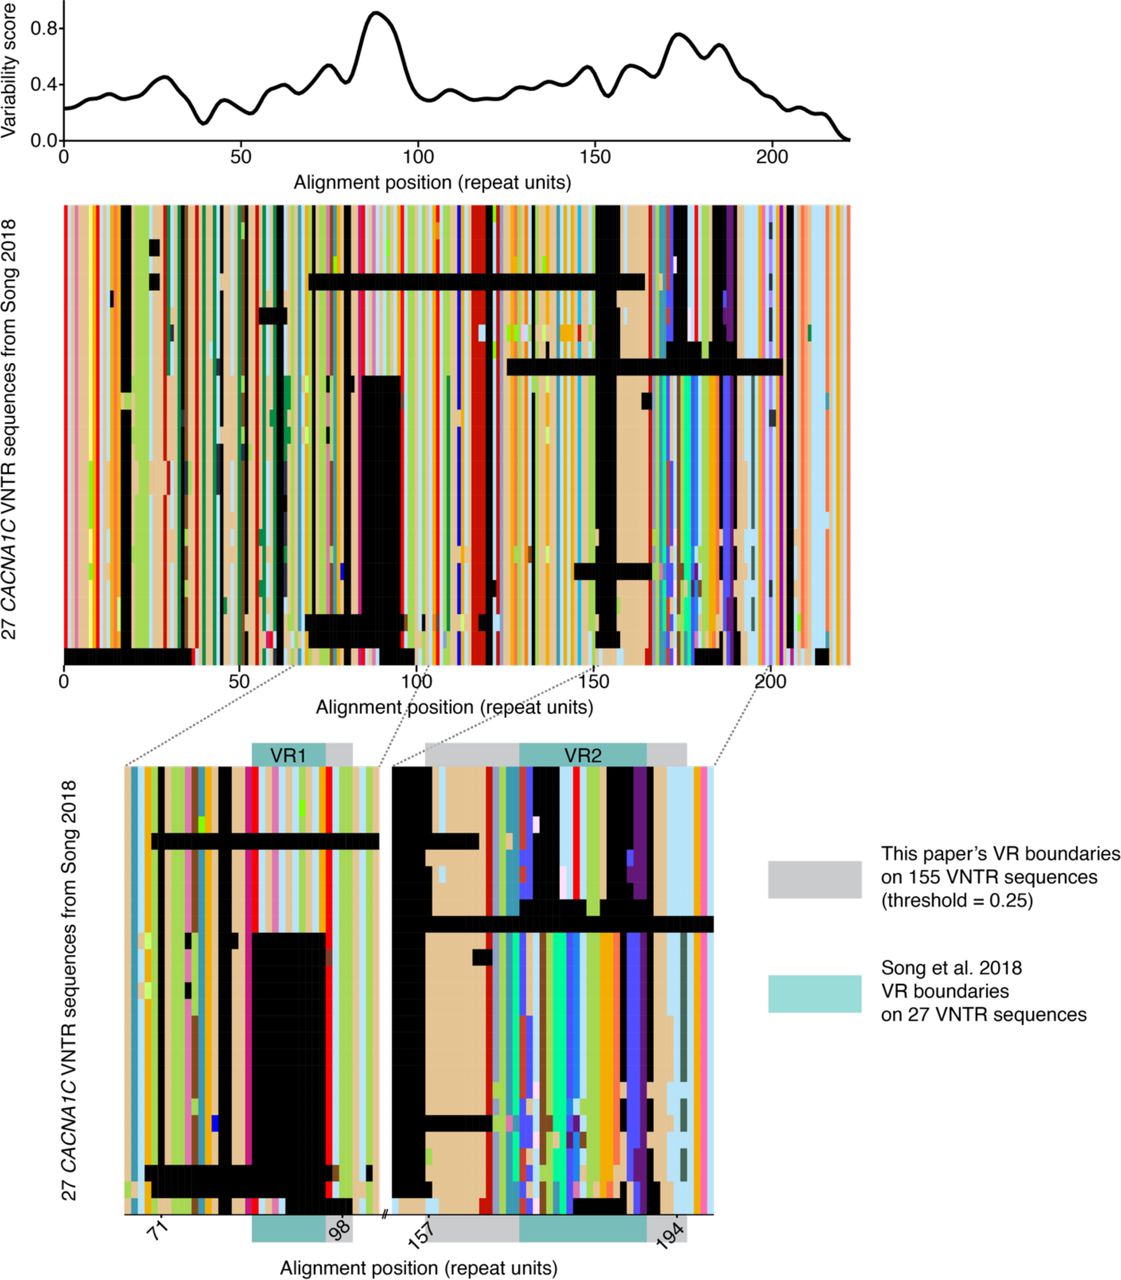
We investigated the extent to which the Type 1 VNTR sequences that comprise 88% of our dataset varied across individuals. We computed a positional variability score along their multiple sequence alignment. Two previously identified regions (Song et al. 2018) stood out because of their high variability: Variable Region 1 (VR1) and Variable Region 2 (VR2) (Fig. 4A). Variation in both VR1 and VR2 fell into several groups of related sequences (Fig. 4B, Fig. S3), thus we characterized multiple discrete alleles at each VR.

(A) Repeat unit variability is shown as normalized Shannon’s uncertainty H(x). Variable regions are defined as H(x) > 0.25 and length > 7 aligned repeat units. (B) Multiple sequence alignment of Type 1 sequences. Variable region boundaries are labeled with vertical gray boxes. (C-F) Variable Region 1 and 2 (VR1 and VR2) alleles, their lengths, and their frequencies in 134 Type 1 sequences. “Unclassified” includes alleles that do not cluster near the consensus (Fig. S4A and Fig. S5A) and whose full VNTR sequences have a large aligned edit distance to exemplar CACNA1C VNTR sequences (Fig. S4B and Fig. S5B). (B,C,E) Repeat unit colors are as in Fig. 1D.
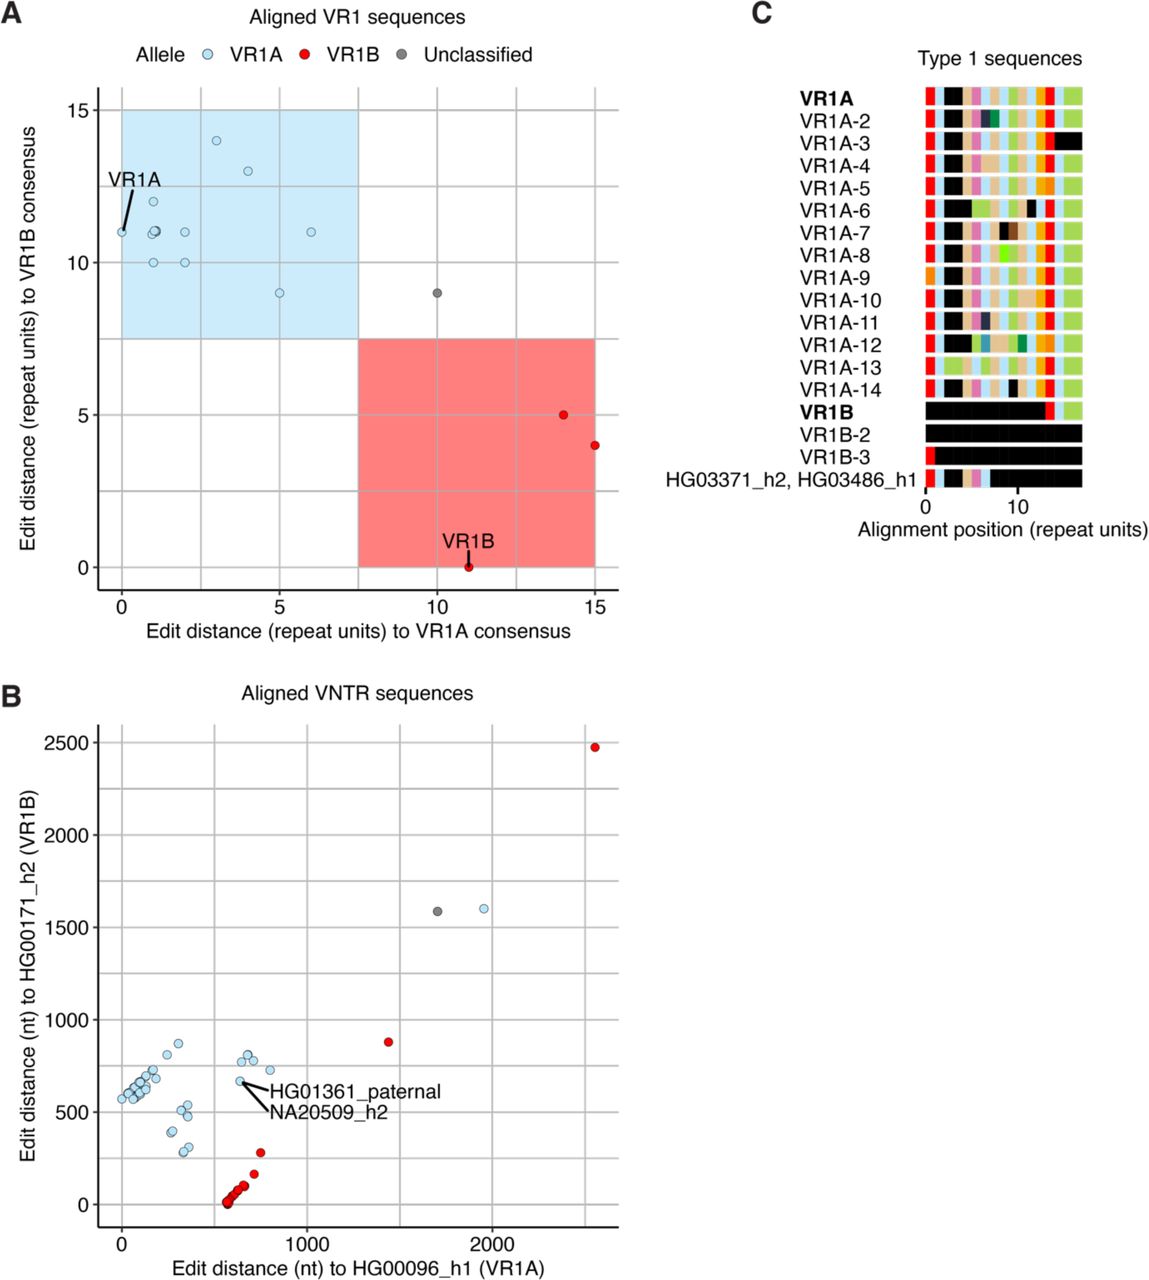
We tabulated 18 distinct VR1 sequences spanning 17 aligned repeat units. We grouped them into two alleles and identified consensus sequences for VR1A and VR1B (Fig. S4, Table S4). VR1A and VR1B differed by 11 repeat units and 330 positions at the nucleotide level. VR1B was a truncation of VR1A (Fig. 4C), suggesting that VR1B resulted from one or multiple ancestral deletion events. VR1A had a frequency of 64%, higher than VR1B (Fig. 4D). Most VR1 sequences matched the consensus sequence and any VR1 sequence that differed from it had an average of 2 repeat units changed. One VR1 sequence found in two individuals was left unclassified due to the high number of mismatches to both VR1A and VR1B (Fig. S4C).
For VR2, we tabulated 71 distinct VR2 sequences spanning 45 aligned repeat units. We grouped VR2 sequences into four alleles: VR2A, VR2B, VR2C, VR2D (Fig. 4E, Fig. S5, Table S5). The large number of repeat unit differences between VR2 alleles corresponded to a large number of differences at the nucleotide level (including alignment gaps) (Fig. S5B, Table S6). Only 25% of sequences matched a VR2 allele sequence exactly, but all sequences had fewer than 25% of repeat units deviating from the consensus, which corresponded to a low number of intra-allele nucleotide differences (Table S7). One VR2 sequence was unclassified due to the high number of mismatches to any VR2 allele. The four VR2 alleles formed two common alleles and two rarer alleles (Fig. 4F) with similar lengths. These alleles were defined by different repeat units and their orders (Fig. 4E), suggesting that VR2 derived from a more complex mutational process than VR1.
Comparison of two full CACNA1C VNTR sequences with different VR1 and VR2 alleles confirmed that VR1 and VR2 alleles corresponded to distinct sequences at the nucleotide level (Fig. S4B and Fig. S5B). Ordering Type 1 sequences by VR2 allele revealed high LD between VR1 and VR2 (R2=0.85, Table S8), with VR1A found in the same sequences as VR2A, VR2C, and VR2D, and VR1B found in the same sequences as VR2B (Fig. S3). The unclassified VR1 and VR2 sequences co-occurred in the same assemblies (Fig. S3). VR1 and VR2 alleles were significantly expanded compared to the previously published description (Song et al. 2018) (Fig. S6). Thus VR2 alone, or VR1 and VR2 together, tag four versions of Type 1 CACNA1C VNTR sequences: two that are common and two that are rarer.
Type 2 and Type 3 VNTRs are related to Type 1 through duplication and may have different VR alleles. We identified only two VR1 sequences and one VR2 sequence within Types 2 and 3 that had been previously identified in Type 1. However, all except one corresponded to known VR1 and VR2 alleles (Fig. S7A-B). Types 2 and 3 harbored two or three complete duplications of VR1, and VR2 was partially duplicated in Type 2 (Fig. 3B, Fig. S7A-B). Interestingly, VR1 shared a right breakpoint with Duplication 2 and the Triplication in Type 3, suggesting this site might be prone to instability. When VR1A was duplicated, one copy typically matched the consensus while the other had more mismatches. VR1B sequences in Type 2 did not show this pattern; instead they were exact copies, perhaps because VR1B is shorter and therefore has less scope to accumulate mutations. VR1 and VR2 alleles had the same correlation in Type 2 and 3 as in Type 1. VR1A was found in the same sequences as VR2C, while VR1B was found in the same sequences as VR2B. Type 2 represented two of the four possible versions of Type 1 sequences, while Type 3 only represented one version (Fig. S7C-D). Thus, Type 2 and Type 3 are the result of large duplications within two versions of Type 1 sequences.
Ancestry and history of the CACNA1C VNTR
The individuals in our dataset included a mixture of African, Asian, and European ancestries (Fig. 5A). Type 1 sequences reflected this overall composition, while Types 2 and 3 showed an increased representation of African and Asian ancestries, respectively, suggesting two separate divergence events that are now segregated geographically (Fig. 5B). Types 4, 5, 6, and 7 were found mostly in African individuals (Fig. 5C). The ancestry of Type 1 can be further broken down by VR2 allele, where African ancestry showed a higher prevalence of VR2B and VR2D, East Asian ancestry showed a higher prevalence of VR2C, and South Asian ancestry showed a higher prevalence of VR2B (Fig. 5D). The two unclassified VR2 sequences were exclusively African, consistent with high genetic diversity rather than sequencing errors. The ubiquity of Type 1 suggests it may be the ancestral allele relative to the other Types.

(A-B) Ancestry frequency in 155 haplotype assemblies (A) and in three related CACNA1C VNTR Types (B). (C-D) Abundance of each Type (excluding Type 1) (C) and VR2 allele (D) by ancestry. Ancestry of each individual is defined by its 1000 Genomes super-population. (E) Fraction of assemblies containing at least 1 copy of each distinct repeat unit by ancestry. The 158 repeat units (x-axis) are ordered by decreasing frequency and numbered by rank. (F) Pileup of reads over the CACNA1C VNTR region (GRCh37/hg19) after whole-genome sequencing of four ancient hominin genomes. (G) Estimated average CACNA1C VNTR length in four ancient hominin genomes. Rows are ordered from most recent to most historic date that the hominin individual lived. (H) Schematic of primate evolutionary tree with time range when CACNA1C VNTR formed.
The fraction of assemblies by ancestry containing each distinct CACNA1C VNTR repeat unit varied by repeat unit frequency. The 29 most abundant repeat units matched the ancestry distribution of the dataset (Fig. 5E-G). The remaining 129 repeat units (frequency<0.0011) were found either in few sequences of predominantly African ancestry (Fig. 5E) or single CACNA1C VNTR sequences (n=25) of various Types (Table S3). Taken together, our results align with the findings that the highest amount of genetic diversity, including at structural variants (Audano et al. 2019), exists within humans of African descent (Sherman et al. 2019).
The CACNA1C VNTR has been reported to be human-specific. It exists as a single 30-bp sequence in chimpanzee (Song et al. 2018) and other non-human primates. Chimpanzees and gorillas have matching single 30-bp sequences that differ from the human CACNA1C VNTR consensus repeat unit at three nucleotides (Fig. 1D) (Song et al. 2018). The Ts at the 3rd and 12th positions of the 30-bp chimpanzee sequence were observed in 42% and 21% of human repeat units, respectively. In contrast, the A at the 17th position of the 30-bp chimpanzee sequence was never observed in 34,172 human repeat units from this dataset. The G at this position of the human consensus repeat unit is rarely variable; it is a C in only 0.44% of repeat units. Thus, by virtue of the 17th position, all CACNA1C VNTR repeat units are distinct from the sequence in our closest evolutionary relative.
To investigate the timing of the repeat formation in more detail, we examined four ancient genomes dating to 50-120 thousand years ago: three Neandertals (Mafessoni et al. 2020; Prüfer et al. 2017, 2014) and one Denisovan (Meyer et al. 2012). We analyzed DNA sequencing coverage depth over the CACNA1C VNTR to infer copy number. This analysis indicated the presence of a repeat at lengths ranging from 3,360 kb to 10,560 kb, which is similar to that found in modern humans (Fig. 5F-G, Fig. S8). This analysis dates the expansion to somewhere between 4.5 million years ago (the estimate for divergence of modern humans and chimpanzees) (Prüfer et al. 2012) and 630-520 thousand years ago (the estimate for divergence of modern humans and Neandertals) (Prüfer et al. 2017). Our results show that the CACNA1C VNTR had already expanded prior to the divergence of early hominin populations (Fig. 5H).
Variable Region 2 is associated with schizophrenia and CACNA1C expression
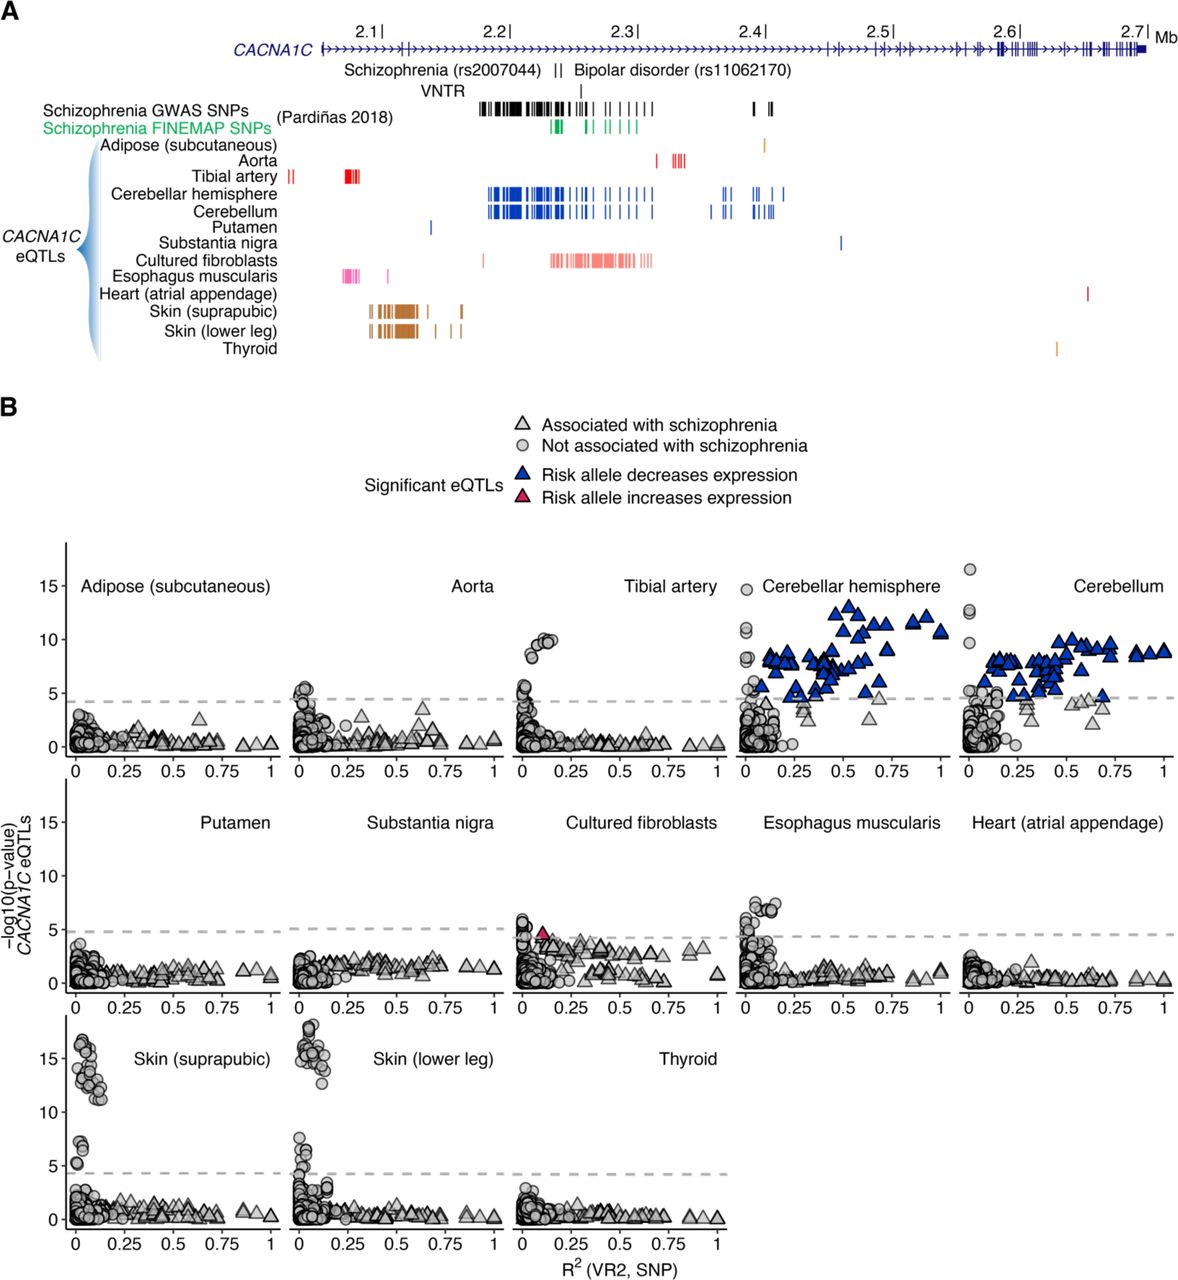
Intron 3 of CACNA1C harbored a series of ATAC-seq peaks in glutamatergic neurons from fetal brain (Trevino et al. 2021) and DNaseI hypersensitive sites (DHSs) in fetal brain from the Roadmap Epigenomics Mapping Consortium (Maurano et al. 2012). The VNTR also lay among CACNA1C eQTLs in four brain tissues profiled by the Genotype-Tissue Expression (GTEx) project (GTEx Consortium 2020): cerebellum (n=130), cerebellar hemisphere (n=130), with 122 eQTLs shared between these replicate tissues, putamen (n=1), and substantia nigra (n=1) (Fig. 6A).

(A) CACNA1C showing schizophrenia-associated SNPs (P<5×10⁻⁸), the fine-mapped causal set (PP>95%) (Pardiñas et al. 2018), and the VNTR (Song et al. 2018). Arcs depict GTEx brain eQTLs (cerebellum, cerebellar hemisphere, putamen, and substantia nigra). Shown are scATAC-seq data in in glutamatergic neurons from fetal brain (Trevino et al. 2021) and DNaseI hypersensitive sites (DHSs) in fetal brain from the Roadmap Epigenomics Mapping Consortium (Maurano et al. 2012). (B) VR allele counts for 35 HGSVC2 individuals with phased SNP genotypes. Grey alleles were excluded from linkage disequilibrium (LD) analysis. (C,D) LD (y-axis) between VR1 (C) or VR2 (D) and surrounding SNPs. Fine-mapped schizophrenia SNPs are highlighted in green. LD was calculated for VR2A and VR2B alleles; LD with VR2C and VR2D is shown in Fig. S9. Three top schizophrenia GWAS SNPs are in perfect LD with VR2. (E) Analysis of the relationship between VR2 and eQTLs in cerebellar hemisphere. eQTL significance in brain (y-axis) is strongly correlated with VR2 LD (x-axis). A second distinct eQTL signal is not in LD with VR2 and is not associated with schizophrenia. The eQTLs that are associated with schizophrenia show decreased expression of CACNA1C (blue). Dashed gray line indicates P value threshold for cerebellar hemisphere eQTLs. (F) Histogram of CACNA1C eQTL effect sizes for cerebellar hemisphere eQTLs in LD with schizophrenia and VR2 (D, blue).
We first examined linkage disequilibrium (LD) between VR1 and VR2 and the nearby schizophrenia-associated SNPs (Pardiñas et al. 2018). We focused on a subset of long-read assemblies with available phased SNP genotypes (n=70 HGSVC2 haplotypes) (Ebert et al. 2021). This subset of CACNA1C VNTR sequences had comparable VR allele frequencies to the whole dataset (Fig. 6B). We calculated LD between each VR and SNPs in a 1.4 Mb region around CACNA1C (Fig. 6C-D, Fig. S9). Fine-mapped schizophrenia SNPs showed high LD with VR2 and moderate LD with VR1, while SNPs not associated with disease were less correlated.
We used these data to examine the relationship between CACNA1C gene expression, the schizophrenia association, and VR2, which tags the VNTR. Intersecting CACNA1C eQTLs with GWAS results showed that schizophrenia risk alleles were associated with reduced CACNA1C expression. Comparison of eQTL P values to LD with VR2 showed that the eQTL was composed of two distinct signals (Fig. 6E, Fig. S10), only one of which was associated with schizophrenia and VR2. The degree of LD with VR2 was strongly correlated with the statistical significance of CACNA1C eQTLs (R2=0.531, P<2.2×10⁻¹⁶). eQTL effect sizes were quantified as log allelic fold change (aFC), which is equivalent to the log-fold expression ratio of the individuals homozygous for the alternate allele to those homozygous for the reference allele of an eQTL (Mohammadi et al. 2017). Cerebellar hemisphere eQTLs in LD with VR2 had an average aFC of -0.998, reporting a roughly two-fold decrease in expression (Fig. 6F). Thus, our analysis identifies VR2 as a potentially functional variant at this locus.
DISCUSSION
Leveraging the availability of long-read, haplotype-resolved genomes, we characterize the structure and genetic diversity of a human-specific VNTR at the CACNA1C schizophrenia locus. We delineate the complex variation of the VNTR in terms of repeat unit variants, Types, internal duplications, and polymorphic variable regions. Our analysis goes beyond the 27 previously reported sequences (Song et al. 2018), all of which are classified as Type 1 in our analysis. We show that the schizophrenia association and CACNA1C brain eQTL are both tightly linked to VNTR variants. These data support a model where common variants mediate schizophrenia risk through an effect on CACNA1C expression. While our analysis most specifically implicates VR2, further investigation will be needed to determine the exact function of the allelic diversity at the VNTR. In particular, while our results show an association between VR2 and gene expression, it is unclear whether the VNTR acts as an enhancer at its endogenous locus, and if so, what repeat sequence features are necessary and sufficient. In particular, VR1 and VR2 are in tight linkage disequilibrium and lie only 1.44 kb apart on average. And the VNTR is surrounded by numerous intronic DNaseI hypersensitive sites which may interact to regulate its function.
A key question is whether schizophrenia-associated variants increase or decrease CaV1.2 channel function, and in what cell context. Our results support that the risk allele decreases CACNA1C expression in cerebellum. Corroborating this, risk alleles in CACNA1C intron 3 have been previously associated with decreased CACNA1C expression in cerebellum (Gershon et al. 2014) and superior temporal gyrus (Eckart et al. 2016). Assessment of repeat-associated k-mers in GTEx is also consistent with the risk allele reducing CACNA1C expression in cerebellum (Lu et al. 2023). In contrast, studies in dorsolateral prefrontal cortex (Bigos et al. 2010) and induced neurons (Yoshimizu et al. 2015) have reported an association of risk alleles with increased CACNA1C expression. Timothy Syndrome mutations result in a gain of CaV1.2 channel function (Bamgboye et al. 2022; Barrett and Tsien 2008; Splawski et al. 2004). Examples of CACNA1C loss of function also exist and have neurodevelopmental and neurobehavioral sequelae (Rodan et al. 2021; Quintela et al. 2017; Mio et al. 2020; Dedic et al. 2018; Smedler et al. 2022). Yet, it is unclear what the specific consequences of decreased CACNA1C expression would be on the affected cell types and brain networks. Furthermore, schizophrenia is not thought to involve brain networks in cerebellum; instead, several cortical networks are implicated, many of which involve prefrontal brain regions (Trubetskoy et al. 2022). The high cell type uniformity of cerebellum could favor detection of CACNA1C eQTLs, as the cerebellum contains 80% of the neurons in the human brain, of which 99% are granule cell neurons (Azevedo et al. 2009; Consalez et al. 2020). Other regions including neocortex manifest greater neuronal heterogeneity and a higher prevalence of glial cells (Fang et al. 2022) with low CACNA1C expression (Allen Institute for Brain Science 2019).
Repetitive sequences pose increased risk for sequencing and assembly errors. The error rates of the source assemblies have been reported to be <10-4 for PacBio continuous long read assemblies (HGSVC2) (Ebert et al. 2021), <10-5 for PacBio HiFi assemblies (HGSVC2, HPRC) (Ebert et al. 2021; Liao et al. 2023), and <10-7 for the CHM13 haploid assembly (Nurk et al. 2022). Our analyses of Types and VR alleles is tolerant to nucleotide variation as each group is supported by multiple independent sequences, with the exception of Types 6 and 7 that were represented only by a single sequence. Each genome in our analysis included exactly two VNTR sequences, each on a single contig and flanked by unique sequence. For the 5 individuals included in both HGSVC2 and HPRC, 4 had identical CACNA1C VNTR sequences (Materials and Methods). Additionally, for each of the 3 trios in this dataset, we observed accurate transmission of a single maternal and paternal CACNA1C VNTR sequence. No individual had two identical alleles, lowering the chance that a read was assigned to the incorrect haplotype. Together, these considerations suggest that the general features of our VNTR analysis do not reflect basecalling or systematic assembly errors.
Our analysis discretizes CACNA1C VNTR VR sequences that exist among a spectrum of variation, providing a convenient model of complex genomic data but potentially drawing arbitrary distinctions. In particular, partitioning VR2 sequences into 4 alleles masks significant underlying variability. First, some sequences resembled both VR2B and VR2C, and their assignment to VR2C may reflect arbitrary features of our multiple sequence alignment. Second, VR2B intra-allele sequence variability was higher than the inter-allele differences between VR2B and VR2C, suggesting that VR2B and VR2C could be more similar than different. Indeed, VR2C showed high LD with schizophrenia FINEMAP SNPs (Fig. S9A). But one clear difference between VR2B and VR2C is that VR2B co-occurs with VR1B, and VR2C with VR1A. This analysis underscores the question of whether variable structural alleles in high LD should be genotyped separately or together as a feature of the whole structural variant, which should be carefully considered in future analyses of VR1 and VR2.
The striking structural diversity of the CACNA1C VNTR and our results indicating that several Types result from duplication invites speculation around the mechanism of its expansion. In contrast with somatic variation at DNA repeats induced by replication slippage or homologous recombination after erroneous DNA repair, variation within subtelomeric VNTRs may emerge through meiotic recombination events. One possible mechanism for CACNA1C VNTR expansion is unequal exchange through homologous pairing-dependent events at meiosis, which could change repeat unit copy number and repeat unit sequences but preserve the repeating frame (Wolff et al. 1991; Smith 1976). Consistent with this, we observe only 11 distinct repeat units of size other than 30 bp; most (n=8) are only 1 bp longer or shorter than a typical 30 bp repeat unit. Models of this mutational process show that over time such repetitive sequences would be unstable in length. Unequal crossover events between either homologous chromosomes or sister chromatids that lengthen or shorten the repetitive sequence may inevitably occur (Wolff et al. 1991; Smith 1976). Subtelomeres demonstrate higher meiotic recombination rates and higher frequency of double-strand breaks. Coincident with this, VNTRs are enriched relative to short tandem repeats (STRs) near chromosome ends (Sulovari et al. 2019; Audano et al. 2019; Barton et al. 2008). CACNA1C itself lies only 2 Mb from the start of chromosome 12. We speculate that evolutionary adaptation, involving highly variable gene families, may be privileged at subtelomeric chromosome ends. Examples of subtelomeric gene families driving adaptation to environmental changes exist in human (e.g., the olfactory receptor gene family) (Buck and Axel 1991), yeast (e.g., MAL gene family) (Brown et al. 2010), and the parasite causing malaria in humans P. falciparum (e.g., antigen genes) (Corcoran et al. 1988). Furthermore, the number of distinct structural alleles of the CACNA1C VNTR provides hints about its patterns of divergence. Our analysis suggests that Type 2 and Type 3 derive from Type 1, while the other Types that only share starting repeat units emerged independently. Given the length of time that the CACNA1C VNTR has existed, we expect that these large structural changes were rare and occurred early in the human lineages whose descendants are found today.
The high degree complexity of the CACNA1C VNTR can be contextualized by comparison to 1,584 tandem repeats expanded in humans and identified in six long-read haplotype assemblies of Yoruban, Chinese, and Puerto Rican origin (Sulovari et al. 2019). Only 13% of these repeats were also mistakenly assembled in GRCh38/hg38. The CACNA1C VNTR has a maximum length ∼6 times longer than any of these human-specific VNTR sequences, and its 30-bp repeat unit size is larger than 46% of human-specific tandem repeat consensus units. A complementary characterization describes VNTR variation through genome-wide analysis of repeat unit composition (Ren et al. 2023). The expected number of distinct alleles per VNTR genome-wide (7.5-16.7 alleles) was on par with the number of CACNA1C VNTR Types. In contrast, the average number of distinct repeat units per VNTR (8.97 ± 26.57 repeat units) was greatly exceeded by the 158 distinct repeat units of the CACNA1C VNTR. Comparisons with these genome-wide studies comes with a caveat that their datasets were different subsets of the 155 long-read assemblies described in this manuscript, capping their allelic diversity. Nonetheless, these analyses frame the CACNA1C VNTR within a genome-wide context and establish it as possibly the human-specific VNTR with the greatest variability in length and the most diverse repeat unit structure.
The results described here address a tradeoff between conducting a single-locus analysis and consulting a pangenome (Liao et al. 2023) for complex genomic regions. While pangenome graphs can be referenced quickly, their accuracy is tied to the quality of the underlying alignment and the likely simplification of allelic complexity (Lu et al. 2023). In contrast, our detailed analysis of the CACNA1C VNTR establishes a template for teasing apart such complex GWAS associations. More work is needed to test the function of each candidate causal variant in disease cohorts and in a relevant cell type.
Data Availability
All data produced in the present study are available upon reasonable request to the authors
ftp://ftp.1000genomes.ebi.ac.uk/vol1/ftp/data_collections/HGSVC2/release/v1.0/assemblies
https://s3-us-west-2.amazonaws.com/human-pangenomics/index.html?prefix=working/
http://walters.psycm.cf.ac.uk/clozuk_pgc2.meta.sumstats.txt.gz
https://www.internationalgenome.org/data-portal/sample
http://cdna.eva.mpg.de/neandertal/altai/AltaiNeandertal/bam/
http://ftp.eva.mpg.de/neandertal/Chagyrskaya/BAM/
http://cdna.eva.mpg.de/denisova/alignments/
http://ftp.eva.mpg.de/neandertal/Vindija/bam/Pruefer_etal_2017/
MATERIALS AND METHODS
Analysis of VNTR in long and short-read sequencing data
The CHM13 haploid genome assembly was downloaded from the Telomere-to-Telomere (T2T) GitHub site. Haplotype assemblies for 34 individuals were downloaded from the HGSVC2 (Ebert et al. 2021) FTP site. In cases where two assemblies exist for an individual, assemblies using PacBio HiFi reads were preferred over PacBio continuous long reads (CLR). Haplotype assemblies for 43 individuals were downloaded from the HPRC (Liao et al. 2023) S3 bucket. 5 individuals were sequenced by both HGSVC2 and HPRC (HG00733, HG02818, HG03486, NA19240, NA24385). HGSVC2 assemblies were used for the individuals for which both projects had identical CACNA1C VNTR sequences (HG00733, HG03486, NA19240, NA24385). The HGSVC2 as-sembly of HG02818 had four contigs containing the consensus CACNA1C repeat unit, one of which matched the HPRC HG02818_paternal assembly. None of the other three contigs contained a full CACNA1C VNTR with unique flanking sequence, and thus the HPRC assembly was chosen for HG02818.
Corresponding short-read sequencing data (n=70 individuals) were downloaded from the 1000 Genomes Project (Byrska-Bishop et al. 2022). Download paths are in Table S1. Assembly coordinates of each VNTR sequence are listed in Table S2.
Assemblies were scanned to identify contigs containing the previously identified CACNA1C intron 3 consensus repeat unit (Song et al. 2018). Tandem Repeats Finder (Benson 1999) v4.09 was run on each resulting contig using parameters ’2 7 7 80 10 50 32 -m -f -d’ to detect patterns near the size of the CACNA1C repeat unit. With a matching weight of 2 and a minimum alignment score of 50, at least 25 characters need to be aligned to the consensus repeat unit perfectly, which is permissive for a repeat unit of 30 bp. For this targeted approach to find the CACNA1C VNTR, we used a maximum period size of 32 bp.
Consensus CACNA1C VNTR sequences by Type
To align CACNA1C VNTR sequences in a unit boundary-aware manner, each VNTR sequence was encoded as a sequence of ASCII characters where each character represents one of 37 repeat units (Fig. 1D). An initial multiple sequence alignment of all CACNA1C VNTR sequences was created using ’MAFFT –text –globalpair –maxiterate 1000’ (Katoh and Standley 2013). Then, sets of sequences were grouped with similar alignment patterns. Alignments of these sets were created iteratively until no sequence appeared visually misplaced, evidenced by the presence of large alignment gaps. Final alignments for each Type were created using ’MAFFT --op 4 --text --globalpair’.
A consensus sequence for each Type was defined from the most frequent unit at each alignment position. If the most frequent unit was an alignment gap with ≤ 65% frequency, the most frequent non-gap unit was used. In cases where two units were in equal frequency at a position, the more common unit among all 34,172 repeat units was chosen for the consensus.
Assessing duplication within CACNA1C VNTR sequences
An exemplar sequence with no duplications was defined for each VNTR Type. Using a sliding window of N repeat units, every overlapping window along the exemplar VNTR sequence was quantified in each sequence by counting exact matches using grep.
Because Types 1, 2 and 3 had similar repeat unit compositions (Fig. S1C), the Type 1 consensus sequence was defined as an exemplar sequence for all three. The width of the sliding window for Types 1, 2, and 3 was 6 repeat units.
For Types 4, 6, and 7, their consensus sequences were defined as exemplar sequences and scanned for duplications within themselves. The width of the sliding window for Types 4, 6, and 7 was 6 repeat units.
Because the Type 5 consensus sequence contained duplications itself, the Type 5 exemplar sequence was derived from the HG00735_paternal sequence by excluding 5 small insertions and 3 single repeat unit insertions present as gaps in the multiple sequence alignment of all four Type 5 sequences (Fig. S1A). The width of the sliding window for Type 5 was 8 repeat units.
Identifying variable repeat regions and alleles
Variability at each position in the multiple sequence alignment was computed as Shannon’s un-certainty  where pi is the fraction of repeat units of unit type i and K is the number of different repeat units at position X. Gaps are included in the calculation. H(X) was normalized as
  and a smoothing filter was applied using the R pack-age ksmooth. Variable regions were defined where H(X)normalized > 0.25 and length > 7 aligned repeat units. Variable region sequences were inspected manually and narrowed by a maximum of 2 repeat units on either end (Fig. S2).
For each variable region, aligned sequences were extracted from Type 1 sequences and partitioned into alleles. First, a consensus sequence for one allele was defined as the most common VR sequence (Table S4, Table S5). Hamming edit distances in repeat units were calculated between the consensus sequence and each unique VR sequence using StrDist in the R package DescTools. A consensus sequence for the second allele was defined as the next most common VR sequence with a large edit distance from the first allele. Similarly, edit distances (in repeat units) were calculated between the second allele and each unique VR sequence. Partitioning VR sequences into alleles was done using edit distance thresholds. For example, a threshold t was chosen such that a sequence belonging to the A allele had less than t mismatches (in repeat units, including gaps) to the consensus A sequence and greater than t mismatches to the consensus B sequence. For VR1, t=7.5 and for VR2, t=10 for VR2A and t=12.5 for VR2B. If VR sequences clustered into more than two groups, the other groups were manually defined as rarer VR alleles. Unclassified VR sequences fell outside the selected edit distance thresholds.
For nucleotide-level alignments (Fig. S4B and Fig. S5B), each aligned VNTR sequence was converted from encoded characters to nucleotides while preserving the positions of alignment gaps. Global alignments were adjusted using pairwiseAlignment from the R package Biostrings to account for re-incorporation of non-30-bp repeat units.
To identify VR alleles in Type 2 and Type 3 sequences, CACNA1C VNTR sequences were scanned for matches to each consensus VR allele allowing for maximum 2 mismatches (in repeat units) using vmatchPattern from the R package Biostrings.
Calculating linkage disequilibrium between variable regions and nearby SNPs
We analyzed LD between variable regions and nearby SNPs in 35 individuals from HGSVC2 (Ebert et al. 2021). Phased genotypes of VR1 and VR2 were included for the 34 HGSVC2 individuals contributing long-read assemblies to our dataset and one additional individual (HG02818) sequenced by both HGSVC2 and HPRC but whose VR alleles were identified using the HPRC assemblies. Custom VCF entries were created for VR1 and VR2 and inserted into the sorted file with phased variant calls. For each VR, the A allele (VR1A and VR2A) was encoded as the reference allele. VR1 was entered as a single biallelic variant and the four alleles of VR2 were split into three biallelic entries, one for each alternate allele (VR2B, VR2C, and VR2D). Positions in the reference genome for each entry were chosen within the reference CACNA1C VNTR region (chr12:2255791-2256090, GRCh38/hg38) on chromosome 12, starting at the first position (2255791-2255795). Only haplotypes with a Type 1 CACNA1C VNTR (n=61) were encoded as either 0 or 1, indicating the reference or alternate VR allele respectively. Haplotypes with an unclassified VR or Type 2-7 sequence or were indicated as missing (”.”).
SNP genotypes were taken from the HGSCV2 phased variant calls within the 1.4 Mb region surrounding the CACNA1C locus (chr12:1600001-3000000, GRCh38/hg38).
LD was calculated between each SNP-VR pair using ’vcftools --hap-r2’.
Data retrieval: GWAS
Summary statistics of the CLOZUK+PGC2 schizophrenia meta-analysis and the subset of highquality imputed SNPs (Pardiñas et al. 2018) were obtained from the Psychiatric Genomics Consortium repository. SNP coordinates were converted from GRCh37/hg19 by looking up GRCh38/hg38 coordinates in dbSNP using the rsID. Odds ratio (OR) was used to identify risk (OR > 1) and protective (OR < 1) alleles. Fine-mapped SNPs were obtained from Supplementary Table 4 of the same study (Pardiñas et al. 2018) and similarly converted to GRCh38/hg38.
Analysis of eQTLs from GTEx
eQTLs from the v8 analysis freeze were downloaded from the GTEx Portal on 09/20/2017. Analysis was limited to significant associations with ENSG00000151067.21 (Ensembl) within chr12:1600001-3000000 (GRCh38/hg38). For eQTLs colocalized with schizophrenia associations, eQTL effect sizes were defined as the effect of the risk allele relative to the protective allele by inverting the slope of the linear regression when the reference allele matched the risk allele.
To estimate the magnitude of CACNA1C expression change associated with SNPs in intron 3, software for calculating the log allelic fold change (aFC) was downloaded from the aFC GitHub site. aFC is equivalent to the expected log-fold expression ratio of the individuals homozygous for the alternate allele to those homozygous for the reference allele of an eQTL (Mohammadi et al. 2017). aFC was calculated using ’aFC.py --min_samps 2 --min_alleles 1 -- log_xform 1 --log_base 2’ with GTEx normalized expression values and covariates in the brain tissue with the most eQTLs (cerebellar hemisphere), GTEx SNP eQTLs for CACNA1C (Ensembl ID ENSG00000151067.21) in cerebellar hemisphere, and GTEx phased variant calls included as input files. Phased variant calls for 838 GTEx individuals were obtained from dbGaP (release v8, GTEx_Analysis_2017-06-05_v8) on 01/12/2019.
Calculating CACNA1C VNTR length by WGS coverage
Local sequencing coverage was used to estimate CACNA1C VNTR length. Average depth over three regions (left flanking 10 kb: chr12:2245791-2255790, right flanking 10 kb: chr12:2256091-2266090, CACNA1C VNTR region: chr12:2255791-2256090, GRCh38/hg38) was calculated using ’samtools depth -a’. CACNA1C VNTR length was estimated by computing the average of coverage depth over the VNTR to coverage depth over each flanking sequence. This length was scaled by a conversion factor 300/30 to account for the length of the collapsed repeat in the GRCh38/hg38 reference sequence. The estimate corresponds to the average of both alleles (in number of repeat units) within a diploid genome.
Chromosome 12 BAM files for four archaic human individuals were downloaded. CACNA1C VNTR lengths were estimated as before, using UCSC liftOver to identify the corresponding regions in GRCh37/hg19.
Data, Materials, and Software Availability
GTEx protected data is hosted in an AnVIL repository (https://gtexportal.org/home/protect-edDataAccess). Access to GTEx protected data is available through the database of Genotypes and Phenotypes (dbGaP) (accession no. phs000424.v8).
Summary statistics from the schizophrenia GWAS are available at http://wal-ters.psycm.cf.ac.uk/clozuk_pgc2.meta.sumstats.txt.gz.
Variant calls for HGSVC2 (http://ftp.1000genomes.ebi.ac.uk/vol1/ftp/data_collections/HGSVC2/release/v2.0/integrated_callset/variants_freeze4_snv_snv_alt.vcf.gz) (Ebert et al. 2021) and 1000 Genomes individuals (http://ftp.1000ge-nomes.ebi.ac.uk/vol1/ftp/data_collections/1000G_2504_high_coverage/working/20201028_3202_phased/CCDG_14151_B01_GRM_WGS_2020-08-05_chr12.filtered.shapeit2-duohmm-phased.vcf.gz) (Byrska-Bishop et al. 2022) are available through the 1000 Genomes FTP.
WGS alignment files for archaic human individuals can be found at the following FTP sites: http://cdna.eva.mpg.de/neandertal/altai/AltaiNeandertal/bam/ (Denisova 5) (Prüfer et al. 2014), http://ftp.eva.mpg.de/neandertal/Chagyrskaya/BAM/ (Chagyrskaya 8) (Mafessoni et al. 2020), http://cdna.eva.mpg.de/denisova/alignments/ (Denisova 3) (Meyer et al. 2012), and http://ftp.eva.mpg.de/neandertal/Vindija/bam/Pruefer_etal_2017/ (Vindija 33.19) (Prüfer et al. 2017).
Supplementary Materials
SUPPLEMENTARY FIGURES

(A) Collection of 155 CACNA1C VNTR sequences grouped by Type and aligned. An asterisk at the end of Type 5 indicates HG00735_paternal. (B) Count of haplotype assemblies for each Type by long-read technology. (C) Cumulative distribution of CACNA1C VNTR lengths in kb (n=155 sequences, mode=5.73 kb).

Copy number (y-axis) of a sliding window (width=6 repeat units) within the consensus sequences of Type 4 (A), Type 6 (B), and Type 7 (C). Pairs of equally-sized peaks identify three tandem duplications on the order of hundreds of bp: Duplication 6 in Type 4, and Duplication 5 and Tandem Duplication 7 in Type 7. Duplications are numbered by decreasing size. Tandem Duplication 6 is not exactly in tandem; it is separated by one repeat unit. Other smaller regions in Type 4 and Type 7 register a dosage of 2, but are not contiguous and therefore do not reflect tandem duplications. Type 6 has a dosage of 1 across its whole sequence.

Enlargement of VR1 and VR2 in the alignment of Type 1 sequences (Fig. 4B). Constant regions of 5 repeat units flank each VR. Sequences are ordered by VR2 allele classification (right), revealing near-complete correspondence with VR1 allele classification (left); black asterisks (left column) denote the only two VR1 alleles that deviate from this pattern.

(A) Scatterplot of edit distances (in repeat units) to the VR1B consensus vs. the VR1A consensus. Each point represents one of the 18 distinct VR1 sequences. Overlapping points are plotted with a small amount of jitter. Shaded areas indicate thresholds used to partition sequences into alleles. (B) Scatterplot of edit distances (at the nucleotide level) to two exemplar full CACNA1C VNTR sequences. Each point represents a full, aligned Type 1 sequence (n=134) and its coordinates are edit distances to a VNTR sequence with the consensus VR1B allele (HG00171_h2, y-axis) and a VNTR sequence with the consensus VR1A allele (HG00096_h1, x-axis). VR1 alone does not explain the clustering of these sequences. However, an exceptional VR1A in two CACNA1C VNTR sequences with VR2B (HG01361_paternal, NA20509_h2) cluster these sequences by their VR1 allele (see Fig. S5). (C) Consensus VR1 sequences and their forms (see Table S4 for details) identified in Type 1 sequences. Consensus alleles are in bold. Non-consensus VR1 sequences classified to each allele are numbered and listed below the consensus. Three CACNA1C VNTR sequences (HG00732_h1, HG00733_h2, and NA19650_h1) contained large deletions that included VR1, resulting in the VR1 sequence VR1B-2. The unclassified VR1 sequence is named by the assembly IDs it is identified in.

(A) Scatterplot of edit distances (in repeat units) to the VR2B consensus vs. the VR2A consensus. Each point represents one of the 71 distinct VR2 sequences. Overlapping points are plotted with a small amount of jitter. Shaded areas indicate thresholds used to partition sequences into two common alleles. The two rarer alleles (VR2C and VR2D) were defined manually. (B) Scatterplot of edit distances (at the nucleotide level) to two exemplar full CACNA1C VNTR sequences. Each point represents a full, aligned Type 1 sequence (n=134) and its coordinates are edit distances to a VNTR sequence with the consensus VR1B allele (HG00171_h2, y-axis) and a VNTR sequence with the consensus VR1A allele (HG00096_h1, x-axis). Sequences cluster according to VR2 allele. However, two CACNA1C VNTR sequences (HG01361_paternal, NA20509_h2) with a VR2B allele (VR2B-6) inappropriately cluster near sequences with VR2D alleles because they have VR1A (VR1A-6); most sequences with VR2B have VR1B. (C) Consensus VR2 sequences and their forms (see Table S5 for details) identified in Type 1 sequences. Consensus alleles are in bold. Non-consensus VR2 sequences classified to each allele are numbered and listed below the consensus. One CACNA1C VNTR sequence (NA19650_h1) has a large deletion that includes VR1 and part of VR2, resulting in the VR2 sequence VR2A-32. The unclassified VR2 sequence is named by the assembly IDs it is identified in.

(A) Repeat unit variability, shown as normalized Shannon’s uncertainty H(x), above its multiple sequence alignment of 27 CACNA1C VNTR sequences (GenBank accessions MH645925–MH645951) that were long-read sequenced following PCR amplification and size-selection (Song et al. 2018). Variable regions are defined at H(x) > 0.25 and length > 7 aligned repeat units. (B) Expanded view of variable regions comparing their previously described boundaries to the boundaries defined in this paper.

(A-B) VR sequences in Type 2 (A) and Type 3 (B) sequences. Each VR is aligned to its consensus. In Type 2, VR1 is duplicated and is found as VR1A and VR1B in equal proportion; VR2 is found as VR2B and VR2C in nearly equal proportion except for one unclassified sequence. In Type 3, VR1 exists as VR1A only, and VR2 exists as VR2C. Asterisks indicate sequences unique to Type 2 and Type 3; number of asterisks is proportional to the number VR sequences unique to Type 2 and Type 3. Positions with a mismatched repeat unit in any sequence relative to the consensus are shown with red ticks; mismatches between a gap and a repeat unit are not shown. (C-D) Frequency of VR1 (C) and VR2 (D) alleles in Type 1, 2, and 3 sequences. Only the primary copy is counted for sequences with a duplicated or triplicated VR.

(A) Schematic for estimation of CACNA1C VNTR length (in repeat units). Estimate corresponds to the average of both alleles within a diploid genome. Average sequencing coverage depth is computed across three regions: the CACNA1C VNTR region (V) and its two flanking 10-kb segments (F1 and F2). Average VNTR length (in repeat units) is computed as the average of V/F1 and V/F2 scaled by a conversion factor. (B) Average VNTR length is estimated for 70 individuals from short-read WGS data from 1000 Genomes Project 30X on GRCh38. Matching long-read assemblies are used to establish actual length; length is averaged across both alleles from the same individual. (C) Scatterplot of VNTR lengths estimated from WGS (averaged across each individual’s two alleles, y-axis) vs. actual lengths measured directly from long-read haplotype assemblies (n=140 VNTR sequences, n=70 diploid individuals).

(A-B) Linkage disequilibrium (LD, y-axis) between surrounding SNPs (x-axis) and VR2C (A) and VR2D (B). Finemapped schizophrenia SNPs are highlighted in green. VR2C (frequency=0.08) shows a similar LD pattern as VR2B with fine-mapped schizophrenia SNPs. Though observed infrequently, VR2D (frequency=0.05) displays a different LD structure with nearby SNPs.

(A) CACNA1C eQTLs by GTEx tissue. (B) Analysis of the relationship between VR2 and eQTLs in GTEx tissues with at least one CACNA1C eQTL. Only cerebellar hemisphere and cerebellum had an eQTL signal associated with schizophrenia and VR2 (blue). Dashed gray line indicates eQTL P value threshold. Significant CACNA1C eQTLs for adipose (subcutaneous) (n=1), putamen (n=1), substantia nigra (n=1), heart (atrial appendage) (n=1), and thyroid (n=2) are missing after intersecting data with schizophrenia GWAS and LD results.
SUPPLEMENTARY TABLES
ACKNOWLEDGEMENTS
This work was partially funded by National Institutes of Health (NIH) grants RM1HG009491 and R35GM119703 (to M.T.M.) and R01NS125271 and R01MH071739 (to R.W.T.).
Footnotes
Competing interest statement: The authors have no competing interests to declare.
Updated manuscript text and figures throughout
REFERENCES


