
2 Abstract
Background Gastric fluid plays a key role in food digestion and drug dissolution, therefore, the amount of gastric fluid present in a fasted state may influence subsequent digestion and drug delivery. We aimed to describe intra- and interindividual variation in fasted gastric content volume (FGCV) and to determine the association with age, sex, and body size characteristics.
Methods Data from 24 MRI studies measuring FGCV in healthy, mostly young individuals after an overnight fast were pooled. Analysis included 366 participants with a total of 870 measurements. Linear mixed model analysis was performed to calculate intra- and interindividual variability and to assess the effects of age, sex, weight, height, weight*height as a proxy for body size, and body mass index (BMI).
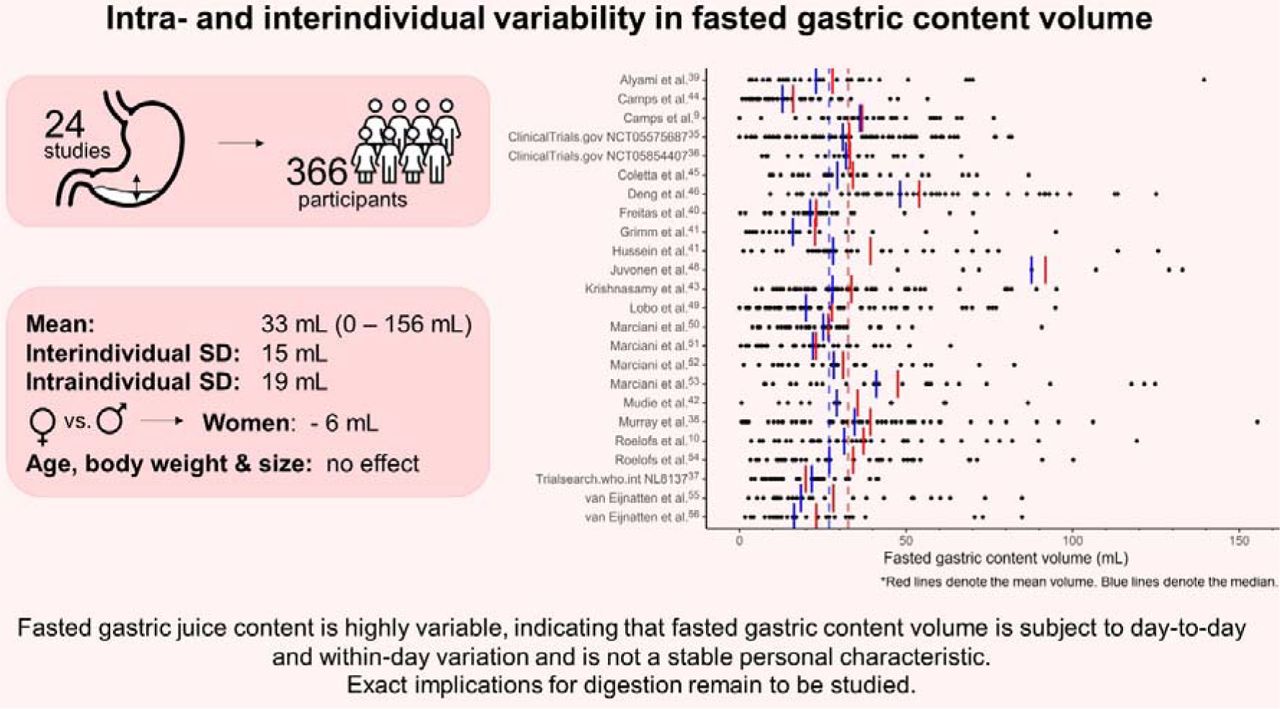
Results FGCV ranged from 0 to 156 mL, with a mean (± SD) value of 33 ± 25 mL. The overall coefficient of variation within the study population was 75.6%, interindividual SD was 15 mL, and the intraindividual SD was 19 mL. Age, weight, height, weight*height, and BMI had no effect on FGCV. Women had lower volumes compared to men (MD: -6 mL), when corrected for the aforementioned factors.
Conclusion FGCV is highly variable, with higher intraindividual compared to interindividual variability, indicating that FGCV is subject to day-to-day and within-day variation and is not a stable personal characteristic. This highlights the importance of considering FGCV when studying digestion and drug dissolution. Exact implications remain to be studied.

KEY POINTS
Fasted gastric content volume is highly variable, both within an individual and between individuals, and should range between 0 and 138 mL in healthy young individuals.
Women have lower fasted gastric content volume compared to men; age, body weight and body size were not associated with differences in fasted gastric content volume.
Fasted gastric content volume can impact both digestion and drug dissolution, although exact implications of the observed variations remain to be studied.
3 Introduction
Digestion is the breakdown of food into particles that can be absorbed by the body. This process starts with the oral phase, where mastication and secretion of saliva lead to the formation of a food bolus that can be swallowed safely, and continues in the gastrointestinal tract1,2. Digestion is a series of mechanical, physiological, and biochemical processing steps that eventually allows for absorption and utilization of nutrients3. These biochemical processing steps include the breakdown by acid and enzymes present in gastric secretions. Gastric fluid serves two main functions: it acts as a first line of defense against infection by killing swallowed microorganisms, and it aids in digestion by initiating the breakdown of food4. Gastric fluid is a combination of water, hydrochloric acid (HCl), gastric lipase, pepsin, intrinsic factor, ions (Na+, K+, and Cl-), and mucus4,5. These components are continuously secreted by endocrine cells in the stomach wall to maintain an acidic environment with a pH between 1.4 and 2.0 in the fasted state5,6. The fasted gastric secretion rate is ∼1 mL min-1 but after food ingestion it can increase to up to 9 mL min-1 6,7.
The main zymogen in gastric fluid is pepsinogen7,8. Under acidic conditions, pepsinogen converts into its active form, pepsin5,7. A pH ≤ 2.0 allows pepsin to function optimally, while a pH > 7.2 irreversibly denatures it. The secretion of HCl is therefore essential for the activity of pepsin8. Pepsin is important for the digestion of proteins as it breaks them down into smaller peptides7. Due to its role in protein digestion, the amount of gastric fluid present in the fasted stomach will influence gastric protein digestion by affecting the pH and amount of pepsin available. Camps et al.9 found that FGCV affected gastric layering and gastric emptying of infant formula. In line with this, Roelofs et al.10 found that FGCV was highly correlated with the destabilization of infant formula in the stomach: a higher FGCV correlated with earlier gastric phase separation of the emulsion. Since the emulsion was stabilized with casein-whey complexes, this effect is likely explained by increased protein hydrolysis and flocculation due to the low pH and the presence of pepsin in the stomach. When food is ingested, gastric pH increases due to the buffering effect of the meal11. However, with a higher FGCV, the gastric pH will initially be lower for a given buffering effect. In addition, more pepsin will also be available. Since pepsin activity is higher at low pH12, a higher fasted gastric fluid volume is thus associated to both a higher amount of pepsin and a higher pepsin activity, leading to increased protein hydrolysis in the early stages of digestion6. Moreover, FGCV is also a crucial parameter in oral drug delivery. Changes in fasting volumes and composition contribute to intra- and interindividual variability in drug plasma profiles13,14. Data on the variability are therefore much needed in order to optimize in vitro and in silico models for the development of novel drugs and dosage forms15.
Many studies that investigated variability in fasted gastric fluid have used gastric aspiration to measure the stomach content. Gastric aspirates are taken through a nasogastric- or endoscopic tube and is usually done over a 15 to 60-minute period. Nasogastric intubation is an invasive procedure which could perturb the baseline physiological state and the progression of the tube from the throat to the stomach is often aided with water swallows. Gastric emptying also depends on the actual positioning of the tube ports within the stomach. Although total gastric content can be measured with this method, results are often reported as secretion rates16. More recently, magnetic resonance imaging (MRI) has been used to measure gastric content volume. This method is less invasive and the technique is inherently suited to visualize body fluids with excellent spatial resolution. In contrast to gastric aspirates, the use of MRI yields measurement of gastric volume at specific time points.
Other studies found that various individual characteristics may affect gastric acid secretion. Goldschmiedt et al.17 found a trend towards an association of aging with gastric acid secretion and a higher basal acid output in older (44-71 y) compared to younger (23-42 y) adults (5.8 vs. 3.2 mmol h-1, p = 0.05). When the sexes were tested separately, older men (45-71 y) had significantly higher acid outputs than younger men (27-37 y, output: 8.4 vs. 3.8 mmol h-1). Older women (44-65 y) tended to have slightly higher acid outputs than younger women (23-42 y, p = 0.09) and older men had a higher output compared to older women. In contrast, Feldman et al.18 found no difference in fasted gastric acid secretion between young (18-34 y), middle-aged (35-64 y) and elderly (65-98 y). Studies showed that, on average, women have lower fasted gastric acid secretion rates compared to men. Feldman et al.19 found that basal acid output was almost twice as high in men compared to women. It has been suggested that this is due to hormones, lower body weight or smaller stature of women, thus having smaller stomachs, and associated decreased parietal cell mass19-25. Moreover, body weight was found to be weakly correlated with fasted gastric acid secretion rate in young adults (n = 176, r = 0.184)26. Altogether, these findings suggest a possible role of age, sex, and body size characteristics on FGCV. However, these studies all reported gastric acid secretion rate as measured by gastric aspiration as opposed to gastric fluid secretion rate or gastric volume. Moreover, taking gastric aspirates might result in underestimation as some of the gastric acid might be lost due to gastric emptying. In addition, removing the gastric juice from the stomach itself can reinforce the secretion27. Furthermore, the migrating motor complex (MCC) cycle is known to cause temporal changes in gastric motility and secretion13 and might therefore contribute to the variation in FGCV.
Grimm et al.15 compared FGCV from 5 MRI studies with 1-6 visits. They found a mean fasted volume of 25 ± 18 mL (n = 120), with a range from 1 to 96 mL. The interindividual and intraindividual variability were comparable, namely 49 ± 19 mL and 44 ± 18 mL, respectively.
To date, several MRI studies have reported FGCV. However, the sample sizes in these studies are generally small. The aim of this study was therefore to gather all available data and combine it to provide unique insights on the intra- and interindividual variation in FGCV and to explore possible associations with age, sex, and body size characteristics.
4 Methods
4.1 Study selection
Studies were selected by contacting members of the INFOGEST and UNGAP Imaging Working Group28 for available data and by emailing authors of eligible studies. A PubMed search was performed in May 2023 to identify eligible studies using the following search string: (all fields): “(gastric AND (emptying OR retention) AND ("Magnetic Resonance Imaging" OR MRI) [full text, clinical trial, human, English]”. Inclusion criteria for studies were: 1) data on FGCV was determined from MRI images, 2) the study was published in a peer reviewed journal and/or registered in a public trial registry, 3) the study was published in the past 15 years (in or after 2008) and 4) the study was conducted in healthy participants. Studies that did not include a fast of at least 10 h prior to the assessment of FGCV were excluded.
All volunteers provided written informed consent for the specific study procedures and subsequent use of anonymized volume data for comparative investigations. Authors who agreed to participate provided data on FGCV and individual participant characteristics (sex, age, weight, and height). Information on in- and exclusion criteria was extracted from the paper or the trial registration. This analysis was preregistered at OSF under code BDQS4 (https://doi.org/10.17605/OSF.IO/BDQS4).
4.2 Statistical analysis
FGCV data was characterized by means, medians, standard deviation, range, and overall coefficient of variation. A linear mixed model was used to assess intra- and interindividual variability and the effects of age, sex, and body size characteristics. Participant ID and study site were added as random factors. Age, sex, weight, height, weight*height, and BMI were added as fixed factors in two different models. That is, a model with age, sex, weight and height, and a model with age, sex, weight*height, and BMI. Non-collinearity of the variables was confirmed in both models with the Variance Inflation Factor (VIF) (all < 3)29. In addition, the intraindividual range (maximum value – minimum value) was calculated for each person to be able to compare our results to the study of Grimm et al.15.
To determine what a normal range of variation in FGCV might be, we calculated mean ± 3 SDs, which should cover 99.7% of the data. Since our data on gastric content volumes followed a right-skewed distribution, we applied this method to our square root transformed data and back transformed the outcome.
Normality of the data was assessed with quantile-quantile (QQ) plots of the residuals, which showed a roughly normal distribution. Using a square root transformation led to a slight improvement in the distribution but had no effect on our outcomes. Transforming the data leads to difficulty in interpreting the data, and because linear mixed models are capable of dealing with violation of the distributional assumptions30, we chose to report the results of the non-transformed data. Analysis was performed in R version 4.1.3, using the nlme31 and car package32. The significance threshold was set at p = 0.05. Data are expressed as mean ± SD unless stated otherwise.
5 Results
5.1 Included studies
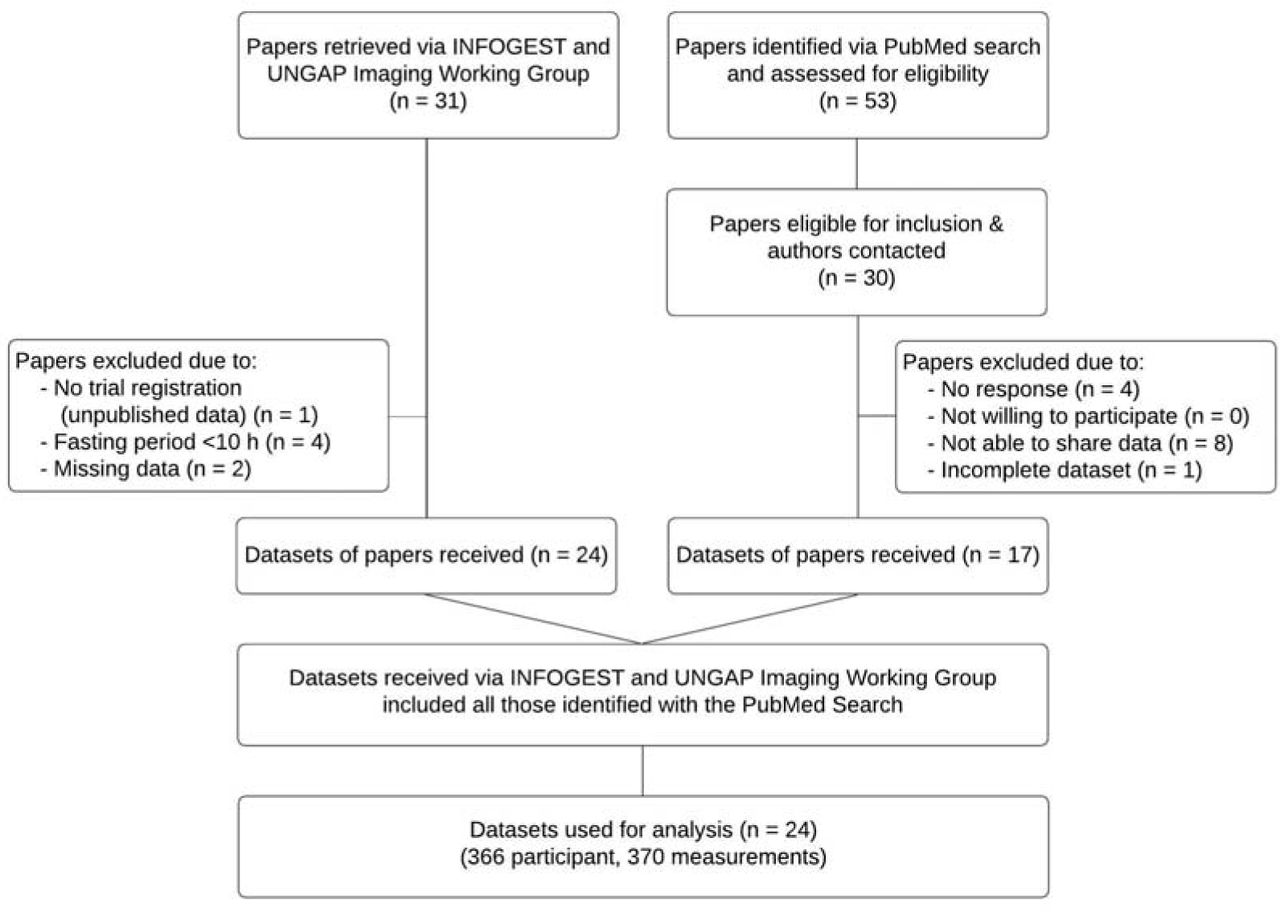
In total, data from 31 studies was received. Four studies were excluded due to a fasting period of less than 10h and two due to missing data. Data of four unpublished studies were received33-35 via the INFOGEST and UNGAP Imaging Working Group28, of which one was excluded due to unavailability of a trial registration. This led to inclusion of 24 studies in total, performed at 5 research sites in the UK, Germany, France, and the Netherlands (Figure 1).

Flow chart.
5.2 Study designs
The fasting regimen differed somewhat between the studies; details can be found in Supplementary Table 1. In short, all studies included an overnight fast of at least 10 hours (the selection criterion). In some studies, participants were not allowed to drink during the fast, while others could drink water (or non-caloric, non-caffeinated drinks) up until 1-2 hours before their visit. Five studies standardized the evening meal before the fasting. Fourteen studies included instructions on physical activity, either not allowing heavy exercise or keeping it constant before and on all test days. Studies that did not exclude participants based on medication use required the participants to quit the medication for at least the duration of the overnight fast.
Inclusion and exclusion criteria differed slightly between studies. Details can be found in Supplementary Table 2.
5.3 MRI measurements
All studies scanned the participants during a breath hold to fixate the position of the diaphragm and the stomach and prevent respiratory motion artefacts. Most studies scanned participants in a supine position, but two scanned participants in a supine tilted position with their left side slightly raised36,37 and one scanned participants in a right decubitus position38. This was not expected to influence gastric secretion, however, no literature could be identified on this. A study comparing gastric emptying of a soup in the right versus left decubitus position found no difference39.
Since the studies were performed at different research facilities, scanning protocols slightly deviated from each other. However, this is not expected to influence the results. Details of the scan sequences used can be found in Supplemental Table 3. All studies acquired transverse slices, except for Grimm et al.40 who acquired coronal slices.
Three studies analyzed gastric content volumes semiautomatically using an intensity-based thresholding technique40-42. All other studies manually delineated the stomach contents on each slice of the MRI scan to calculate the total gastric content volume.
5.4 Participants
In total, 366 participants were included in the analysis, 146 women and 220 men. Participants were 25.5 ± 6.8 years old and had a BMI of 22.7 ± 2.3 kg m-2 (Table 1 & 2). In total, 870 individual measurements were collected, of which one measurement was considered an outlier and excluded for analysis. This participant had a baseline FGCV volume of 373 mL, which is 12.3 SDs above the mean, which seems highly unlikely caused by natural variation. In addition, the same participant showed a FGCV of 21 and 26 mL on other days. Therefore, this high volume of 373 mL was deemed unrealistic. It might have been caused by non-compliance to the fasting period or a rare case of gastroparesis. The analysis was performed both on the complete dataset, as well as the set without outlier. Results of the analysis with the outlier are reported in Supplementary Tables 4 & 5.
The studies included up to six measurements of FGCV per participant, with the majority of the participants having two or three measurements. There were 47 participants with one measurement, 184 with two, 115 with three, 6 with four, and 14 with six measurements.
5.5 Fasted gastric content volume
FGCV ranged from 0 mL to 156 mL, with a mean value of 33 ± 25 mL (Figure 2, Table 2). An example of a relatively low, medium and high FGCV is shown in Figure 3. The median volume was 27 mL (IQR = 15 – 45 mL). Women had a slightly lower FGCV compared to men (31 ± 21 mL vs. 33 ± 27 mL). The overall coefficient of variation within the study population was 75.6%. The interindividual standard deviation, corrected for study site, was 15 mL, while the intraindividual standard deviation was 19 mL. The intraindividual range varied between 0 and 108 mL, with a mean of 24 mL and a SD of 21 mL.

Fasted gastric content volumes for each study and for all individual visits (black dots). Red lines denote the mean volume. Blue lines denote the median. The dashed lines denote the overall mean (red) and median (blue).

Illustration of fasted gastric content volume showing MRI images for three different volumes (left to right: 4 mL, 61 mL, and 119 mL).
Calculating the mean ± 3 SD, results in a FGCV that would range between 0-138 mL. This is in fair agreement with the volumes in our data, only 2 measurements are outside of this range (0.2% of the values).
5.6 Age, sex, and body size characteristics
There was no effect of age, weight, height, weight*height, and BMI on FGCV (Table 3). For both models, men showed a significantly higher volume compared to women (estimate: -6 mL, p = 0.045 and p = 0.043, for the model with weight & height and the model with weight*height and BMI, respectively). Scatterplots of age, sex, and BMI with FGCV are shown in Figure 4, those of weight, height, and weight*height can be found in Supplementary Figure 2.

Scatterplots of fasted gastric content volume by age, sex, and body mass index (BMI). Linear mixed model analysis showed that women had lower fasted gastric content volume compared to men (∼6 mL, p < 0.05). There was no effect for age and BMI.
6 Discussion
With this analysis we aimed to establish the intra- and interindividual variation in FGCV, and to assess to what extent this variation is associated with age, sex, and body size. Our analysis, based on 366 participants, established that there is large variation in FGCV within healthy adults, with a mean of 33 mL and overall coefficient of variation of 75.6%. When corrected for age, sex, and body size, interindividual variability was 15 mL and intraindividual variability 19 mL. Age, weight, height, weight*height, and BMI were not associated with FGCV. Men were found to have a ∼6 mL higher FGCV compared to women, although clinical relevance remains to be studied.
6.1 Intra- and interindividual variability
The mean FGCV of 33 ± 25 mL is comparable to the mean volume of 25 ± 18 mL (n = 120) found by Grimm et al.15. Their volumes ranged from 1 to 96 mL, while ours ranged up until 156 mL. Although our upper limit is more than 1.5 times as high, only 1.8% of our volumes were above 100 mL (i.e., 16 out of 869) indicating that the majority of our data was within the same range as theirs. Based on our results, a normal FGCV can range from 0-138 mL. The coefficient of variation was 75.6%. Data in literature is limited, Grimm et al.15 reported values ranging from 39 to 159%, although sample size was very small (n = 6 each). Our mean intraindividual range was 24 ± 21 mL, which is much lower compared to that of Grimm et al.15 of 44 ± 18 mL but might be explained by their low sample size (n = 8 subjects), which is more susceptible to individuals with high variability.
Interindividual variation was slightly lower with 15 mL compared to the intraindividual variation of 19 mL. This indicates that FGCV is subject to day-to-day and within-day variation and cannot be seen as a stable personal characteristic. Part of the variation might be explained by the MMC cycle. Studies have shown that the MMC causes temporal variations in gastric secretion. The different phases of the MMC cycle are associated with increases and decreases in secretion rate13 with differences up to 78%56. Therefore, the variability in both intra- and interindividual FGCV might partly be explained by the phase of the MMC cycle at the time of measurement. However, a review of van den Abeele et al.13 found that MMC cycle durations varied between 96 and 172 minutes and Parkman et al.57 found that only 1 in 3 individuals had antral contractions during a 60-minute period. Moreover, Kellow et al.58 reported that while MMC cycles occurred every 1-2 hours, only 1 in 3 originated in the stomach. Goetze et al.59 used MRI to repeatedly measure FGCV over 90 minutes but found no changes over this period (n = 12, average slope: 0.0018 mL min-1, p > 0.05)59. In addition to gastric secretion rates, the peristaltic, phasic contractions also change during the MMC cycle, resulting in an increased liquid emptying rate during phase III13. This increase in gastric secretion rate happens prior to phase III contractions, which roughly corresponds to late phase II/phase III contractions in the stomach13. This might therefore (in part) counteract the effect of the increased secretions during this phase. As gastric volume is the result of gastric secretion and emptying, this might explain why Goetze et al.59 found no difference in gastric volume over time. Altogether this indicates that more prolonged studies are needed to better capture the change in FGCV over time during the MMC cycle.
Comparison of our results with literature is difficult. Previous studies often report fasted gastric acid secretion rate as measured by gastric aspiration as opposed to gastric fluid secretion rate or gastric volume. The gastric aspirates are often taken over a period of 30-60 minutes and might therefore capture temporal fluctuations. A disadvantage is that this method might result in underestimation as some of the gastric acid might be lost due to gastric emptying. Moreover, removing the gastric juice from the stomach itself can reinforce the secretion27. This difference in assessment might account for some of the discrepancies between our findings and those in literature. One study has been identified that reported both volume and secretion rate. Goyal et al.60 collected gastric fluids over a period of 60-minute during continuous suction of gastric fluid. They found a mean volume of 63.5 mL and a gastric acid secretion rate of 2.99 mmol h-1. It is important to note that they urged the participants to spit out their saliva during collection. This is in contrast to measurements with MRI where the stomach might also contain small amounts of saliva. Saliva flow rate during fasting (6 hours) is 0.1 mL min-1, so minimal effects are expected61.
6.2 Biological variations and other factors influencing fasted gastric content volume
There was no effect of age on FGCV (-0.2 mL, p > 0.05), although it should be noted that our study population was relatively young, ranging 18-57 y with only 10 participants (2.7%) aged 44 years or older. Literature is inconclusive on the effect of age. Feldman et al.18 found no difference between young (18-34 y), middle-aged (35-64 y) and elderly (65-98 y) while Goldschmiedt et al.17 found a trend for higher FGCV in older (44-71 y) compared to younger (23-42 y) adults (5.8 vs. 3.2 mmol h-1, p = 0.05). Based on our findings, it can be concluded that within healthy, mainly young adults, age has no effect on FGCV when corrected for age, sex, and body size characteristics.
FGCV was lower for women compared to men (∼6 mL, p < 0.05), which is in agreement with previous studies that found higher fasted gastric secretion rates in men compared to women. It has been suggested that this might be due to their lower body weight or smaller stature, thus having smaller stomachs, and associated decreased parietal cell mass or due to hormonal differences19-25. Since we corrected for weight and BMI in our models, this could not have been the explanation for the difference between men and women. Novis et al.26 found that body weight was weakly correlated with fasted gastric acid secretion rate (n = 176, range: 45-105 kg, r = 0.184), however, we did not find an effect of either weight or BMI. Since it is known that the volume present in the stomach is the result of both secretion and gastric emptying and that those with a higher body weight have faster gastric emptying62, these effects might counterbalance the increase in secretion. Thus, based on our findings it can be concluded that weight, within a healthy range, does not influence FGCV.
In an attempt to correct for differences in stomach size, height and weight*height were included as a proxy for body size. No effect was found for these measures. It is, however, noteworthy that literature is inconclusive on whether stomach size is associated with weight and height. A study looking at mucosal surface area of the stomach post-mortem found that, on average, men have a 10% larger stomach size compared to women. However, variations in stomach size were not related to age, body height or weight63. In contrast, Lee et al.64 found that sex, age, height and body weight were associated with the length of the lesser curvature, and sex and weight with the length of the greater curvature. They found that men have longer stomachs compared to women, although it is noteworthy that this study was performed on stomachs removed during total gastrectomy in gastric cancer patients. Moreover, these studies included many overweight participants (>50%), raising the question whether these findings would be similar for healthy participants. Thus, although we corrected for body size by using height and weight*height, this might not have been very accurate for controlling for differences in stomach size. Whether stomach size, and associated parietal cell mass, is (partly) responsible for lower FGCV in women remains to be studied.
In addition to body size, hormones have been suggested as an explanation for sex differences in gastric acid secretion. Studies on the effect of sex hormones on gastric acid secretion are inconclusive. Goldschmiedt et al.17 did not find an effect of menstrual phase on fasted gastric acid secretion rate (n = 10). However, Sakaguchi et al.65 showed that gastric acid secretion is decreased in the premenstrual phase, showing an inverse correlation with plasma estradiol concentrations (n = 24, r = 0.629). An animal study showed that estrogen might inhibit gastric acid secretion by binding to estrogen receptors on the parietal cells in the stomach66. These findings might also explain the lower gastric acid secretion in women compared to men65,66. This effect of menstrual phase is something that has not been taken into account by all of the studies included in this analysis and might thus have contributed to the variation in fasting gastric volumes.
Gastric acid secretion is influenced by many more factors. Examples include, sex hormones, the circadian rhythm, smoking, exercise, stress levels, the use of medication, and the presence of Helicobacter pylori. Gastric acid secretion has been shown to have a distinct circadian cycle in the absence of food stimulation, with the highest secretion rate in the evening and the lowest in the morning67. Smokers have higher fasted gastric acid secretion compared to non-smokers (4.1 vs. 2.7 mmol h-1, respectively)18. Interestingly, not all studies mentioned the exclusion of smokers. Since the prevalence of smoking is higher among men68, this might have contributed to the difference we found between women and men. However, no data on the prevalence of smoking was available for the studies.
Studies on exercise and gastric acid secretion report a decrease in fasted gastric acid secretion either during exercise or during restitution69-71. Furthermore, physical stress is known to induce a 3-fold increase in fasted gastric acid secretion72. Moreover, certain medications are known to influence gastric acid secretion, such as protein pump inhibitors, antacids, and histamine, which might impact further digestion. For example, protein pump inhibitors are known to slow down the gastric emptying of solids, which is suggested to be due to impairment of intragastric peptic digestion73. Moreover, a review of Maideen74 found that long-term use of protein pump inhibitors is associated with micronutrient deficiencies (e.g. iron, B12, calcium).
Most of these factors are not expected to have influenced our results. Studies were all performed in the morning after an overnight fast, thereby minimizing the influence of the circadian rhythm and food and beverages that were consumed previously. In addition, the use of medication was either an exclusion criteria or stopped for at least the fasting period.
Moreover, it is known that a Helicobacter pylori infection can initially cause hypergastrinemia and gastric hypersecretion, while later in life it can cause gastric atrophy with impaired gastric secretion75. Since an infection is commonly asymptomatic, prevalence in Europe is around 34%76, and participants were not tested for this, this might explain some of the variance that we found.
6.3 Fasted gastric content volume and digestion
Gastric secretion is of key importance for (peptic) digestion. Naturally, the volume present in the stomach will affect digestion due to the presence of enzymes and HCl and their effect on the breakdown of nutrients, specifically proteins. Greater amounts of enzymes present and a higher concentration of HCl can both facilitate digestion in the early stages of gastric digestion. The association between FGCV and protein digestion was already shown9,10, where higher volumes were associated with earlier destabilization of emulsions, indicating increased protein hydrolysis. However, the sole effect of FGCV on digestion is difficult to establish given the many variables that are involved. Whether the difference in FGCV can be considered as clinically relevant also depends on the size of a meal: the larger the meal, the smaller the effects will likely be. Moreover, it not only depends on the initial amount of gastric juice present, but also on the increase in secretion that happens when food is ingested. This increase depends on multiple factors and can already start by the sight and smell of food, and increases further when tasting and chewing the food77. After that, the presence of the food and distention of the stomach will further stimulate gastric acid secretion. It was found that gastric secretion tends to increase with meal size. Furthermore, the constituents of food can affect the gastric acid secretion, e.g. it is known that peptides and amino acids stimulate secretion, but also alcohol78,79, calcium5, and lemon juice38
Limited literature is available on the correlation between fasting and meal-induced gastric secretion. Goyal et al.60 found no correlation between basal and histamine-stimulated peak total secretion (r = 0.345, n = 22). Moreover, they reported ratios of 4.7-45.3% between basal and histamine-stimulated maximal acid output (n = 22), with all, except one, below 35%. Other studies found ratios between 9.9 and 30.7%60. Thus, based on FGCV alone, it is difficult to predict the exact effect on digestion. This highlights the need for methods to estimate gastric acid secretion after ingestion of food. Marciani et al.80 used T2 relaxation time measurements to monitor the process of dilution by gastric secretions and mixing of viscous meals and Goetze et al.59 used fast T1 mapping techniques for the quantification of intra-gastric dilution and distribution of orally applied gadolinium-based paramagnetic contrast agents showing that there is potential for estimating gastric secretion volumes with MRI.
Moreover, it is important to question what volume can be considered as a clinically relevant difference in FGCV and will impact digestion kinetics. Recently, an in vitro digestion model was developed that considers sex differences in the gastrointestinal tract, accounting for the lower fasting and meal-stimulated gastric acid secretion rates and higher pH in women. Subsequently, they studied the breakdown of whey proteins with both the female and male digestion model and found differences in proteolysis of these proteins81. Although the model takes into account more factors than the FGCV, it does show that the differences in gastric acid secretion between women and men are of clinical relevance to our digestion. It also highlights the importance of taking into account sex differences, both in in vitro digestion studies as well as in vivo.
In addition to the digestion of food, FGCV is also a crucial parameter in drug release and absorption of oral drugs13,14. The FGCV at the time of oral drug administration influences the dissolution of the drug. Especially since drugs are usually taken with a glass of water, the fasting volume will affect the pH. For example, a low initial volume will cause a less acidic environment, resulting in better solubility for acidic drugs15. These findings on individual variability can be used to optimize in vitro and in silico models for the development of novel drugs and dosage forms15.
6.4 Conclusion
To conclude, FGCV is highly variable and should range between 0-138 mL in healthy individuals. After correction for age, sex, and body size characteristics, intraindividual variability was 19 mL compared to 15 mL for interindividual variability. This indicates that FGCV is subject to day-to-day and within-day variation and is not a stable personal characteristic. No associations were found with age, body weight and size, within healthy, relatively young individuals who mostly had a healthy weight. Men had a ∼6 mL higher FGCV compared to women, after correction for the aforementioned factors. Differences in FGCV are expected to affect both digestion and drug dissolution. Exact implications of the observed variations, including the difference between women and men, remain to be studied further. Our results highlight the importance of considering (variations in) FGCV when studying digestion.
Data Availability
All data produced in the present study are available upon reasonable request to the authors
7 Acknowledgments, authors’ contributions, funding, disclosures
The authors are grateful to all authors of the included studies.
JR, GC, PS conceptualized the study, LL collected and inputted data, JR analyzed the data and drafted the initial manuscript. GC, PS revised the manuscript. GC, PS had primary responsibility for final content. All authors critically reviewed and approved the final manuscript.
Conflict of interest: DNL has received an unrestricted educational grant from B Braun and speaker’s honoraria from Nestlé, Abbott and Corza for unrelated work. RS has received research grants from Zespri International and Sanofi and speakers fees from Ardelyx, Menarini & Ferrer. All other authors declare no conflict of interest.
Funding: No external funding was received for this study. This research was supported by the National Institute for Health Research (NIHR) Nottingham Biomedical Research Centre. The views expressed are those of the authors and not necessarily those of the NHS, the NIHR, or the Department of Health & Social Care.
Footnotes
↵† INRAE, Institut Agro, STLO, 35042 Rennes, France
↵‡ Teagasc Food Research Centre, Moorepark, Fermoy, Co Cork P61 C996, Ireland
↵§ Faculty of Health Sciences, Universiti Kebangsaan Malaysia, 50300, Kuala Lumpur, Malaysia
PubMed indexing:
Roelofs JJM (roelofsjjm{at}gmail.com)
Camps G (guido.camps{at}wur.nl)
Leenders LM (louise.leenders{at}wur.nl)
Marciani L (luca.marciani{at}nottingham.ac.uk)
Spiller RC (robin.spiller{at}nottingham.ac.uk)
van Eijnatten EJM (elisevaneijnatten{at}hotmail.com)
Alyami J (jhalyami{at}kau.edu.sa)
Deng R (ruoxuan.deng{at}agrocampus-ouest.fr)
Freitas D (daniela.freitas{at}teagasc.ie)
Grimm M (michael.grimm{at}uni-greifswald.de)
Karhunen LJ (leila.karhunen{at}uef.fi)
Krishnasamy S (shanthikrishnasamy{at}ukm.edu.my)
Le Feunteun S (steven.le-feunteun{at}inrae.fr)
Lobo DN (dileep.lobo{at}nottingham.ac.uk)
Mackie A (a.r.mackie{at}leeds.ac.uk)
Mayar M (morwarid.mayar{at}wur.nl)
Weitschies W (werner.weitschies{at}uni-greifswald.de)
Smeets PAM (paul.smeets{at}wur.nl)
DNL has received an unrestricted educational grant from B Braun and speaker’s honoraria from Nestlé, Abbott and Corza for unrelated work. RS has received research grants from Zespri International and Sanofi and speakers fees from Ardelyx, Menarini & Ferrer. All other authors declare no conflict of interest.
Twitter (X) handles: DNL: @DL08OMD Nottingham group: @UoN_GI_MRI


