
ABSTRACT
Background Indonesia, the world’s largest archipelago, faces unique challenges in distributing its health workforce across its diverse geographic barriers, leading to disparities in health worker number and distribution. By dissecting the distribution patterns and identifying areas of critical need, the research seeks to inform policy interventions that can more effectively bridge the gap on health worker quantity and inequity.
Methods We conducted a descriptive analysis of healthcare workforce data across all 514 districts in Indonesia. The study focused on five categories of health workers: General Practitioners (GPs), medical specialists, dentists, nurses, and midwives. We calculated the health worker ratio to determine the availability of healthcare workers relative to the population. To evaluate the distribution of these workers, we employed the Gini Index as a measure of distribution equality. Additionally, we conducted a comparative metric approach to assess both the quantity and the equity of healthcare worker distribution across the districts.
Results In Indonesia, the current health worker ratio stands at 3.84 per 1000 population, falling short of the WHO’s threshold of 4.45 for achieving 80% Universal Health Coverage. This shortfall translates to a need for an additional 166,000 health workers. Our analysis reveals a varied distribution of health worker categories: while midwives show a relatively equitable distribution, specialists and dentists exhibit significant inequality, especially at the district level. The Gini Index, used to measure this inequality, indicates greater disparities at the district level compared to the provincial level. There has been notable progress in the distribution of medical specialists across provinces, with the between-provinces Gini Index for specialists decreasing from 0.57 in 1993 to 0.44 in 2022. However, the inter-district Gini Index remains high at 0.53 in 2022, signifying a concentration of specialists in major cities and provincial capitals.
Conclusion This study shows that human resources for health in Indonesia suffer not only in quantity but also in distribution. Our finding underscores the importance of considering inter-province and inter-district disparities to tailor policies to tackle unique problems each region faces.
Evidence Before Study
Prior research has established that the quantity and distribution of health workers are critical factors in improving life expectancy and are fundamental components of the health system.
Following Indonesia’s constitutional changes in 2001, which included the autonomy and decentralization of healthcare services, assessing the number of health workers at the district level has gained significant importance for determining national healthcare needs.
There has been a notable gap in studies analyzing the quantity and distribution of health workers in Indonesia’s district level. Previous research often missed the nuances of district-level challenges, focusing instead on broader, national-level assessments.
What This Study Adds
First National Study on Health Workforce: This is the first study of health workforce quantity and distribution at Indonesia’s National level. so this paper serves as a basic reference for future research
Quantitative Analysis of Distribution Equity: Utilizing the Gini Index, the study quantifies the level of inequality in the distribution of healthcare workers, offering a clear metric to guide policymakers in assessing and addressing regional disparities.
Identification of Regional Variations: The study highlights significant regional variations, with some provinces showing an inequitable distribution of health workers, demonstrating a critical need for increased healthcare personnel and better distribution strategies.
Dual-dimensional assessment: The study introduces a quadrant comparative approach that simultaneously evaluates the quantity of healthcare workers and the equity of their distribution across Indonesian provinces. This dual-dimensional analysis is a significant methodological advancement, providing a more holistic understanding of healthcare workforce allocation.
How This Study Might Affect Research, Practice, and/or Policy This study has the potential to become the basis of policy-making related to the distribution of health workers and provide constructive feedback and strategical insights that could be utilized to decrease the gap between health workers and their maldistribution.
INTRODUCTION
The landscape of global health is continually evolving, marked by the dynamic interplay between healthcare needs and the availability of healthcare professionals. At the heart of this landscape is the pivotal role of health workers, whose quantity and distribution are essential for effective healthcare delivery1. The World Health Organization (WHO) since 2005 and aligned with Sustainable Development Goals (SDGs) indicators underscore this significance, particularly after adjusting the need of universal health coverage 2,3. Human resources for health, serving as the backbone of health systems, face the persistent challenge of achieving equitable distribution. With its unique geographical and demographic profile, Indonesia exemplifies this struggle, presenting a complex case for the distribution and availability of health workers.
Indonesia, the world’s largest archipelago and fourth most populous nation, with its approximately 17,000 islands, embodies these challenges in distributing its health workforce4. The country’s vast and varied geography, encompassing remote areas, borders, and small islands, complicates the equitable distribution of healthcare services5. Additionally, the decentralized migration of health workers towards urban centers exacerbates the issue, leading to a disparity in healthcare availability between urban and rural or remote regions6 .
The number of health workers is crucial in determining the effectiveness of healthcare delivery7. However, the issue extends beyond mere numbers; the distribution of these workers plays a critical role in ensuring that all regions, irrespective of their geographic or demographic characteristics, have access to adequate healthcare services. This challenge is further compounded by the issue of healthcare workforce production in Indonesia, which is not accompanied by equitable distribution 8–10. The imbalance in the distribution of health workers, particularly in a geographically diverse country like Indonesia, presents a multifaceted challenge that needs comprehensive analysis and targeted interventions 11.
The aim of this study is to provide an in-depth analysis of the current state of health workers in Indonesia, with a particular focus on both their quantity and distribution at the district level. Previous reports and research have often overlooked broader regional or national-level assessments12. This lack of detailed data has been a significant gap in understanding the true extent of the challenge faced by the Indonesian health system. By delving into the district-level dynamics of health worker distribution and quantity, this study seeks to bridge this knowledge gap and offer insights that could inform policy and practice, ultimately contributing to reducing inequities in healthcare access across Indonesia.
METHODS
We gather information from various sources, particularly formal government agencies and ministries that collect data on health resources, both published and unpublished. All the analysis needed will be done in the R using stats and the dineq package.
Definition of Administrative Unit
Indonesia’s administrative area is divided into 34 provinces and 514 districts. Districts are categorized as cities (urban areas) or regencies(rural areas), with 416 districts and 98 cities reported in 2022. Health worker data is also aggregated into five major islands: Sumatra, Java, Kalimantan, Bali-Nusa, Sulawesi, and Maluku-Papua. This approach considers that health service coverage can extend beyond district and province administrative boundaries.
Definition and Source of Health Worker Data
Health workers are general practitioners, specialists, dentists, nurses, and midwives. Health workers must have gone through higher education and professional training13,14. This study consolidates all 24 categories of specialists into a single group. General practitioners (GPs) practice both in primary and referral care, and between private and public. while specialists primarily operate within hospitals and private practices. Midwives are predominantly employed in primary care.
Number of health workers at the provincial-level data is derived from the “Annual Indonesian Health Profile Book” from 1990 to 2021. District-level data were gathered from the “Minister of Health’s Health Resources Database (SISDMK)”. We extracted SISDMK data on 31 December 2022. Data on doctors, dentists, and specialists are supplemented with Data on Members of the Indonesian Doctors Association and Doctors’ Registration Data by the Indonesian Medical Council. The Health worker ratio will represent the number of health workers per 1,000 population within a geographic unit. Population estimate data, used as the health worker ratio’s denominator, were retrieved from the Ministry of Internal Affairs’ GIS data, with the most recent estimates dated 30 June 2022.
Benchmark of Health Worker Density
The existing density of health workers will be compared with goals set by Indonesia’s Directorate of Health Workforce Planning’s Target Document, utilizing Data Envelopment Analysis (DEA) and Stochastic Frontier Analysis (SFA) for target ratio calculations (see Table 1). We will also compared to the World Health Organization (WHO) proposed threshold of health-worker ratio (including doctors, nurses, and midwives) of 4.45 per 1,000 people to meet 80% coverage of the Sustainable Development Goals (SDGs)15
Distribution Analysis
To analyze distribution, we will directly compare ratios between administrative, urban, and rural areas and use the Gini Index, as previously recommended in WHO Measuring Health Worker inequalities20 21–23. The Gini coefficient is a statistical metric obtained from the Lorenz curve, which measures the level of inequality in a distribution. It is expressed as a value between 0 (indicating perfect equality) and 1 (indicating perfect inequality). We performed inter-provincial and within-province Gini Index, which has been prevalently used in prior research 24–27. To further measure inequities between district, the inter-district Gini index will be used in this research28,29
Quadrant Analysis Framework
We made a quadrant analysis to evaluate the two facets of quantity and distribution, as depicted in Figure 1. This method involves plotting provinces on a two-dimensional plane defined by two axes: the Gini Index and the Health Worker (HW) Ratio. The quadrant framework categorizes provinces into four distinct groups based on their position relative to the median values of the Gini Index and HW Ratio. The resulting quadrants are labeled as follows:
Scarce and Inequitable Province: High Gini Index and Low HW Ratio, indicating a province with a shortage of health workers and a highly uneven distribution.
Inequitable Province: High Gini Index and High HW Ratio, suggesting a province with a sufficient number of health workers but an unequal distribution among the population.
Scarce Province: Low Gini Index and Low HW Ratio, pointing to a province with an overall scarcity of health workers but a relatively even distribution among the population.
Ideal Province: Low Gini Index and High HW Ratio, representing a province with both a high number of health workers and an equitable distribution.

A Quadrant Analysis of Gini Index vs. Health Worker Ratio
This framework is intended to identify and visualize the disparities in health worker distribution across provinces. In line with the nature of Indonesia, decentralization pushes the provincial government to achieve equal growth within the province. This approach will inform policymakers at the provincial and national levels by highlighting areas of need and guiding targeted interventions.
RESULTS
Quantity of Health Workers
Indonesia’s health workforce comprises 1,046,640, averaging 3.84 per 1,000 people nationally but varying widely across districts (0.31 to 19.08). Nurses are the largest group (531,214; 1.95 per 1,000), followed by midwives (300,756; 1.10 per 1,000), general practitioners (145,602; 0.38 per 1,000), specialists (41,893; 0.15 per 1,000), and dentists (27,177; 0.1 per 1,000). The nurse-to-doctor ratio is about 2.17 nationally.
In examining the distribution of health workers between urban and rural areas in Indonesia, clea disparities are evident across different medical professions. General Practitioners (GPs) in rural areas have a median ratio of 0.27 and an average of 0.31, contrasting sharply with urban areas, where the median ratio is substantially higher at 1.10 and the average is 1.34. The disparity is even more pronounced for dentists; in rural regions, they have a median ratio of 0.05 and an average o 0.06, whereas in urban areas, these figures significantly increase to a median of 0.20 and an average of 0.27. Specialists present a similar pattern of distribution. In rural areas, the median ratio for specialists is 0.06 with an average of 0.08, which is markedly lower than in urban areas, where the median ratio rises to 0.35 and the average to 0.42.
Rural areas have median ratios of 0.87 for midwives and 1.26 for nurses, which are substantially lower compared to urban areas, where the median ratios are 0.86 for midwives and a significantly higher 3.18 for nurses. Overall, this data underscores a consistent trend of higher health worker For most healthcare worker categories, the distribution is right-skewed, meaning that most rural and urban areas have lower ratios of healthcare workers, with a few areas having much higher ratios. The kurtosis values suggest that these distributions are leptokurtic, with a higher peak and heavier tails than a normal distribution, particularly for GPs and dentists in rural areas and for urban nurses.
Island and Provincial Levels Distribution
Table 3 shows the distribution of health worker ratios across Indonesian islands and provinces. The data reveals several disparities, with Java having the lowest health worker ratio (3.06 per 1,000 population) and Sulawesi the highest (5.04 per 1,000 population). Each island presents a distinct health worker composition; notably, Bali Nusa Tenggara and Java have the highest GP ratios at 0.45 and 0.38, respectively. Java leads in specialist and dentist ratios (0.17 and 0.1) but has the lowest ratios for nurses and midwives (1.69 and 0.72), suggesting an imbalance in healthcare worker distribution.
Provincially, Aceh has the highest health worker ratio (7.68), followed by DKI Jakarta (6.23). The lowest ratios are in West Java (2.44), Banten (2.69), and Central Java (2.83). Bali’s GP ratio (0.98) is close to the WHO-recommended physician ratio, and DKI Jakarta has the highest specialist ratio (0.63). These figures indicate uneven healthcare resource allocation, with certain areas having a high concentration of healthcare professionals and others facing severe shortages.

This set of density plots compares the distribution of health worker ratios across different Indonesian regions, distinguishing between city and district types. Peaks represent the most common ratios within each region, with red lines indicating city densities and blue lines for districts. The plots reveal variations in distribution patterns, with some regions showing distinct differences between city and district densities, potentially indicating disparities in health worker allocation.
The density plot at figure 2 presents a comparative analysis of health worker (HW) ratios across different islands and regions in Indonesia, categorized by city and district types. In Bali and Nusa, the HW ratio distribution for cities and districts demonstrates a bimodal pattern, indicating two distinct groupings of HW ratios within each category. Java’s distribution exhibits a stark peak for cities at a lower HW ratio, suggesting a uniformity in lower ratios among cities, in contrast to districts that show a broader, more varied distribution.
Kalimantan’s data suggests a single, similar peak for both cities and districts, with cities having a marginally higher peak, implying a slight concentration of HW ratios within city areas. Meanwhile, Maluku & Papua reveal a significant contrast between cities and districts; cities have a flatter, more varied HW ratio distribution, whereas districts show a distinct, narrow peak at higher ratios. Sulawesi’s density plot indicates a single peak for both city and district types, with the city peak being more pronounced, pointing towards a more consistent HW ratio among Sulawesi cities.
Sumatera’s analysis reveals a higher peak for districts compared to cities, suggesting a trend towards higher HW ratios within district areas. Overall, the graph indicates significant regional variability in HW ratios, with certain trends such as the bimodal distribution in Bali & Nusa and the contrasting distributions in Maluku & Papua standing out.
The ratios are calculated per 1,000 population.
District-Level Distribution
Figure 3 shows a distinct change in the mapping of health workers between the provincial-level aggregate ratio(1a) and district-level aggregate ratio(1b), especially in Java Island. Health workers are concentrated in cities (small areas with a high ratio of health workers), and lack of health workers in more rural areas in Java. Despite having the largest number of healthcare workers, by comparing the number to their population, the ratio in most districts in Java remained below Indonesia and WHO-recommended density (Figure 4).

This map pair illustrates the health worker (HW) ratio across Indonesia’s provinces (1a) and districts (1b). Darker shades of blue indicate higher HW ratios, with the scale ranging from 0 to 4. The provincial-level map shows broader trends, while the district-level map provides a more granified perspective, revealing significant variations within provinces.

The scatter plot displays the relationship between the logarithm of the population size and the health worker ratio for various Indonesian regions. Each point represents a region, with the WHO-recommended ratio as a reference line. The plot highlights disparities in health worker distribution relative to population, with some regions significantly above or below the WHO benchmark.
The Figure 4 scatter plot displays a wide variance in health worker-to-population ratios. The graph indicates that most regions have health worker ratios below the density target except for a few districts that are also the province’s capital. Several regions, particularly in Papua, such as Yahukimo, are identified as lower outliers with a deficiency in health worker density.
Districts with a larger population tend to have fewer health workers. A logarithmic trend line fitted to the data demonstrates a decremental trend, suggesting that regions with larger populations tend to have a lower health-worker ratio. The Logarithmic trend line equation quantifies the relationship between the population size and the health worker ratio, Health Worker Ratio = - 1.2749*ln(Population) + 19.004. The coefficient of determination, R-squared (0.215958). Moreover, the distribution of health worker ratios exhibits right-skewness. This skewness indicates that while most regions are understaffed, a few are exceptionally well-staffed.
Inequity in Distribution
The Gini Index has demonstrated variable trends over the past three decades, as depicted in Figure 4 and Table 4. For General Practitioners (GPs), the provincial Gini Index increased from 0.35 in 1992 to a peak of 0.49 in 2003 before declining to 0.39 in 2012 and rising again to 0.42 in 2022. This fluctuation suggests changes in the equality of GP distribution over time. Dentists and nurses also experienced an increase in provincial inequality, with their Gini Indexes rising to 0.49 and 0.40, respectively, in 2022. Midwives, however, showed an improvement in equality from 1992 to 2022, with the Gini Index decreasing from 0.38 to 0.35.
This table presents the Gini Index scores for different health worker categories, measuring the inequality in their distribution across provinces from 1992 to 2022 and at the district level in 2022. Data Unavailability is marked as ’…’
Disparities at the district level, recorded for 2022, reveal a more pronounced inequality for health workers than at the provincial level. GPs saw their district-level Gini Index escalate to 0.46, dentists to 0.52, and specialists to the highest at 0.53. In contrast, Nurses and midwives exhibited a reduced inequality at the district level, with a Gini Index of 0.33 and 0.31, respectively, signifying a more between-province inequality rather than relatively equal distribution across districts.

The graph comprises two panels: the left shows the Gini Index for different health worker over 30 years, indicating inequality levels within each sector. The right panel’s Lorenz Curves visualize the actual distribution equity for these professions Each color represents a distinct healthcare role, ensuring consistency across both visual analyses.
Supported by the Lorenz curves, it suggests that the bottom percentage of districts have significantly fewer health workers than would be expected in an equal distribution, especially for GPs, specialists, and dentists. The middle of the distribution for these categories also shows a considerable gap from the line of equality, indicating that the Gini index’s sensitivity to the middle distribution reflects the reality of the distribution of health workers. The top district(s) seem to have a disproportionately high number of health workers, especially specialists and dentists, as indicated by the curves’ steep rise as they approach 100%.
Scarcity and Inqeuity
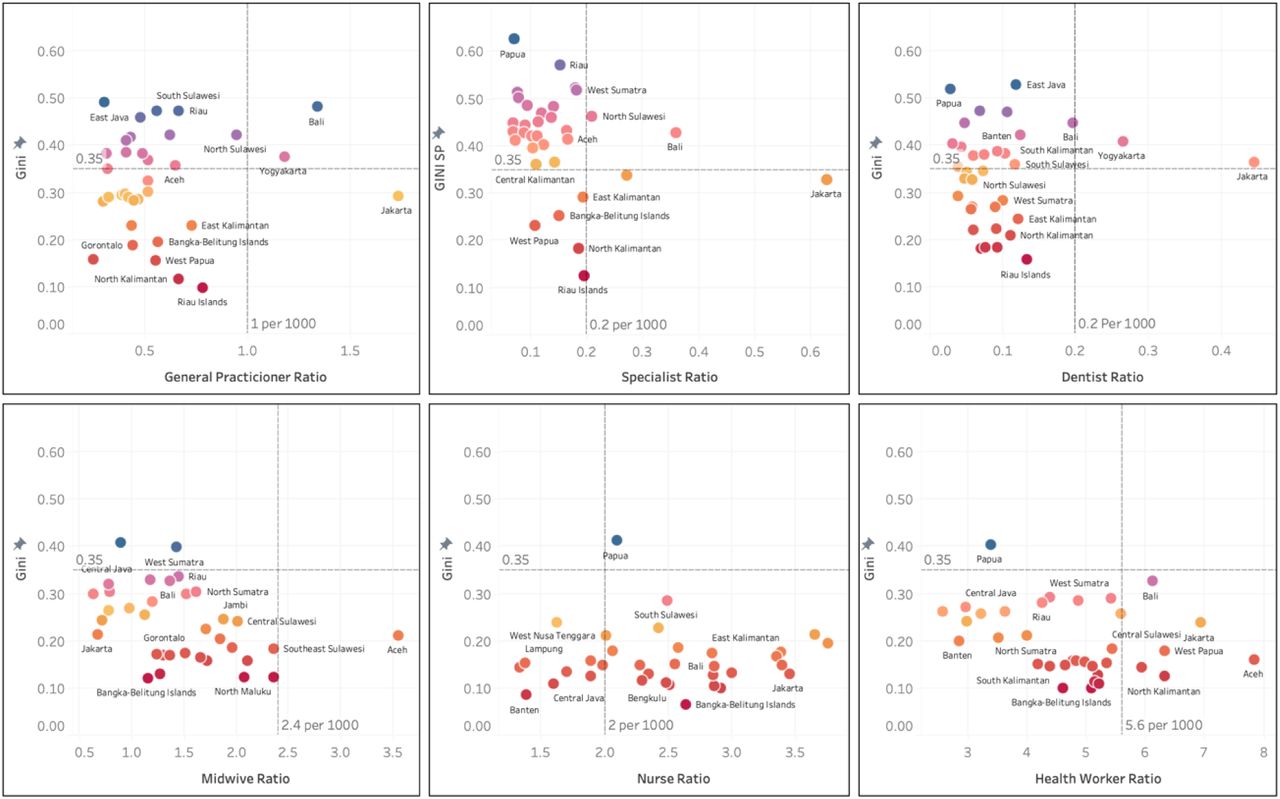
Figure 6 offers a visual evaluation of health worker distribution across Indonesian regions. The y-axis is the Gini Index to assess equity in distribution against the x-axis as health worker ratios for various categories, including general practitioners, specialists, dentists, midwives, and nurses.
The health worker scatterplot illustrates a widespread distribution across the provinces, with a noticeable lean towards lower ratios, which suggests a general scarcity of health workers in many areas. North Sumatra, in particular, registers a high Gini Index coupled with a low health-worker ratio, underscoring an urgent need for redistribution and an increase in the health workforce.
The scatterplots for physicians, specialists, and dentists display a similar pattern, with most provinces failing to meet minimum health worker targets. With exceptions such as Jakarta, Yogyakarta, and Bali that exceed these targets. With its five districts and a substantial physician population, Jakarta is uniquely situated in the bottom-right quadrant, highlighting an oversupply of physicians compared to other regions clustered to the left. Specialists are predominantly located in the upper-left quadrant, indicating a skewed distribution that favors urban centers or provincial capitals and suggests a concentration of specialists in fewer, more developed areas. With Nurses exhibit the most equitable distribution, with only Papua showing significant disparities. However, the range between the highest and lowest ratios remains considerable, from 1.2 to 3.6 pe 1,000. The Midwives ratio plot identifies Aceh as the only province exceeding the equity threshold. Conversely, Jakarta, typically lower-right in other health worker categories, deviates in the case o Midwive, showing a surprisingly low ratio and positioning it towards the left quadrant.

(Each scatter plot represents a different category of health workers, with the Gini index on the vertical axis and the respective health worker ratio on the horizontal axis. Do represents a province, with blue shades indicating regions with a higher Gini of health. The dashed line for Gini referenced 0.35 Gini Ratio, the target for equality. Dashed line for Ratio referenced to national Target for each health worker)
DISCUSSION
Quantity of Health Workers
Indonesia’s archipelagic geography, with its varied terrain and areas isolated by mountains and oceans, adds to the distribution challenges. Among its 80,000 villages, over 20,000 face geographical difficulties that obstruct access to healthcare. As of 2022, Indonesia’s health-worker ratio is 3.84. The threshold set by WHO to achieve 80% Universal Health Coverage is 4.45— requiring an additional 166,000 health workers to surpass the 4.45 threshold.30 Indonesia’s lack o active GPs and Specialists requires attention (0.64 physicians per 1,000 population). Low compared to other LMIC Nations such as India (0.73 per 1000), China (2.4 doctors per 1,000), and othe ASEAN Countries (Singapore (2.29), the Philippines (0.6), and Malaysia (1.54).) 31. Indonesia mus add up to 100,000 physicians to meet the threshold.17–20
Decomposition of Inequity
Contrary to the general perception of Java being saturated with health workers. By numbers, Java has the most healthcare workers, but Java has the lesser density of total health workers, mainly caused by the low number of nurses and midwives. Java is the only island with a midwives ratio lower than 1 and a nurse ratio lower than 2 per 1000 population. However, Java is also the island with the highest ratio of specialists (0.17), while Maluku and Papua had a ratio lower than half of Java’s (0.8).
Most islands have nearly reached the WHO threshold, with only Java (3.52) and Sumatra (4.42) still below it. However, the high population on these islands significantly affects the national average of health workers. None of the islands have yet met the Indonesian Government’s threshold of 5.8 health workers per 1000 population, with Sulawesi coming closest at 5.2.
The key issue lies in the composition of health workers. Java faces a shortage of nurses and midwives despite having a relatively high number of doctors, though still below the threshold. In contrast, islands outside of Java have a relative abundance of nurses and midwives but a scarcity of doctors.32 This imbalance in the distribution of health workers can be addressed through aggressive policy measures and enhanced nurse education, as demonstrated by China’s experience. In China, around 2003, the ratio of nurses to physicians was quite low. However, recent data indicates a significant improvement, with the ratio rising from 1 nurse per 1000 population in 2003 to 4.1 nurses per 1000 population in 2018.33
There is a profound disparity between urban and rural areas. Up to 50% of the total GP was in the City, despite the city population being only 20% of the total Population. That’s also happening in India, where Out of all qualified workers, 77.4% were located in urban areas, even though the urban population is only 31% of the country’s total population. Cities exhibit higher mean ratios across all healthcare workforce categories. Like other low- and lower-middle-income nations, the city tends to have a more significant health worker density.23,34–42 While still skewed, the midwife and nurse ratios are less severe.43 This finding is consistent with other research that found an uneven distribution of the total health workforce between rural and urban areas.44–46
Inequity Indicator
The overall trend indicates that while some health worker categories, like midwives, have achieved an equal distribution, others, particularly specialists and dentists, face higher levels of inequality, especially considering the district level. This discrepancy is highlighted by the Gini Index differences between the provincial and district levels, with an apparent increase in inequality at the finer scale of districts for most health worker categories.
There has been some progress in equalizing the distribution of medical specialists across provinces. The between-provinces Gini Index For Specialists remarkably dropped from 0.57 in 1993 to 0.44 in 2022. However, the Inter-district Gini Index is very high at 0.53 in 2022. This implies that specialists are still saturated in the preferable district, huge cities, and the province’s capital.34,47,48 Measuring only the between-province Gini Index will mask the disparities within provinces and interdistricts.
Comparative studies from western China, a less affluent region compared to the eastern and southern parts of the country, exhibit similar inequality trends. The Physician Gini Index here stands at 0.46. The World Health Organization’s last published data from 2010 shows relatively more minor interdistrict disparities in China, with a Gini Index of 0.362 for doctors and 0.471 for nurses. In India, these figures are 0.436 for doctors and 0.527 for nurses49,50. The situation in Indonesia contrasts with both China and India, as it exhibits a higher Gini Index for general physicians and specialists than nurses.
Two Faces of Health Worker Problem in Indonesia: Inequity and Scarcity
The quadrant analysis provides a multidimensional view of healthcare workforce distribution across regions. It highlights the areas of need and the complexity of issues like scarcity and inequality that often overlap, making it difficult to discern the underlying causes and appropriate interventions.
The upper-right quadrant has a high ratio of health workers, but resources are not evenly spread across the province. Bali serves as an illustrative case within this analysis. For instance, urban centers like Denpasar City might be well-staffed, while more remote areas suffer from a dearth of healthcare professionals. Addressing this imbalance requires policies incentivizing healthcare workers to relocate to underserved areas or increasing the training and recruitment of health workers specifically for these regions.
The upper-left quadrant represents a more critical scenario, as seen with East Java and Papua regions. The inequality in their distribution worsens the simultaneously general scarcity of health workers. Such provinces struggle with redistribution because the overall number of health workers is too low to meet even the minimum needs. To mitigate this, a two-pronged approach is essential: boosting the healthcare workforce numbers through training and recruitment and ensuring retention in underserved areas, perhaps through enhanced benefits, better working conditions, or other incentives.
From these findings, we can assume that Indonesia faces a challenge in evenly distributing healthcare professionals, with rural areas experiencing more pronounced shortages. To date, health equity hasn’t been prioritized as a main criterion for evaluating the success of health programs.51 Policy interventions to incentivize healthcare professionals to work in underserved areas, scaling up healthcare infrastructure35 and education programs to meet the demand in regions with lower healthcare workforce ratios.32,52,53
WHO emphasizes the necessity of district-level reporting of health worker data. While provincial-level data offers a general overview, it often fails to represent the situation at the district level. High-level aggregated data can obscure crucial specifics about the distribution and availability of health workers at the subregional level51. The strain from a lack of healthcare workers was apparent during the COVID-19 pandemic. Healthcare services almost collapsed during the pandemic peak. Any decrease in healthcare workers led to longer working hours for the remaining staff. This created a domino effect of increasing health workers’ loads54. In maternity care, World Bank statistics reveal that maternal mortality rates in Indonesia have persistently remained relatively high from 2017 to 2021 compared to other Southeast Asian countries. A shortage of healthcare professionals is one critical factor influencing the heightened maternal mortality rate in Indonesia55,56. NCD demands a workforce for every step, especially preventive care 57. Hypertension in Indonesia increased from 25.8% of the population in 2013 to 34.1% in 2018. Notably, many hypertension cases remain asymptomatic, leading to a high prevalence of undiagnosed.
Limitation
During data collection, we found notable discrepancies between the numbers and distribution of General Physicians and Specialists as reported by the medical association, Medical Council, and Ministry of Health. These inconsistencies likely stem from the council’s reliance on correspondence addresses rather than the actual practice locations of medical doctors. Ministry of Health data is much more focused on public health center workers. We acknowledge limitations in the IDI data, primarily due to a five-year delay from a patient’s death to the data’s release.
CONCLUSIONS
The imbalance in the distribution of health workers in Indonesia is a burden for this country. Government policy factors, security, economic conditions, individual characteristics, income access to children’s education, knowledge development, and areas with a better socioeconomic scope will be more attractive to health workers, especially specialist doctors.
The health workforce improvement agenda must focus on both increasing the number of health worker and distribute it equally to all people. Central government play a huge role in improving health worker production and distribution to area needed, and Local governments play a vital role in healthcare worker retention. Tailor strategies to local contexts, improve working conditions, offer professional development, and create supportive environments. Engage communities to foster belonging, boosting job satisfaction and retention.
Data Availability
Data is available by requesting an application through email to the corresponding author.
DECLARATION
Ethics approval an consent to participate
Not applicable
Availability of data and materials
Data is available by requesting an application through email to the corresponding author.
Competiting interests
All authors and contributors to the study stated that they had no conflict of interest.
Funding
The study was conducted with Research Grant from General Directorate of Higher Education, Ministry of Education and Culture of Indonesia (DIPA-023.17.1.690523/2023).
Authors’ contributions
Conceptualization: Farizal Rizky Muharram, Achmad Chusnu Romdhoni
Formal analysis: Farizal Rizky Muharram, Sudhir Anand, Hanif Ardiansyah Sulistya, Fikri Febrian Firmansyah, Julian Benedict Swannjo
Methodology: Farizal Rizky Muharram, Hanif Ardiansyah Sulistya, Fikri Febrian Firmansyah, Julian Benedict Swannjo, Muhammad Masrur Rizal
Project administration: Alifina Izza, Muhammad Atoillah Isfandiari, Ninuk Dwi Ariningtyas
Resources: Farizal Rizky Muharram, Hanif Ardiansyah Sulistya, Fikri Febrian Firmansyah, Julian Benedict Swannjo, Muhammad Masrur Rizal, Alifina Izza
Supervision: Achmad Chusnu Romdhoni, Muhammad Atoillah Isfandiari, Ninuk Dwi Ariningtyas
Writing – original draft: Farizal Rizky Muharram, Hanif Ardiansyah Sulistya, Julian Benedict Swannjo, Muhammad Masrur Rizal, Alifina Izza
Writing – review & editing: Farizal Rizky Muharram, Sudhir Anand, Hanif Ardiansyah Sulistya, Julian Benedict Swannjo, Alifina Izza, Muhammad Atoillah Isfandiari, Ninuk Dwi Ariningtyas
Acknowledgments
ABBREVIATION
- HRH
- Human Research for Health
- HW
- Health Worker
- NHS
- National Health Services
- GP
- General Practitioner
- UHC
- Universal Health Coverage


