
Abstract
Attention-deficit/hyperactivity disorder (ADHD) is a heritable neurodevelopmental disorder for which genetic factors explain up to 75% of the variance. In this study, we performed a genome-wide association meta-analysis (GWAMA) of ADHD symptom measures, with an effective sample size of 120,092 (71,733 unique individuals from 28 population-based cohorts, with 288,887 quantitative ADHD symptom measures). Next, we meta-analyzed the results with a genome-wide association study (GWAS) of ADHD diagnosis. The GWAMA of ADHD symptoms returned no genome-wide significant variants. However, we estimated strong genetic correlations between our study of quantitative ADHD symptoms and the earlier study of ADHD diagnosis (rg= 1.00, SE= 0.06). Moderate negative genetic correlations (rg< -0.40) were observed with several cognitive traits. Genetic correlations between ADHD and aggressive behavior and antisocial behavior were around 1. This provides further evidence of the wide pleiotropic effects of genetic variants and the role that genetic variants play in the co-occurrence with (mental) health traits. The GWAMAs of ADHD symptoms and diagnosis identified 2,039 genome-wide significant variants, representing 39 independent loci, of which 17 were new. Using a novel fine-mapping and functional annotation method, we identified 22 potential effector genes which implicate several new potential biological processes and pathways that may play a role in ADHD. Our findings support the notion that clinical ADHD is at the extreme end of a continuous liability that is indexed by ADHD symptoms. We show that including ADHD symptom counts in large-scale GWAS can be useful to identify novel genes implicated in ADHD and related symptoms.
Introduction
Attention-deficit/hyperactivity disorder (ADHD) is, for many individuals, a persistent neurodevelopmental disorder (Faraone et al., 2006; Kan et al., 2013). ADHD is characterized by three core symptoms: hyperactivity, impulsivity, and inattention (American Psychiatric Association, 2013). It affects around 5% of children and adolescents and 2.5% of adults worldwide (Faraone et al., 2015). ADHD may be associated with serious consequences for affected individuals, their families, and society at large, with symptoms persisting across multiple settings, i.e. at home, at school, and elsewhere (Caci et al., 2014, 2015). The disorder has a predominantly genetic aetiology, involving both common and rare genetic variants (Faraone et al., 2024). The mean estimated heritability across 37 twin studies of ADHD was 74% (Faraone & Larsson, 2019; Kan et al., 2014; Merwood et al., 2013), with some differences in heritability across ages and raters (Kan et al., 2014; Merwood et al., 2013).
In 2019, a genome-wide association meta-analysis (GWAMA) of clinical ADHD, hereafter referred to as ADHDDIAG2019, including data from 20,183 cases and 35,191 controls, identified the first 12 genome-wide significant loci associated with ADHD (Demontis et al., 2019). The study reported that 22% of the variance in ADHD could be explained by all measured single nucleotide polymorphisms (SNPs). They also performed meta-analyses with deCode, 23andMe, and EAGLE (Middeldorp et al., 2016). Four independent loci reached the genome-wide significance threshold (p< 5×10⁻⁸) in all three meta-analyses. Interestingly, most independent significant loci, 15, were found in the meta-analysis with a quantitative assessment of attention problems in EAGLE, suggesting that quantitative assessments of ADHD can boost the power to identify implicated genetic variants. Ten independent significant loci were found in meta-analyses with deCode and 23andMe data. In 2023, Demontis and colleagues presented results from their updated GWAS meta-analysis of ADHD (ADHDDIAG), combining newly extended data from iPSYCH, deCode, and the PGC, almost doubling the number of cases compared with ADHDDIAG2019 (Demontis et al., 2023). The definition of cases was broader, for example by including individuals who used ADHD prescription medication. The study reported 27 independent significant loci and estimated that 14% of the variance in ADHD could be attributed to the included SNPs. The broader definition of ADHD diagnosis resulted in a larger sample and, therefore, more power to detect implicated genetic variants. However, this broader definition also increased the heterogeneity of the phenotype, which may explain the decrease in SNP-heritability (Wang et al., 2023).
There is increasing interest and recognition that ADHD symptom counts in non-clinical samples can tap into the same genetic construct as clinically diagnosed ADHD, supporting the notion that ‘clinical ADHD’ is at the extreme end of a continuous measure of ADHD symptoms (Larsson et al., 2012; Levy et al., 1997). This was initially suggested based on multivariate twin studies (Derks et al., 2008). Additionally, the genetic correlation (rg) between quantitative ADHD symptom counts (Middeldorp et al., 2016) and ADHDDIAG2019 (Demontis et al., 2019) was estimated to be 0.97 (SE= 0.21, p= 2.66 x 10⁻⁶), suggesting that combining these measures is a viable strategy to increase statistical power in ADHD GWASs. This was additionally supported by the increased number of genome-wide significant loci in the meta-analysis of ADHDDIAG2019 and EAGLE, as compared to ADHDDIAG2019 alone, and to meta-analyses of ADHDDIAG2019, deCode and 23andMe.
In this study, we combine information from 28 population-based cohorts in a GWAMA of continuous ADHD symptom scores, leading to a total of 71,733 participants. The measures include repeated assessments (longitudinal data) by multiple raters (maternal, paternal, teachers, and self-assessments) and instruments across ages (range: 2-18 years), for a total of 288,887 measures. We also include retrospective self-report data. We meta-analyze all available data into a cross-rater/cross-age/cross-instrument GWAMA of ADHD symptoms (ADHDsymp), taking into consideration the dependency between multiple assessments within individuals (Ip et al., 2021). Using measures from multiple raters and ages may further increase the power of the analyses due to an increase in the validity of the ADHD symptom measures. Next, we estimate the genetic correlations (rg) between ADHDSYMP and the meta-analysis of case-control samples (Demontis et al., 2023), and meta-analyze ADHDSYMP with ADHDDIAG (ADHDoverall). Finally, we performed fine mapping and gene-based tests based on ADHDSYMP and ADHDoverall, performed several follow-up enrichment and pathway analyses, and estimated genetic correlations between the GWAMA and a set of predefined outcomes from cognitive and externalizing behaviour domains.
Results
ADHDSYMP GWAMA
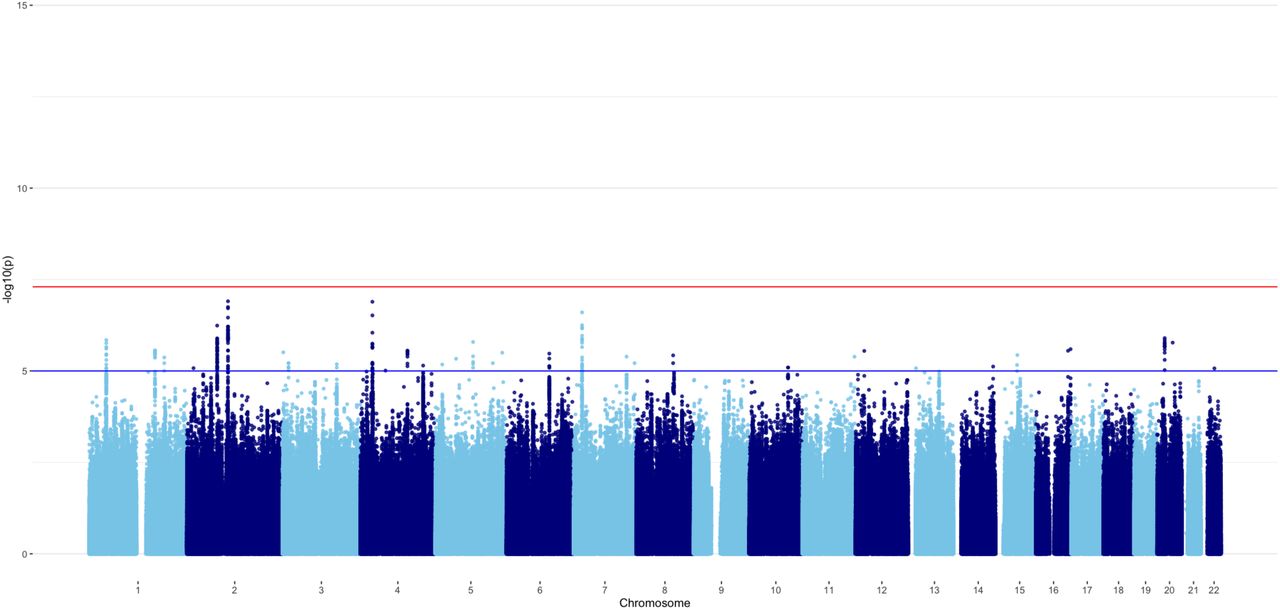
We first meta-analyzed the effect of each SNP across all available univariate GWAS of quantitative ADHD measures. Based on an effective sample size of 120,092, the estimated  of ADHDSYMP was 0.04 (SE= 0.01; Z= 8.12). The mean χ2 statistic was 1.09 along with an LDSC-intercept of 1.01 (SE= 0.01), indicating that there was no or very limited inflation in test statistics due to confounding biases such as population stratification. Rather, the GWAMA most likely captured the polygenic nature of childhood ADHD symptoms. The GWAMA of ADHD symptoms did not result in any genome-wide significant SNPs (Figure 1, Supplements Table 11).

Meta-analysis with ADHD diagnosis GWAS
SNP-heritability estimated with genomicSEM was 0.13 (SE= 0.01) for ADHDDIAG. The estimated genetic correlation between ADHDSYMP and ADHDDIAG was 1.00 (SE= 0.06). The CTI was not significantly different from zero and were subsequently constrained to zero in the following meta-analysis.
Because the point estimate of the genetic correlation between ADHDSYMP and ADHDDIAG was not significantly different from 1, we constrained the genetic correlation at unity when pre-adjusting the weights and Z-scores for the meta-analysis of ADHDSYMP and ADHDDIAG. A total of 6,571,852 SNPs were included in the meta-analysis. The SNP-heritability of ADHDoverall was 0.11 (SE= 0.01), with a mean χ2 statistic of 1.52. The LDSC-intercept and ratio were 1.02 (SE= 0.01) and 0.03 (SE= 0.02), respectively, indicating that approximately 3% of the signal might be due to confounding factors. A Manhattan plot of ADHDoverall is shown in Figure 2. 2,039 SNPs reached genome-wide significance (p< 5 x 10⁻⁸), of which 644 were also reported in ADHDDIAG and 1,395 were new. The 2,039 SNPs corresponded to 43 independent lead SNPs in 39 independent significant loci, identified with FUMA. Of these 39 loci, 22 were also reported in ADHDDIAG and 17 were new. See also Figure 2 and Supplements Tables 12 and 13.

Note: orange dots reflect lead SNPs.
Follow-up analyses
Fine mapping & gene-based tests
Gene mapping in FUMA mapped the 43 lead SNPS in 39 independent genomic risk loci to 204 associated genes (See Supplements Table 14), of which 45 were also reported by Demontis et al (2023). Second, gene-based tests were run in MAGMA (de Leeuw et al., 2015), identifying 64 associated genes (see Supplements Table 15), of which 17 were previously reported by Demontis et al. (2023). Third, we ran FLAMES (Schipper et al., 2023), with the aim to get a better understanding of the genes that are causally involved in ADHD. A total of 22 genes had FLAMES scores larger than 0.05, and were interpreted as potential effector genes (see Supplements Table 16). Fourteen of these effector genes were also tagged by the MAGMA gene-based test. Ten of these potential effector genes were previously reported by Demontis et al. (2023). Four genes were not reported by Demontis et al. (2023) but have previously been linked to ADHD, as listed by GWAS Catalog. Eight potential effector genes were not reported by Demontis et al. (2023) or by any ADHD specific studies listed on GWAS Catalog: EMCN, STK32C, PCDH17, TCF12, PEAK1, IGF1R, CTNNA2, and ABCA12.
Enrichment & tissue specific expression
Gene-set analysis in MAGMA revealed no significant enrichment in any MSigDB v2023 gene-sets after correction for multiple testing. MAGMA expression analysis showed significant enrichment of the GWAMA signal in gene-sets differentially expressed in late infancy. Additionally, there was significant enrichment in several brain tissue types, as well as in the pituitary gland (See Supplements Figures 1 and 2).
Next, FUMA GENE2FUNC gene-set enrichment analyses of the 204 potential ADHD risk genes mapped by FUMA showed significant enrichment in genes identified in GWAS of ADHD, cognition-related phenotypes, and risk-taking behaviors. The genes were not significantly enriched in any tissue types, or in any of the Brainspan developmental stages of brain samples. Genes were enriched in 29 gene sets that code for transcription factor targets. Zero synpase cellular component terms or biological processes were significantly enriched at 1% FDR (testing terms with at least three matching input genes in SynGO). For a complete overview of all enrichment results and the included gene sets, see Supplemental Figures 3-5, and Supplemental Notes.
We repeated the same analyses for the 22 potential effector genes identified by FLAMES. Again, genes were highly enriched for genes identified in GWAS of cognition-related phenotypes, and risk-taking behaviors. The 22 genes were significantly overrepresented in gene sets that are differentially expressed in the frontal cortex, but not in the “general tissue” type brain, or in any of the Brainspan developmental stages. Genes were also enriched in 52 gene sets that code for transcription factor targets, 13 microRNA targets, 4 gene ontology biological processes, 1 canonical pathway, and 8 cell type signatures. Zero synpase cellular component terms or biological processes were significantly enriched at 1% FDR (testing terms with at least three matching input genes in SynGO). Nine genes were mapped to SynGO annotations, eight to cellular components and 9 to biological processes. Genes were enriched in integral components of the postsynaptic density membrane (q= 1.46 × 10⁻³), postsynaptic density (q= 1.57 × 10⁻³), postsynapse (q= 5.67 × 10⁻³), and synapse (q= 7.22 × 10⁻³), as well as in postsynaptic modulation of chemical synaptic transmission (q= 3.28 × 10⁻⁵), process in the synapse (q= 3.97 × 10⁻⁴), and synapse organization (q= 1.62 × 10⁻³). For a complete overview of all enrichment results and the included gene sets, see Supplemental Figures 6-12, Supplementary Tables 17 and 18, and Supplemental Notes.
Genetic correlations
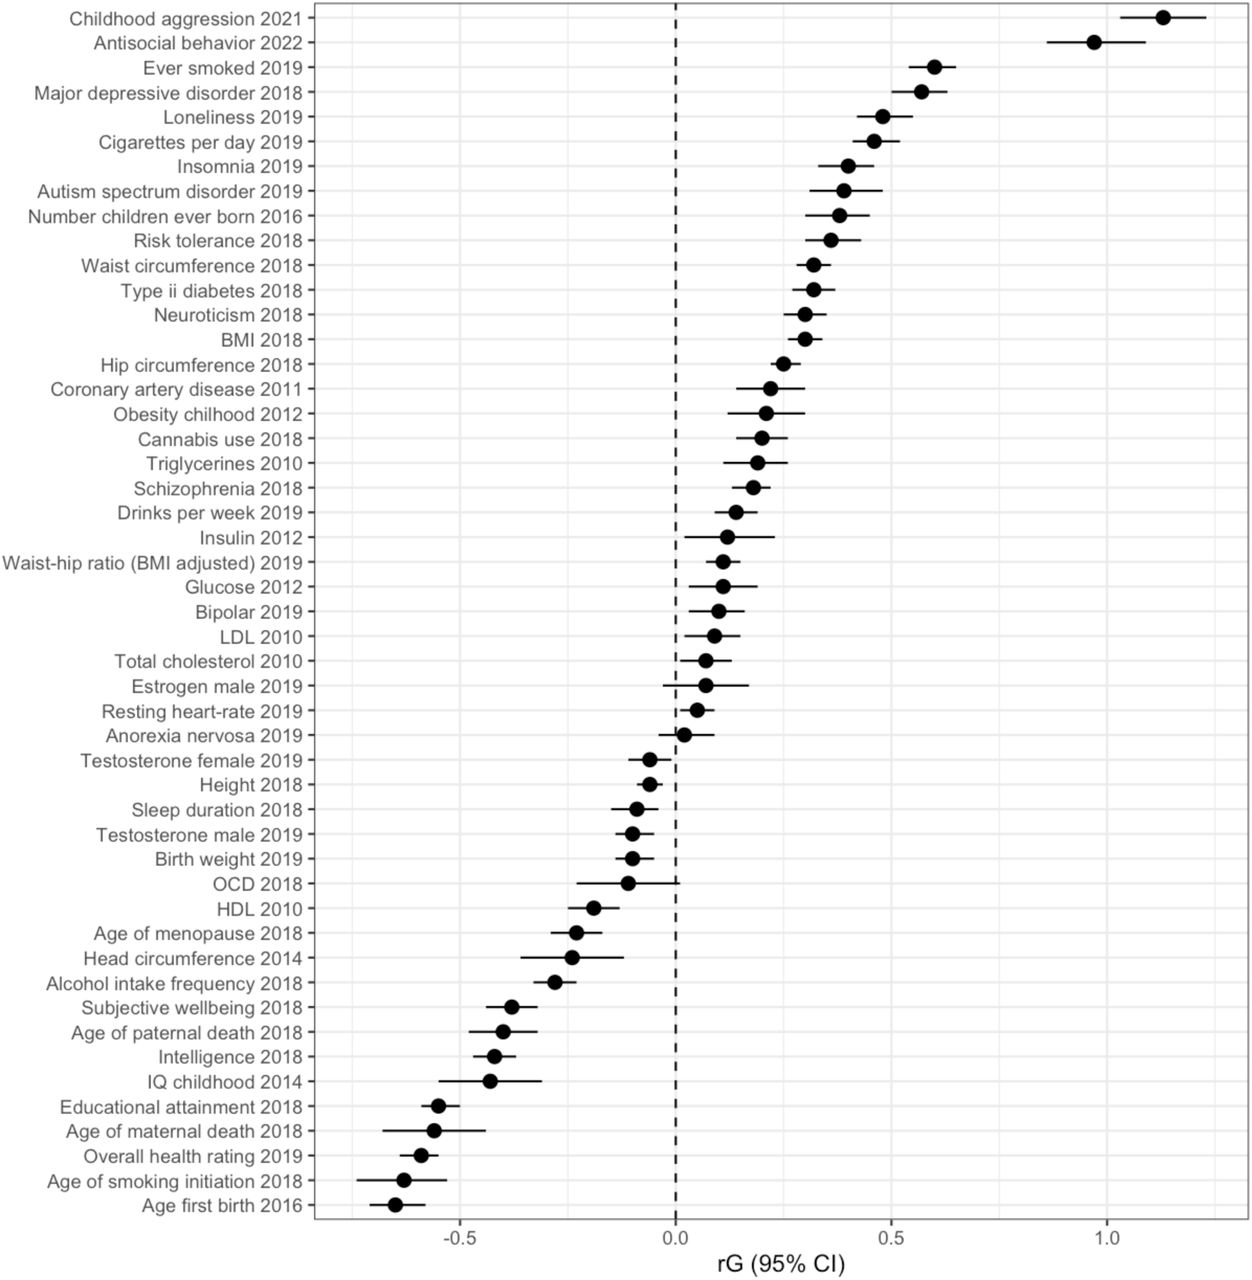
We estimated genetic correlations between ADHDoverall and 49 external phenotypes. Results are shown in Figure 4 and Supplementary Table 18. Strong positive genetic correlations were observed between ADHDoverall and childhood aggressive behavior (rg= 1.13, SE= 0.05) and antisocial behavior (rg= 0.97, SE= 0.06). The correlation of 1.13 with childhood aggressive behavior reflects a high genetic correlation that is likely greater than 1 due to sampling variation, correlations estimated by LD score regression in genomicSEM are not bounded between -1 and 1 (Childhood aggression h2 Z= 9.03). Measures of smoking habits (rg= 0.46-0.6, SE= 0.03) and number of children (rg= 0.38, SE= 0.04) also showed moderate correlations, as did ratings of overall health (rg= -0.59, SE= 0.03), educational attainment (rg= -0.55, SE= 0.02), and childhood IQ (rg= -0.43, SE= 0.06). In general, ADHDoverall showed weak to moderate genetic correlations with psychopathologies, including Major Depressive Disorder (rg= 0.57, SE= 0.03) and Autism Spectrum Disorder (rg= 0.39, SE= 0.04). Weak negative genetic correlations were found between ADHDoverall and alcohol intake frequency (rg= -0.28, SE= 0.03), but a weak positive correlation with drinks per week (rg= 0.14, SE= 0.03) and a weak positive correlation with cannabis use (rg= 0.2, SE= 0.03). Marees and colleagues (Marees et al., 2020) looked into similar genetic correlations for alcohol use, and found evidence to suggest that they are the result of SES influences. ADHDoverall was weakly negatively genetically correlated with birth weight (rg= -0.1, SE= 0.02), but showed a weak positive genetic correlation with childhood obesity (rg= 0.21, SE=0.05) and a moderate positive genetic correlation with adult BMI (rg= 0.3, SE= 0.02).

Discussion
We present a genome-wide association meta-analysis of childhood Attention-Deficit/Hyperactivity Disorder symptoms (ADHDSYMP). A total of 28 cohorts with measures of ADHD symptom counts took part; contributing data from multiple raters and instruments, across a wide range of ages. We meta-analyzed all continuous measures and combined these results with results from two GWAMAs of ADHD diagnosis (ADHDDIAG) by Demontis and colleagues (2019, 2023).
We did not identify any genome-wide significant hits for ADHD symptoms specifically. Genetic correlations with ADHD diagnosis was rg= 1.00, SE= 0.06. This supports the notion that clinical ADHD is at the extreme end of a continuous genetic liability that is indexed by ADHD symptoms (Larsson et al., 2012; Levy et al., 1997). This was previously suggested based on multivariate twin studies (Derks et al., 2008). The estimated  of ADHDSYMP was 0.04 (SE= 0.01), which may be considered low compared to the estimated
  in Demontis et al., 2019 and 2023: 0.22 and 0.14 respectively. This is probably because we introduced heterogeneous measurement error and bias in our phenotyping by including symptom measures from different raters, and at different ages, which could subsequently suppress SNP-heritability.
By meta-analyzing GWASs of ADHD symptoms and ADHD diagnosis, we found 2,039 genome-wide significant variants in 39 independent loci, of which 17 were new. Demontis et al. found 12 and 27 independent hits in 2019 and 2023, which included data from 23andMe. These 23andMe data were excluded from the current meta-analyses. This shows that, because ADHD symptom measures have been widely collected, combining ADHD symptom counts and diagnosis can be effective in identifying implicated genetic variants for ADHD. The estimated  of ADHDoverall was 0.11 (SE= 0.01), compared to 0.13 (SE= 0.01) in ADHDDIAG when excluding 23andMe data. This means that by including ADHDSYMP in the ADHDDIAG results,
  slightly decreased. We believe this is due to heterogeneous measurement error and bias in the ADHDSYMP phenotyping (Wang et al., 2023). The same can be observed when looking at the differences in
  between ADHDDIAG from 2019 (
 including 23andMe), which was strict in its definition of ADHD cases, and ADHDDIAG from 2023 (
 including 23andMe), which was slightly more lenient in its definition of ADHD cases.
MAGMA analyses identified 64 potential ADHD risk genes. These genes were significantly enriched in genes previously identified in GWASs of cognitive phenotypes and risk-taking behaviors. The total GWAS signal was significantly differentially expressed in several brain specific tissue types, general brain tissue types and the pituitary gland, as well as in late infancy Brainspan brain samples. FUMA gene-mapping mapped significant loci to 204 genes. Again, genes were enriched in gene-sets reported by previous GWASs on cognitive behavior, risk-seeking behavior, and brain development. FUMA enrichment analyses further revealed 29 transcription factor targets that may be of interest for ADHD.
To get a better understanding of the causal pathways from SNPs to ADHD, we ran FLAMES (Schipper et al., 2023) to identify likely effector genes. FLAMES identified 22 potential effector genes, of which 14 overlapped with the MAGMA genes, 12 were previously reported by Demontis et al. (2023) and 8 were not previously linked to ADHD or not reported on GWAS Catalog. The 22 genes were significantly overrepresented in gene-sets differentially expressed in the frontal cortex, enriched in 4 GO biological processes related to neural and physical development, 52 transcription factor targets, 13 microRNA targets, 8 different cell type signatures, 4 synapse cellular components, and 3 synaptic biological processes. In Demontis et al. (2023), the set of potential ADHD risk genes was significantly enriched among genes upregulated during early embryonic brain development, this result was not replicated in our study. A common theme is that implicated genes are enriched in processes that are involved in neural development and functioning. The results provide several new avenues to investigate, which could prove useful in gaining more insights into the etiology of ADHD. The results may provide more potentially useful information for the 22 potential effector genes compared to the 204 genes identified by FUMA positional mapping, eQTL mapping, and chromatin interaction mapping. We think this difference results from the difference in strategies employed by both methods. FUMA maps every gene for which some functional link is known to exist, whereas FLAMES weighs all these measurements and only prioritizes genes if they are clearly more likely causal genes than the other genes in the locus. Our findings suggests that FLAMES can help identify functional pathways that may remain hidden with other approaches due to a reduction of noise from non-causal genes in the set of prioritized genes, which decreases the power to detect enrichment in functional gene-sets.
Next, we examined genetic correlations between ADHDoverall and various external phenotypes. Except for anorexia nervosa, ADHDoverall showed significant genetic correlations with all examined psychopathological traits. Most striking was the genetic correlation of 1.13 with childhood aggressive behavior, and 0.97 with antisocial behavior. Previous studies reported moderate-to-strong phenotypic correlations across sex-, rater-, age-, and instrument-specific assessment between aggressive behavior and attention problems and hyperactivity (Bartels et al., 2018). We found a negative genetic correlation between ADHD and alchohol intake frequency, and a positive correlation between ADHD and number of drinks per week. Marees et al. (2020) studied similar correlations between alcohol consumption and mental health traits, and found evidence that suggests the different genetic correlations are a result of SES effects. We found a moderate genetic correlation with smoking behaviors, but a small correlation with cannabis use and discrepant findings for alcohol consumption. This was surprising, given the phenotypic associations that have been reported in previous studies (Lee et al., 2011). We found negative correlations with several cognitive traits, such as (childhood) IQ, verbal-numerical reasoning, and educational attainment. Similar to a GWAS of childhood aggression (Ip et al., 2021), genetic correlations with several hormone levels were around zero. Finally, we found a small negative correlation with birthweight, but a weak positive correlation with childhood obesity, and adult BMI. These genetic correlations suggest wide pleiotropic effects of variants involved with ADHD. This is illustrative of the polygenetic nature of most behavioral, cognitive, and (mental) health traits. It also indicates genetic factors play a role in the comorbidity of psychopathological disorders.
Combining data collected using different instruments and by different raters helps to increase the sample size, and with that the statistical power of our analyses. This is illustrated by the apparent increase in power to detect genetic variants associated with ADHD in the combination ADHDSYMP and ADHDDIAG, compared to the combination ADHDDIAG and EAGLE ADHD GWAS (Demontis et al., 2019; Middeldorp et al., 2016). However, this approach of including different raters and instruments also has some downsides. Correlations between raters and instruments are not always large, meaning that we introduce heterogeneous measurement error and bias in our phenotyping, which could suppress SNP-heritability. More homogeneous measurement may offer an avenue to higher powered GWAS. In light of increased collaborations between cohorts to expand sample sizes for GWAS, more efforts to standardize the assessment of traits could help further increase the power and specificity of GWAS results. Moreover, downstream analyses, for example using polygenic scores computed with the summary statistics of the current study, will favor cohorts using the same instruments and raters that dominated the discovery sample, in our case the Achenbach System of Empirically Based Assessment (Achenbach et al., 2017).
Assessments of ADHD in individuals from non-European ancestry were rare in each of the included cohorts. Because of the low number of assessments, we were forced to exclude non-European individuals from our analyses. We know that results from European ancestry GWASs often also significantly predict differences in non-European ethnic groups, but often effect sizes are diluted towards zero. Regrettably, this means that knowledge generated by these types of studies risks benefit individuals of European ancestry more than from diverse backgrounds. To better understand the etiology of ADHD across individuals and backgrounds, it is important to continue ongoing efforts to increase the inclusivity of GWAS samples.
In conclusion, the current study adds novel insight into the genetic etiology of ADHD. By meta-analyzing GWAS results from symptom counts of ADHD in children with a diagnosis of ADHD, we identified novel genome-wide significant loci and genes. The number of genome-wide (significant) genetic variants that are implicated in ADHD provides further insight into the polygenic etiology of ADHD. The 22 potential effector genes that were identified by FLAMES gives insight in several biological processes that may play a causal role in the etiology of ADHD, and provides avenues for further research. The genetic correlations with other phenotypes further indicate the wide pleiotropic effects of genetic variants and the role that genetic variants play in the co-occurrence with (mental) health traits.
Methods
Sample & cohorts
Childhood cohorts that collaborate within the ACTION (Aggression in Children: unraveling gene-environment interplay to inform Treatment and InterventiON strategies) consortium (Bartels et al., 2018; Boomsma, 2015; Ip et al., 2021) and EAGLE consortium (Middeldorp et al., 2019) took part in the meta-analysis of ADHD symptom counts (ADHDSYMP). Cohorts assessed ADHD Symptoms in children and adolescents aged 1.5 to 18 years and also included adult retrospective assessments. Each cohort received a standard operation protocol (see: https://www.action-euproject.eu/content/data-protocols). Cohorts could contribute one or several univariate genome-wide association studies (GWAS). A separate analysis was performed for every unique combination of rater, instrument, and age, with a minimum of 450 observations per GWAS (so that each GWAS included a maximum of one measure for each individual). Extended information on the cohorts can be found in Supplementary Table 1 and the Supplementary Text. Assessments of individuals of non-European ancestry were limited, and analyses were restricted to individuals of European ancestry. In total, 28 cohorts contributed 154 GWASs, resulting in a total of 288,887 observations from 72,483 unique individuals (Supplementary Table 2).
Measurement of ADHD symptoms
ADHD symptoms in children and adolescents were rated by parents, teachers, and the individuals themselves. Additionally, retrospective assessments of (pre-) adolescent ADHD symptoms from self-report or maternal report were included in the GWAMA. To maximize sample size, we included measurement of ADHD symptoms across multiple instruments. In total, 22 ADHD symptom assessment instruments were included in the meta-analysis (Supplementary Table 3). The most commonly employed instruments were the Achenbach System of Empirically Based Assessment (Achenbach et al., 2017) and the Strengths and Difficulties Questionnaire (Goodman, 2001).
Genotyping and quality control
Genotyping was performed within each cohort using common genotyping arrays (see Supplementary Table 4), followed by cohort-specific quality control based on individual- and variant-based call rate, Hardy-Weinberg equilibrium, excessive heterozygosity rates, and minor allele frequency (see Supplementary Table 5). Cohorts removed samples with non-European ancestry. 78.6% of the cohorts imputed their genotypes to 1000 Genomes (1000G) phase 3 version 5, while the remaining cohorts used 1000G phase 1 version 3 as the reference set for the imputation (Supplementary Table 6). All genotypes were mapped to build 37 of the Human Genome Reference Consortium assembly (GRCh37).
GWA model
Each cohort performed a univariate GWAS where ADHD symptoms were regressed on the SNP genotype, with age, sex, and first five ancestry-based principal components as fixed effects, and, if necessary, cohort-specific covariates (Supplementary Table 7). To correct for dependency between observations within univariate analyses, cohorts with related individuals applied a mixed linear model (Tucker et al., 2015) or a sandwich correction of the standard errors (Minică et al., 2015).
GWASs were stratified by (1) rater, (2) instrument, and (3) age, so that observations within a univariate GWAS were independent, with a minimum stratum sample size of 450 observations. In total, summary statistics for 154 univariate GWAS were uploaded. Descriptive statistics for each uploaded GWAS are shown in Supplementary Table 8. Each cohort also supplied information on the degree of sample overlap and phenotypic correlation between their univariate analyses. These statistics allowed us to account for dependency between observations within cohorts.
Pre-GWAMA QC
Summary statistics from each GWAS went through quality control (QC) using the EasyQC software package (Winkler et al., 2014). SNPs with a genotyping rate below 95% were removed. We applied variable QC filters on MAF and HWE p-value tailored to the sample size in the specific GWAS. Respective cutoffs of INFO> 0.6 and INFO> 0.7 were applied to SNPs that were imputed using MACH and IMPUTE (Liu et al., 2015). Reported allele frequencies were compared to the allele frequency in an imputation-matched reference population and variants with an absolute difference in allele frequency larger than 0.2 were removed. Supplementary Table 9 reports the number of SNPs before and after QC.
Meta-analysis of ADHD symptoms
The meta-analysis method is equal to the method described by Ip and colleagues (Ip et al., 2021). Due to sample overlap between the univariate GWASs, covariance between GWAS test statistics are a function of sample overlap and a truly shared genetic signal (Bulik-Sullivan, Loh, et al., 2015). To correct for sample overlap during the meta-analysis, we applied a modified version of the multivariate meta-analysis approach developed by Baselmans and colleagues (2019), where we calculated the expected cross-trait-intercept (Bulik-Sullivan, Loh, et al., 2015) based on the observed sample overlap and phenotypic covariance, as reported by the cohorts. Finally, because the sum of the number of observations (Nobs) was an overestimate of the effective sample size (Neff), we approximated the effective sample size as proposed by Ip and colleagues (2021)  SNPs with MAF< 0.01, Neff< 15,000, or were observed in only one cohort were removed from further analyses. SNP-heritability (
 ) was estimated by genomic Structural Equation Modeling in R (Grotzinger et al., 2019).
Meta-analysis with case-control ADHD GWAS
In the next step, we meta-analyzed our ADHDSYMP GWAMA with a GWAS of ADHD diagnosis (Demontis et al., 2023). In ADHDDIAG, cases are defined as clinically diagnosed with ADHD or prescribed medication specific for ADHD. ADHDDIAG included data from the Lundbeck Foundation Initiative for Integrative Psychiatric Research (iPSYCH), the Psychiatric Genomics Consortium (PGC), and deCode. Data were obtained for adults and children, resulting in a total of 38,691 cases and 186,843 controls.
For the meta-analysis, we first adjusted the test statistics and sample sizes for ADHDSYMP and ADHDDIAG as proposed by (Demontis et al., 2019). The lifetime population prevalence of ADHD was assumed to be 5% (Faraone et al., 2015). SNP-heritability for ADHDSYMP, and ADHDDIAG, and rg and cross-trait intercepts (CTI) between ADHDSYMP and ADHDDIAG were estimated by genomicSEM in R (Grotzinger et al., 2019). We meta-analyzed the results from ADHDSYMP and ADHDDIAG based on the approach outlined in Baselmans and colleagues (Baselmans et al., 2019). We specified the effective sample sizes for ADHDDIAG as suggested by Ip and colleagues (2021):  SNP-heritability was estimated using LDSC in genomicSEM (Grotzinger et al., 2019). We assumed no sample overlap between ADHDSYMP and ADHDDIAG.
Follow-up analyses
Fine mapping & gene-based tests
We used FUMA (Watanabe et al., 2017) to identify independent genome-wide significant loci and associated genes. LD blocks of independent significant SNPs within 250kb were merged into a single genomic locus. Protein-coding genes were mapped if they were located within a maximum distance of 10 kb of an independent significant SNP, or if a credible variant was annotated to the gene based on eQTL data or chromatin interaction data from human brain (see Supplemental Text for the included datasets). These are the same settings used by Demontis et al. (Demontis et al., 2023). Gene-based tests were run in MAGMA (de Leeuw et al., 2015). MAGMA gene-based tests combine P-values from multiple SNPs inside a gene to obtain a test statistic for each gene (Zgene), while accounting for incomplete linkage disequilibrium between SNPs. To this end, a list of 18,296 genes and their start- and end-positions, and pre-formatted genotypes, based on 1000G phase 3, were obtained from the MAGMA website (see Supplements). We applied a Bonferroni correction for multiple testing at α= 0.05 / 18,296 = 2.733 x 10⁻⁶.
It remains difficult to identify which genes are causally involved in ADHD. Fine-mapped Locus Assessment Model of Effector geneS (FLAMES) was recently developed with the goal of predicting the most likely effector genes from GWAS results. FLAMES is a novel framework that combines SNP-to-gene evidence and convergence-based evidence, outputting a single score per gene from fine-mapped GWAS loci. We performed statistical fine-mapping using FINEMAP version 1.4.1 (Benner et al., 2016), and an LD reference panel of 100,000 unrelated UK biobank participants of European descent. Given that the GWAMA contains cohorts that do not belong to the UK biobank we restricted the maximum number of causal variants in a locus modelled by FINEMAP to 1, to avoid overfitting. We ran FLAMES (version 1.0.0) by inputting pathway naïve PoPS scores (Weeks et al., 2023) for our GWAMA, the FUMA defined loci and corresponding fine-mapped credible sets, resulting in a single FLAMES score per gene. Genes with FLAMES scores above 0.05 were interpreted as potential effector genes, as suggested by the FLAMES authors. For more information on FLAMES, and the included functional annotations, see Schipper et al. (2023). Functional annotation and enrichment analysis was done for a set of genes with FLAMES scores above 0.05.
Enrichment & pathway analyses
We performed MAGMA gene-set analyses using the full ADHDoverall results. Gene property analysis was performed to test relationships between tissue specific gene expression profiles (See Supplementary Notes for an overview) and ADHD-gene associations. Next, genes mapped by FUMA, and the set of potential effector genes identified with FLAMES were used in gene-set enrichment analyses. We ran hypergeometric tests using FUMA genes2func to assess if genes of interest are overrepresented in any of the pre-defined gene sets (See Supplemental Notes for all included gene-sets). We used SynGO (Koopmans et al., 2019) v1.2 (“20231201”) to test for enrichment in genes encoding for proteins involved in synaptic cellular components and biological pathways. The brain expressed background set was used, containing 18,035 unique genes.
Genetic correlations
We computed genetic correlations between ADHDoverall and 49 preselected traits, including cognition and externalizing behaviors, psychopathologies, anthropometric measures, metabolic, and health outcomes (see Supplementary Table 10). Phenotypes were selected based on established hypotheses or were at least nominally significantly (P<0.05) genetically correlated with ADHDDIAG2019 (Demontis et al., 2019). Following Bulik-Sullivan et al. (Bulik-Sullivan, Finucane, et al., 2015) we restricted genetic correlations to external phenotypes for which the Z-scores of the LDSC-based  are ≥ 4.
Data Availability
All data produced are available online at <link to follow>
Ethics & Inclusion Statement
This study is the result of a large collaborative effort among multiple clinical and population-based cohorts. Researchers and principal investigators (PIs) representing the individual cohorts were involved in the design and execution of the study. Cohort specific GWAS analyses were performed locally, by local researchers. Local researchers and PIs were included as co-authors in consultation with the PIs of each included cohort. Data collections for the cohorts were approved by local ethics committees. Study approval was obtained from the Central Ethics Committee on Research Involving Human Subjects of the VU University Medical Center, Amsterdam (NTR 25th of May 2007 and ACTION 2013/41 and 2014.252), an Institutional Review Board certified by the U.S. Office of Human Research Protections (IRB number IRB00002991 under Federal-wide Assurance- FWA00017598; IRB/institute codes).
Competing interests
J.A.R.Q. was on the speakers’ bureau and/or acted as consultant for Biogen, Idorsia, Casen-Recordati, Janssen-Cilag, Novartis, Takeda, Bial, Sincrolab, Neuraxpharm, Novartis, BMS, Medice, Rubió, Uriach, Technofarma and Raffo in the last 3 years. He also received travel awards (air tickets + hotel) for taking part in psychiatric meetings from Idorsia, Janssen-Cilag, Rubió, Takeda, Bial and Medice. The Department of Psychiatry chaired by him received unrestricted educational and research support from the following companies in the last 3 years: Exeltis, Idorsia, Janssen-Cilag, Neuraxpharm, Oryzon, Roche, Probitas and Rubió. M.C. has received fees to give talks for TAKEDA and Laboratorios RUBIO. The authors have no other relevant affiliations or financial involvement with any organization or entity with a financial interest in or financial conflict with the subject matter or materials discussed in the manuscript apart from those disclosed.
URLs
GWAS Catalog: https://www.ebi.ac.uk/gwas/
FUMA: https://fuma.ctglab.nl
SynGO: https://www.syngoportal.org
Summary statistics: TBA
Code & Summary Statistics
Analysis plan: https://www.action-euproject.eu/sites/default/files/Action%20AGG%20AP%20SOP.pdf
Code: -link to follow-
Summary Statistics: -link to follow-
Acknowledgements
We very warmly thank all participants, their parents, and teachers for making this study possible. The project was supported by the Aggression in Children: Unraveling gene-environment interplay to inform Treatment and InterventiON strategies project (ACTION). ACTION received funding from the European Union Seventh Framework Program (FP7/2007-2013) under grant agreement no 602768. Cohort-specific acknowledgements and funding information are included in the Supplementary text.
References


