
Abstract
Background Patient motivation is essential for the success of their rehabilitation. Apathy, a state of primary motivational deficiency, may therefore hinder physiotherapists’ interventions, such as those aimed at increasing patients’ physical activity. This study aims to examine the negative relationship between apathy and physical activity and to identify the factors that influence this relationship.
Objective This study aims to explore the negative association between apathy and physical activity, identifying factors influencing this relationship.
Methods Six databases were searched for articles including both a measure of apathy and physical activity. Two reviewers screened articles for inclusion, assessed risk of bias, and extracted data from each study. Pearson product-moment correlations were pooled from eligible studies using the generic inverse pooling and random effects method to examine the relationship between apathy and physical activity.
Results Twenty-eight articles were included in the systematic review and 22 studies (n = 12,541 participants) in the meta-analysis. Results showed a small negative correlation between apathy and physical activity (r = -0.13; 95% CI: -0.18 to -0.09; p < 0.0001). A subgroup meta-analysis revealed that the correlation was statistically significant in patients with Parkinson’s disease and in older adults who were healthy, depressed, fallers, or had mild cognitive impairment. A meta-regression suggested an effect of age, with older age being associated with a stronger correlation between apathy and physical activity.
Conclusions Our results suggest that higher levels of apathy are associated with lower levels of physical activity and that this negative association is strengthened with aging. Therefore, apathy could be a limiting factor to exercise therapy and may have prognostic implications in patients whose condition requires physical activity.
In the early 1990s, apathy began to be considered a syndrome rather than a mere symptom of another condition, and was defined as a state of primary motivational impairment characterized by reduced goal-directed behaviors (e.g., lack of productivity, effort, initiative, and perseverance), reduced goal-directed cognitions (e.g., lack of interest in learning new things, in new experiences, lack of concern about one’s personal and health problems, reduced socialization), and reduced emotional concomitances of behavior (e.g., flat affect, emotional indifference)1,2. To date, the dominant theoretical frameworks still consider three subtypes of apathy: behavioral, cognitive, and emotional3,4, with a fourth subtype, social apathy, recently proposed but requiring further research5. Levy and Dubois6 proposed that behavioral apathy is related to difficulties in elaborating the plan of actions necessary for behavior. Cognitive apathy is the inability to self-activate thoughts or self-initiate actions. Emotional apathy is the inability to establish the linkage between emotional signals and behavior6.
Apathy occurs across a wide range of neurological and psychiatric disorders7, including dementia (54%)8, schizophrenia (47-53%)9-11, Parkinson’s disease (40%)12, and stroke (33%)13. Apathy has also been observed in healthy young adults (1.5%)14 and older adults with normal cognitive function (2-7%)15-19. Apathy is associated with lower cognitive performance in older adults with normal cognitive functioning16, cognitive decline (mild cognitive impairment)17, transition to dementia20,21, and dementia severity22,23. Therefore, apathy could be considered a marker of impending cognitive decline and future risk for dementia16. Moreover, apathy has been associated with frailty24, functional decline25-28, poorer quality of life14,19,29, higher mortality30,31, and higher healthcare costs32.
In addition, some studies suggest that apathy can negatively affect physical activity23-36, which includes exercise, sports, active travel (cycling, walking), household chores, and work-related physical activity37. This potential effect of apathy is worth investigating since physical activity is now widely recognized as one of the top contributors to physical and mental health, improving cognitive functioning38, and reducing rates of cardiovascular disease39, cancer40, hypertension41, diabetes42, obesity43, depression44, and functional dependence44,45. Despite these benefits, over one in four adults fails to meet the recommended levels of physical activity37. While the motivational impairment that defines apathy is likely to reduce the engagement in physical activity, there are some discrepancies in the literature, with multiple articles showing no evidence of such relationship46,47 or even supporting the opposite association48.
The main objective of this study was to conduct a systematic review and meta-analysis of the direct relationship between apathy and physical activity. We hypothesized that levels of apathy would be negatively associated with levels of physical activity. In addition, we examined whether this association was influenced by apathy measures, physical activity measures (i.e., accelerometers, pedometers, questionnaires), physical activity outcome (e.g., total physical activity, moderate or vigorous physical activity, steps per day), health status, age, and gender.
Methods
Search Strategy
This review is reported according to the Preferred Reporting Items for Systematic Reviews and Meta-Analyses (PRISMA) guidelines49. Potential studies were identified by searching the MEDLINE (via PubMed), PsycINFO, Web of Science, Embase, SPORTDiscus, and CINHAL databases. The search terms used to identify relevant studies were variants of physical activity (e.g., physical activity, physical education, training, physical fitness, exercise, sport, walk) and apathy (e.g., abulia, apathetic, amotivation, avolition, neuropsychiatric inventory, NPI, emotional indifference, frontal lobe personality scale, Lille apathy rating scale, LARS, dementia apathy interview and rating, DAIR, frontal system behavior scale, FrSBe, key behaviors change inventory, KBCI, apathy evaluation scale, apathy scale, irritability apathy scale, and IAS). Articles were searched up to November 2023 with no limitation on the start date. A filter was used to limit the search to studies published in English. To reduce literature bias, this systematic review was pre-registered in PROSPERO (CRD42023492162)50.
Eligibility Criteria and Study Selection
Inclusion Criteria
To be included in this systematic review, articles had to 1) be published in a peer-reviewed journal, 2) be written in English, 3) report original data collected from human participants, 4) include at least one self-reported measure of apathy and at least one measure of physical activity, and 5) formally test the association between these two variables. The physical activity measure could be a self-reported measure of the level of physical activity or device-based measure (e.g., accelerometry). Cohort studies, baseline data from clinical trials, and cross-sectional studies were included in this review.
Exclusion Criteria
Studies were excluded if they were 1) published as a book chapter, study protocol, or conference abstract, or 2) based on laboratory-based measures of physical fitness (e.g., maximal muscle force,  max) and not on a measure of physical activity.
Study Selection
Functional Articles were screened using the Covidence systematic review software (Veritas Health Innovation, Melbourne, Australia), a web-based collaborative software platform that streamlines the production of systematic reviews. After duplicates were removed, titles and abstracts were independently reviewed by two reviewers who authored this article (AF, AH) according to the inclusion and exclusion criteria using a systematic four-step process. Step 1: Articles that did not report original empirical data were excluded (e.g., reviews, meta-analyses, protocols, commentaries, technical reports, case studies). Step 2: Articles that did not involve human participants were excluded. Step 3: Articles that did not assess both apathy and physical activity were excluded. Step 4: Articles that did not formally test the association between apathy and physical activity, and for which the corresponding author did not provide this information in response to our email request, were excluded. If there was any doubt at any step, the full text was further reviewed. In addition, reference screening and forward citation tracking were performed on the articles remaining after these four steps. Disagreements between the two reviewers (AF, AH) were resolved by consensus among four reviewers (AF, AH, MB, MPB).
Data Extraction
Data extracted from the selected articles included first author’s name, article title, publication year, number of participants, number of men and women, mean age and range, health status, type of apathy measure, level of apathy, type of physical activity measure and outcome, level of physical activity, as well as statistical estimates, and significance of the association between apathy and physical activity.
Bias Assessment
The included studies were assessed for methodological quality using 10 questions from the Quality Assessment Tool for Observational Cohort and Cross-Sectional Studies51. Two reviewers (AF, AH) independently answered these questions for each study, with a third reviewer (MPB) involved in case of disagreement.
Meta Analysis
All analyses were conducted in RStudio integrated development environment (IDE) (2023.06.1+524, “Mountain Hydrangea” release) for R software environment52 using the ‘meta’53, ‘metasens’54, and ‘metafor’55 R packages.
Main Meta Analysis
In the main meta-analysis, we pooled Pearson product-moment correlations from eligible studies to examine the relationship between apathy and physical activity. Correlations were pooled using the generic inverse pooling method via the ‘metacor’ function in the R ‘meta’ package53. This function automatically performs a necessary Fisher’s z-transformation on the original, untransformed correlations prior to pooling. The ‘metacor’ function also reconverts the pooled association back to its original form for ease of interpretation. We anticipated considerable between-study heterogeneity, and therefore, used a random-effects model to pool correlations. The restricted maximum likelihood (RML) estimator56 was used to calculate the heterogeneity variance Tau2. In addition to Tau2, to quantify between study heterogeneity, we report the I2 statistic, which provides the percentage of variability in the correlations that is not caused by sampling error57. The I2 statistic was interpreted as: 0-40%, may not be important; 30-60%, may represent moderate heterogeneity; 50-90%, may represent substantial heterogeneity; and 75-100%, may represent considerable heterogeneity. To reduce the risk of false positives, we used a Knapp-Hartung adjustment58 to calculate the confidence interval around the pooled association. We also report the prediction interval, which provides a range within which we can expect the associations of future studies to fall based on the current evidence. If significant, the pooled correlation was interpreted using Cohen’s conventions59: r ≈ -0.10, small negative correlation; r ≈ -0.30, moderate negative correlation; r ≈ -0.50, large negative correlation.
Publication Bias Assessment
Publication bias was assessed using a funnel plot, which is a scatter plot of the studies’ effect size expressed as the Fisher’s z transformed correlation on the x-axis against a measure of their standard error (which is indicative of precision of the study’s effect size) on the y-axis. When there is no publication bias, the data points in a funnel plot should form a roughly symmetrical, upside-down funnel. Studies in the top part of the plot, which have lower standard errors, are expected to lie closely together, and not far away from the pooled effect size. In the lower part of the plot, studies have higher standard errors, the funnel “opens up”, and effect sizes are expected to scatter more heavily to the left and right of the pooled effect. Egger’s regression was used to formally test funnel plot’s asymmetry60. The Rücker’s limit meta-analysis method61, which explicitly includes the heterogeneity variance in the model, was used to compute bias-corrected estimate of the true effect size.
Another method used to assess publication bias was p-curve analysis59. When the null hypothesis is true (i.e., there is no true effect), p-values are assumed to follow a uniform distribution: highly significant effects (e.g., p = 0.01) are as likely as barely significant effects (e.g., p = 0.049). However, when the null hypothesis is false (i.e., there is a true effect in our data), p-values are assumed to follow a right-skewed distribution: highly significant effects are more likely than barely significant effects. A left-skewed distribution would suggest that some studies used statistical tests to find significant results in ways that may not be reproducible or generalizable (i.e., p-hacking).
Secondary Meta-Analysis, Subgroup Meta-Analyses, and Meta-Regressions
A secondary meta-analysis was conducted using the same approach, but based on Spearman’s rho values, to further test the relationship between apathy and physical activity.
Subgroup meta-analyses were conducted to examine the differences in correlations between studies including participants with different health conditions and using different types of physical activity outcomes, and apathy measures.
Meta-regressions were conducted to examine if the average age of participants or the proportion of women in a study predicted the reported correlation between apathy and physical activity. Another meta-regression was used as a sensitivity analysis to examine whether the quality of the studies affected the correlation.
Results
Literature Search
The primary search identified 6,950 potentially relevant articles from the six databases (Figure 1), including 2,025 duplicates. Of the 4,925 articles screened, 3,441 were unrelated to apathy or physical activity. Disagreement occurred in 31 cases, all of which were resolved by consensus. Of the 1,484 remaining articles, 1,321 were excluded in step 1 because they did not report original data. No articles were excluded in step 2 as all articles involved human participants. We excluded 98 articles in step 3 because they did not include a measure of apathy (k = 10), physical activity (k = 80), or both (k = 8). To increase the completeness of our review, we emailed the corresponding authors of articles that did not formally test the association between the apathy and physical activity, and asked for the Pearson correlation estimate of this association and the sample size used to calculate it or the raw data for the physical activity and apathy measures so we could compute it ourselves. Forty-two corresponding authors were contacted. Six of these authors replied: one author provided their raw data62, one author provided their Pearson’s correlation coefficient63, and four authors replied that they would contact their co-authors but did not get back to us64-67. We excluded 138 articles in step 4 because the article did not formally test the association between apathy and physical activity, and the corresponding author did not respond to our email request. Based on reference screening and forward citation tracking, the principal reviewer (AF) identified three studies68-70 that assessed both physical activity and apathy, but one of them did not formally test their association68. However, the corresponding author of the latter article68 did provide us with the Pearson’s correlation value in response to our email request. As a result, a total of 28 articles were included in our systematic review. Two of these articles, published by the same group, had similar methods, and partly overlapping recruitment periods, suggesting that some participants may have been included in both studies47,71. Quality score of studies ranged from 6 to 10 out of 10, with a mean ± SD of 8.4 ± 1.2 (Table 1).

PRISMA 2020 flow diagram.
Descriptive Results
Participants
The 28 articles identified by the systematic review included a total of 13,716 participants aged 30 to 95 years, including 7,167 women, 6,283 men, and 266 participants whose gender and sex was not reported. The studies investigated populations with stroke (k = 4)47,48,71,72, multiple sclerosis (k = 1)33, Parkinson’s disease (k = 6)36,68,70,73-75, mental illness (k = 2)76,77, cancer (k = 1)78, myotonic dystrophy (k = 1)46, Alzheimer’s disease (k = 1)35, depression (k = 3)69,79,80, cognitive impairment (k = 3)62,63,81, as well as healthy older adults (k = 9)34,79-86 (Table 1).
Apathy
In 14 of the 28 studies, apathy was assessed using the Apathy Scale (k = 13)36,47,68-71,73-75,78-80,84 or its shorter version [12-item Apathy Scale (k = 1)34]. This scale consists of 14 questions rated on a Likert scale ranging from 0 (not at all) to 3 (a lot). The total score on the 14-item Apathy Scale ranges from 0 to 42, with higher scores indicating more severe apathy. In clinical settings, a patient with a score ≥ 16 is considered apathetic87. Apathy was also assessed using the Apathy Evaluation Scale (k = 6)33,46,48,63,72,77 or its shorter version [12-item Apathy Evaluation Scale (k = 1)76]. This scale consists of 18 items assessing the cognitive, emotional, and behavioral aspects of apathy, rated on a Likert scale ranging from 1 (not at all) to 4 (a lot). The total score ranges from 18 to 72, with higher scores indicating more severe apathy. In clinical setting, a patient with a score ≥ 37 is considered apathetic88. The other measures that were used are the apathy subscale of the Geriatric Depression Scale (k = 4)82,83,85,86 and the apathy subscale of the Neuropsychiatric Inventory Questionnaire (k = 3)35,62,81.
Eighteen studies reported mean levels of apathy (Table 1). The Apathy Scale-based studies revealed a range from 8.736 to 27.868, while the Apathy Evaluation Scale studies reported levels between 13.046 and 31.448.
Physical Activity
Twenty-four studies assessed physical activity using a self-reported measure (Table 1). Five of these questionnaire-based studies used the short form of the International Physical Activity Questionnaire (IPAQ-SF)46,48,62,73,76, which consists of 6 items assessing time spent in light (i.e., walking), moderate (e.g., carrying light loads, cycling at moderate speed, doubles tennis), and vigorous physical activity (e.g., digging, fast cycling, heavy lifting, aerobics) over the last 7 days89. The other questionnaires used to assess physical activity were: the long form version of the IPAQ (IPAQ-LF) (k = 4)69,70,79,80, the modified Baecke Habitual Physical Activity Questionnaire (BHPAQ) (k = 2)34,84, the Minnesota Leisure Time Physical Activity Questionnaire (k = 1)70, the Longitudinal Aging Study Amsterdam Physical Activity Questionnaire (LAPAQ) (k = 1)83, the National Health Interview Survey and the Minnesota Heart Survey Physical Activity Questionnaire (NHIS/MHS PAQ) (k = 1)81, the Nurses’ Health Study II Activity and Inactivity Questionnaire (NHST II Activity) (k = 1)78, Physical Activity Disability Scale (PADS) (k = 1)33, the Nord-Trøndelag Health Study-derived questions (HUNT) (k = 2)72,77, the Canadian Community Health Survey-derived questionnaire (CCHS) (k = 1)68, and the Physical Activity Scale for the Elderly (PASE) (k = 1)36.
Physical activity was also assessed with devices such as accelerometers measuring accelerations in three dimensions (k = 4)35,46,63,76 and pedometers measuring the number of steps (k = 3)47,48,71 (Table 1). These devices were worn at the hip (k = 2)46,48, chest (k = 1)63, wrist (k = 2)35,76, or pocket (k = 1)47, and one study did not report where the device was worn71. Studies based on accelerometer-derived measures used an ActiGraph device (ActiGraph, LLC, Pensacola, FL, USA)46,63, the Polar M200 (Polar Electro Oy, Kempele, Finland)76, or the Micro Motionlogger Watch (Ambulatory Monitoring, Ardsley, NY, USA)35. The pedometers used were the Omron Walking Style Pro 2.0 (Omron Healthcare, Kyoto, Japan)48, or the Yamasa EX-300 (Yamasa, Choshi, Japan)47. One study did not specify the pedometer that was used71.
To assess physical activity, the studies used the following outcomes: score from a questionnaire (e.g., PASE, PADS, BHPAQ; k = 11)33,34,36,68,72,75,81-85, METmin/week (k = 7)34,48,69,78-80,84, steps per day (k = 3)47,48,71, time per day or week (k = 8)46,68,70,73,74,76,77,86, counts per minute (k = 1)35, kilocalories per day (k = 1)63. Four studies used multiple physical activity outcomes (k = 4)34,48,68,84.
Association Between Physical Activity and Apathy
Among the 28 articles included in the systematic review, five reported correlation coefficients of the association between physical activity and apathy. Specifically, two articles reported at least one Pearson’s r correlation coefficient33,73 and three other articles reported at least one Spearman’s rho35,48,76. When a correlation coefficient was not reported, but the exact p value (or t value) and sample size were available and it was possible to know the sign of the correlation, which was the case for 11 studies46,47,63,69,71,72,74,75,77,78,82, the Pearson’s r value was computed using an ad-hoc R code. For the studies that reported a relative p-value < 0.001 instead of an exact p-value, we used a p-value of 0.0009 to estimate an approximate r value79,80,81,83,85. Through email correspondence with the authors, we obtained three additional Pearson’s r values36,62,68 and one additional Spearman’s rho value68. Furthermore, one Pearson’s r value was calculated based on publicly available data86. In total, 22 Pearson’s r values from 22 studies33,36,46,47,62,63,68,69,71-75,77-79,80,81-83,85,86 and seven Spearman’s rho values from four studies35,48,68,76 were used in the meta-analysis (Table 1). When exact p-values were not reported in an article, but the sample size (n) and Pearson’s correlation coefficient I were available, the exact p-value was computed using an ad-hoc R code.
The remaining 3 studies did not report a correlation coefficient and were therefore not included in the meta-analysis. Two of these studies reported showed a significant negative association between physical activity and apathy based on odds ratios (84) or standardized beta coefficient (β) (34). The third study reported only a relative p-value > 0.05 (70).
Meta Analysis
Main Meta Analysis
Our meta-analysis of 22 studies (n = 12,541) based on Pearson’s r revealed a statistically significant small negative correlation between apathy and physical activity (r = -0.13; 95% confidence interval [95% CI]: -0.18 to -0.09; p < 0.0001; Table 2; Figure 2). Further supporting this result, between-study statistical heterogeneity could be considered moderate (Tau2 = 0.0038, 95% CI: 0.0003 to 0.0167; I2 = 49.0%, 95% CI: 16.4 to 68.9%), and the prediction interval ranged from r = -0.26 to 0.00, suggesting that the correlation is expected to be negative for a future study.

Correlation between apathy and physical activity based on Pearson’s r values (k = 22, n = 12,541). CI = confidence interval, IV = inverse variance.
Publication Bias Assessment
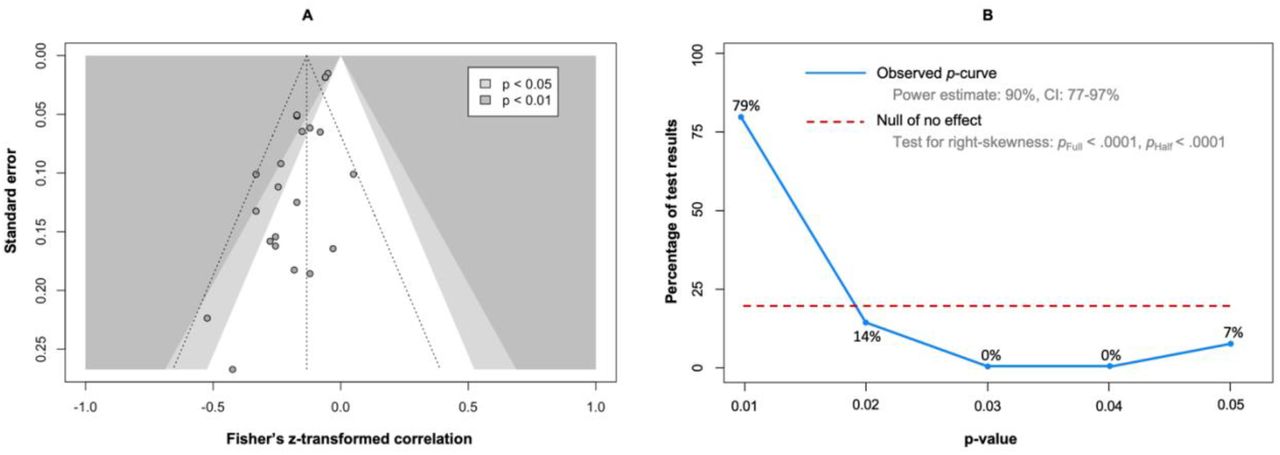
Overall, the funnel plot of the studies’ effect size expressed as the Fisher’s z transformed correlation against a measure of their standard error shows an asymmetrical pattern (Figure 3A), with more studies on the left of the vertical dashed line representing the average effect size. In addition, if the missing studies were imputed in the right part of the plot to increase the symmetry, most of these studies would lie in the non-significance region (in white), which suggests that the asymmetry in the funnel plot may be caused by publication bias rather other potential causes, such as different study procedures and between-study heterogeneity. Egger’s regression test confirmed that the data in the funnel plot was asymmetric (b = -1.44, 95% CI: -1.97 to -0.91, p = 3.1 x 10⁻⁵). However, the bias-corrected estimate of the true effect size, calculated using Rücker’s limit meta-analysis method, showed that the small correlation reported in the main analysis would remain significant even if such publication bias was present in our data set (r = -0.08; 95% CI: -0.14 to -0.02; p = 0.0065).

Contour-enhanced funnel plot of the main meta-analysis (A). The vertical dashed line represents the average effect size. The two other dashed lines represent the idealized funnel-shape that studies are expected to follow. P-curve analysis (B). The blue line indicates the distribution of the analyzed p-values. The red dotted line illustrates a uniform distribution of the p-values, indicating the absence of a true effect.
The 29 correlation values (Pearson’s r or Spearman’s rho) were provided to the p-curve analysis (Figure 3B). The observed p-curve included 14 statistically significant results (p < 0.05), 13 of which were highly significant (p < 0.025), and was visually right-skewed. The other 15 results were excluded because they had a p > 0.05. The p-value of the right-skewness test was < 0.001 for both the half curve (curve of p values ≤ 0.025) and the full curve (curve of p values < 0.05), confirming that the p-curve was right-skewed and suggesting that the effect of our meta-analysis is true, i.e., that the effect we estimated is not an artifact caused by selective reporting (e.g., p-hacking) in the literature90. In addition, the statistical power of the studies that were included in the p-curve analysis was 90% (90% CI: 77 to 97%), suggesting that approximately 90% of the significant results are expected to be replicable.
Secondary Meta-Analysis
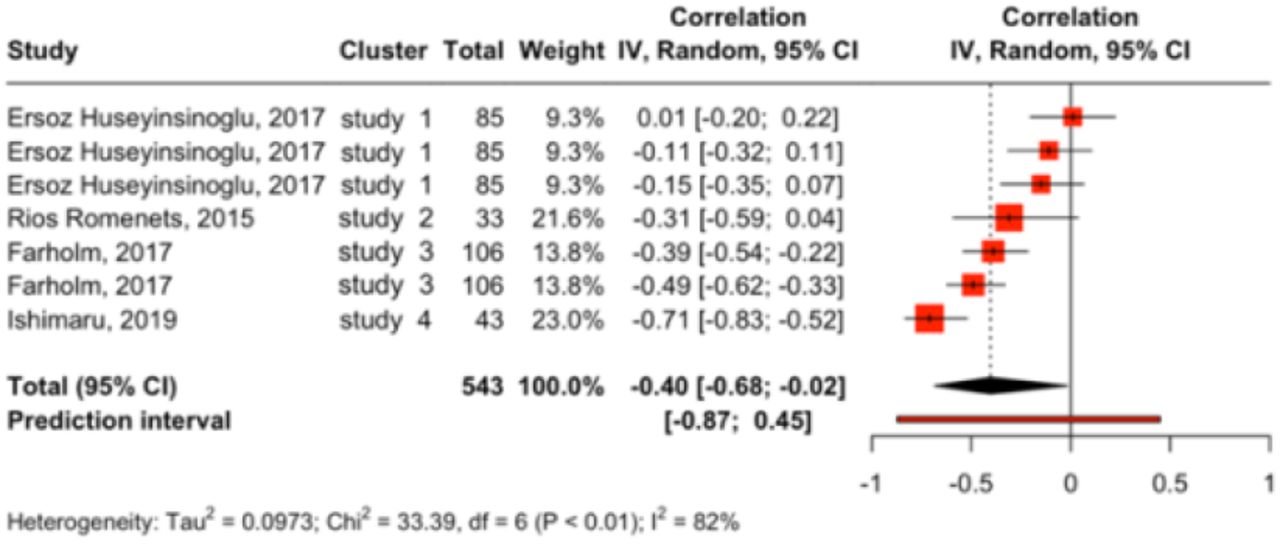
Results of the secondary meta-analysis based on Spearman’s rho values (k = 4, n = 543) were consistent with those based on Pearson’s r as they showed a statistically significant moderate to large negative correlation between apathy and physical activity (r = -0.40; 95% CI: -0.68 to -0.02; p = 0.043) (Figure 4). However, we observed substantial to considerable between-study statistical heterogeneity (between-cluster Tau2 = 0.09, 95% CI: 0.01 to 0.97; I2 = 82.0%; 95% CI: 64.1 to 91.0%), and the prediction interval ranged from r = -0.87 to 0.45, indicating that a moderate to large positive correlation cannot be ruled out for future studies.

Correlation between apathy and physical activity based on Spearman’s rho values (k = 7, n = 437). CI = confidence interval, IV = inverse variance.
Subgroup Meta-Analyses
The test of subgroup differences between health status was possible between studies comprising older adults who were healthy, depressed, fallers, or had mild cognitive impairment (k = 10), people with Parkinson’s Disease (k = 5), and stroke survivors (k = 3). We found statistical difference between these studies (p < 0.0001) (Table 2; Figure 5A). The relationship between apathy and physical activity was statistically significant in studies that included older adults who were healthy, depressed, fallers, or had mild cognitive impairment (r = -0.10; 95% CI: -0.15 to -0.05) or patients with Parkinson’s disease (r = - 0.22; 95% CI: -0.31 to -0.14), but not in studies that included stroke survivors (r = -0.20; 95% CI: -0.64 to -0.34). However, statistical power was lacking in the latter (k = 3) and other health status (k = 1).

Differences according to health status (A), physical activity outcome (B), and apathy measure (C). CI = confidence interval, IV = inverse variance, MCI = mild cognitive impairment, PA = physical activity.
The test of subgroup differences between physical activity outcomes was possible between studies using a score from a questionnaire (k = 7), MET-min/week (k = 6), active time per day or week (k = 5), and steps per day (k = 2) (Table 2; Figure 5B). We found statistical difference between these studies (p < 0.0001). The relationship between apathy and physical activity was statistically significant in studies using a score (r = -0.14; 95% CI: -0.23 to -0.04), MET-min/week (r = -0.15; 95% CI: -0.22 to -0.08), and active time (r = -0.22; 95% CI: -0.30 to -0.14), but not in studies that used the number of steps per day (r = -0.13; 95% CI: -0.99 to 0.98). However, statistical power was lacking in the latter (k = 2) and other physical activity outcomes (k = 1).
The test of subgroup differences between apathy measures was possible between studies using the Apathy Scale (k = 11), the Apathy Evaluation Scale (k = 5), the apathy subscale of the Geriatric Depression Scale (k = 4), and the apathy subscale of the Neuropsychiatric Inventory Questionnaire (k = 2) (Table 2; Figure 5C). The relationship between apathy and physical activity was statistically significant in studies using the Apathy Scale (r = -0.15; 95% CI: -0.20 to -0.10), Apathy Evaluation Scale (r = -0.23; 95% CI: -0.35 to - 0.11), and Geriatric Depression Scale (r = -0.06; 95% CI: -0.10 to -0.02), but not in studies that used the Neuropsychiatric Inventory Questionnaire (r = -0.23; 95% CI: -1.00 to 0.99). However, statistical power was lacking in the latter apathy measure (k = 2).
Meta-Regressions
Age statistically influenced the correlation values of the meta-analysis studies (k = 21; p = 0.003) (Figure 6A), with older samples being associated with more negative relationships between apathy and physical activity. Conversely, the proportion of women did not statistically influence the meta-analysis studies’ correlation values (k = 21; p = 0.346) (Figure 6B).

Meta-Regressions testing the influence of age (A), the proportion of women (B), and study quality score (C) on the correlation estimates of the main meta-analysis studies.
Discussion
The main objective of this study was to conduct a systematic review and meta-analysis of the direct relationship between apathy and physical activity. In addition, we examined the influence of potential moderators.
The main meta-analysis based on Pearson’s r values showed a small negative correlation between apathy and physical activity. The secondary analysis based on Spearman’s rho values further supported these results. These results suggest that apathy is a potential risk factor for physical inactivity, which has been associated with functional independence44,45 and quality of life91,92. Therefore, future studies should examine the potential moderating effect of physical activity on the association between apathy and physical functioning24,79,83,93,94 or quality of life93. While some evidence suggests that apathy hinders engagement in physical activity95, other evidence suggests that physical activity contributes to positive emotions, potentially mitigating apathy73. Therefore, the relationship between apathy and physical activity can potentially be bidirectional.
Our results suggest that the negative relationship between apathy and physical activity was mainly observed in people with Parkinson’s disease and older adults who were healthy, depressed, fallers, or had mild cognitive impairment. Although there was no clear evidence of an association between apathy and physical activity in the other health conditions, such an association cannot be completely ruled out, as the lack of statistical significance could be explained by a lack of statistical power in these health conditions (e.g., stroke) or by the impossibility of comparing them with other health conditions in the subgroup meta-analysis, as they were only examined in a single study (e.g., cancer). The results also showed that the negative association between apathy and physical activity was observed only in studies using active time and questionnaires as a measure of physical activity outcome and the apathy scale for apathy assessment, although this may also be related to the low number of studies using other outcomes.
The results of this systematic review and meta-analysis should be considered in the light of two limitations. First, only articles published in English were included. Inclusion of articles published in other languages may have influenced the results. Second, due to the correlational nature of the meta-analyzed results, we cannot conclude a causal relationship between apathy and physical activity, nor can we exclude the possibility that this relationship is indirect, i.e., mediated by other factors.
Conclusion
The motivation required to adhere to prescribed rehabilitation exercises may be impaired in apathetic patients. In our meta-analysis of 12,541 participants, higher levels of apathy were associated with lower levels of physical activity. This detrimental effect was greater in older adults. These findings suggest that apathy may be a limiting factor in developing strategies for regular exercise, which is in the scope of practice of physiotherapists100, and may have prognostic implications in patients whose condition requires physical activity.
Data Availability
All data produced are available online at https://doi.org/10.5281/zenodo.10929857
Declarations
Data and Code Availability
According to good research practices96, the dataset as wells as R and R Markdown scripts are freely available in Zenodo97.
Authorship Contribution Statement
Based on the Contributor Roles Taxonomy (CRediT)98,99 individual author contributions to this work are as follows: Ata Farajzadeh: Conceptualization, Methodology (systematic review), Formal Analysis; Investigation, Writing (Original Draft), Writing (Review and Editing). Alexe Hébert: Investigation. Ian M. Lahart: Methodology (meta-analysis), Formal Analysis, Writing (Review and Editing). Martin Bilodeau: Writing (Review and Editing), Supervision (AH). Matthieu P. Boisgontier: Conceptualization, Methodology, Formal Analysis, Data Curation, Visualization, Writing (Original Draft), Writing (Review and Editing), Supervision (AF and AH), Project Administration, Funding Acquisition.
Funding
Matthieu P. Boisgontier is supported by Natural Sciences and Engineering Research Council of Canada (NSERC; RGPIN-2021-03153), the Canada Foundation for Innovation (CFI 43661), and Mitacs. Ata Farajzadeh is supported by an Admission Scholarship, a Doctoral International Scholarship, and a Special Merit Scholarship from the University of Ottawa.
Conflict of Interest
The authors declare that there are no conflicts of interest related to the content of this article.
Footnotes
Data & Code: https://doi.org/10.5281/zenodo.10929857
References
- 1.↵
- 2.↵
- 3.↵
- 4.↵
- 5.↵
- 6.↵
- 7.↵
- 8.↵
- 9.↵
- 10.
- 11.↵
- 12.↵
- 13.↵
- 14.↵
- 15.↵
- 16.↵
- 17.↵
- 18.
- 19.↵
- 20.↵
- 21.↵
- 22.↵
- 23.↵
- 24.↵
- 25.↵
- 26.
- 27.
- 28.↵
- 29.↵
- 30.↵
- 31.↵
- 32.↵
- 33.↵
- 34.↵
- 35.↵
- 36.↵
- 37.↵
- 38.↵
- 39.↵
- 40.↵
- 41.↵
- 42.↵
- 43.↵
- 44.↵
- 45.↵
- 46.↵
- 47.↵
- 48.↵
- 49.↵
- 50.↵
- 51.↵
- 52.↵
- 53.↵
- 54.↵
- 55.↵
- 56.↵
- 57.↵
- 58.↵
- 59.↵
- 60.↵
- 61.↵
- 62.↵
- 63.↵
- 64.↵
- 65.
- 66.
- 67.↵
- 68.↵
- 69.↵
- 70.↵
- 71.↵
- 72.↵
- 73.↵
- 74.↵
- 75.↵
- 76.↵
- 77.↵
- 78.↵
- 79.↵
- 80.↵
- 81.↵
- 82.↵
- 83.↵
- 84.↵
- 85.↵
- 86.↵
- 87.↵
- 88.↵
- 89.↵
- 90.↵
- 91.↵
- 92.↵
- 93.↵
- 94.↵
- 95.↵
- 96.↵
- 97.↵
- 98.↵
- 99.↵
- 100.↵


