
Abstract
The wealth of genomic data that was generated during the COVID-19 pandemic provides an exceptional opportunity to obtain information on the transmission of SARS-CoV-2. Specifically, there is great interest to better understand how the effective reproduction number Re and the overdispersion of secondary cases, which can be quantified by the negative binomial dispersion parameter k, changed over time and across regions and viral variants. The aim of our study was to develop a Bayesian framework to infer Re and k from viral sequence data. First, we developed a mathematical model for the distribution of the size of identical sequence clusters, in which we integrated viral transmission, the mutation rate of the virus, and incomplete case-detection. Second, we implemented this model within a Bayesian inference framework, allowing the estimation of Re and k from genomic data only. We validated this model in a simulation study. Third, we identified clusters of identical sequences in all SARS-CoV-2 sequences in 2021 from Switzerland, Denmark, and Germany that were available on GISAID. We obtained monthly estimates of the posterior distribution of Re and k, with the resulting Re estimates slightly lower than resulting obtained by other methods, and k comparable with previous results. We found comparatively higher estimates of k in Denmark which suggests less opportunities for superspreading and more controlled transmission compared to the other countries in 2021. Our model included an estimation of the case detection and sampling probability, but the estimates obtained had large uncertainty, reflecting the difficulty of estimating these parameters simultaneously. Our study presents a novel method to infer information on the transmission of infectious diseases and its heterogeneity using genomic data. With increasing availability of sequences of pathogens in the future, we expect that our method has the potential to provide new insights into the transmission and the overdispersion in secondary cases of other pathogens.
Author summary Pathogen transmission is a stochastic process that can be characterized by two parameters: the effective reproduction number Re relates to the average number of secondary cases per infectious case in the current conditions of transmission and immunity, and the overdispersion parameter k captures the variability in the number of secondary cases. While Re can be estimated well from case data, k is more difficult to quantify since detailed information about who infected whom is required. Here, we took advantage of the enormous number of sequences available of SARS-CoV-2 to identify clusters of identical sequences, providing indirect information about the size of transmission clusters at different times in the pandemic, and thus about epidemic parameters. We then extended a previously defined method to estimate Re, k, and the probability of detection from this sequence data. We validated our approach on simulated and real data from three countries, with our resulting estimates compatible with previous estimates. In a future with increased pathogen sequence availability, we believe this method will pave the way for the estimation of epidemic parameters in the absence of detailed contact tracing data.
Introduction
The COVID-19 pandemic prompted an unprecedented global effort in generating and sharing SARS-CoV-2 sequences. As of March 2024, four years after the first sequences were released, over 16 million full-genome sequences have been shared, almost fifty times the estimated number of full-genome flu sequences generated over decades [1]. At the same time, scientists, governments, and public health authorities were keen to make use of all available methods to better understand the ongoing pandemic and implement appropriate responses. For example, information on the transmission dynamics of SARS-CoV-2, that can be characterized by the basic reproduction number R0 and the effective reproduction number Re, was critical to understanding whether current pandemic restrictions were controlling transmission [2]and whether new variants might cause pressure on healthcare systems. As well as estimating Re from the available case-count data [3, 4], the availability of significant numbers of sequences created the opportunity to estimate this, and other parameters, through sequence- and phylogenetic-based methods as well [5–7].
Historically many of these techniques have been developed and applied to study pathogen dynamics in the past or in outbreak conditions when information such as reliable case counts may not be available [8–11]. However, another benefit of utilizing sequences is the ability to estimate parameters that otherwise require a level of detailed data acquisition that is difficult to obtain. A prime example of this is measuring the heterogeneity in transmission, which can be quantified by the dispersion parameter k. Estimating k normally requires knowledge not only of the number of confirmed cases per day, but the number of secondary cases created by individual cases. In a pandemic or epidemic, k quantifies how much spread may be driven by superspreading events, and thus can inform intervention efforts [12–17]. As part of contact-tracing efforts by many countries, estimates of k using clusters of linked cases have been possible, but due to the detailed level of data most require, have generally been limited to use on a few thousand cases and contacts [18–31], or simulated data [32]. In countries where SARS-CoV-2 cases were well-contained and thus had a high probability of being fully-traced, these datasets may be able to capture transmission dynamics well, but particularly as the pandemic has progressed and case numbers have risen, using relatively small subsets may both not fully capture the larger dynamics and may not be completely traced [33]. Using the large number of readily-available SARS-CoV-2 sequences to estimate values such as k could overcome these limitations.
Blumberg and Lloyd-Smith’s (2013) [34] method provides a way to estimate R0 (or Re) and k without requiring contact tracing data, and instead using a transmission chain size distribution. Their framework presumes transmission chains are finite with Re below 1, or in other words, the transmission chain must “stutter out”. This method has been successfully applied to pathogens that spill over from animal reservoirs and don’t lead to sustained human-to-human transmission, such as mpox prior to 2022 and MERS-CoV. In MERS-CoV outbreaks during 2013-2014, multiple spillover events from camels and well-traced transmission chains have resulted in data sets well-suited to estimating R0 and k [35–37]. However, even in instances such as these, where transmission networks are relatively well-recorded, cases may be missed, mis-attributed, or incorrectly considered a part of a transmission chain rather than a separate introduction due to insufficient background case detection. Thus, Blumberg and Lloyd-Smith [38] adapted their method to take into account imperfect case-detection.
In the context of the ongoing COVID-19 pandemic, while individual transmission chains might stop, the state of being in a pandemic implies that overall these chains persist. In the context of the ongoing COVID-19 pandemic, cases can not be readily decomposed into individual limited transmission chains. Instead, transmissions chains aggregate to macroscopic case numbers and the method of stuttering chains by Blumberg and Lloyd-Smith [34] can not be applied. To overcome this limitation, we propose to use clusters of identical sequences as a proxy for transmission chains: even in an ongoing transmission chain, the mutation rate of the virus means that every unique genotype will only exist until the virus mutates and thus is limited in size. To this end, we introduce a new metric, the genomic reproduction number Rg, that relates the reproduction number of cases with identical sequences to the effective reproduction number of cases, Re. During our work, Tran-Kiem and Bedford (2024) [39] published a related study using the same approach.
In this study, we extended the method by Blumberg and Lloyd-Smith [34] and developed a Bayesian framework to infer Re and k from viral sequence data. First, we developed a mathematical model of the size distribution of sequence clusters, in which we integrated viral transmission, the mutation rate of the virus, and incomplete case-detection to capture all aspects of the data-generating mechanism. Second, we implemented this model within a Bayesian inference framework, that we validated using simulated data. Third, we identified clusters of identical sequences in all SARS-CoV-2 sequences in 2021 from Switzerland, Denmark, and Germany that were available on GISAID and applied our method to obtain monthly estimates of Re and k in these countries.
Materials and methods
Data
We downloaded all available SARS-CoV-2 sequences (14.8 million) from GISAID [1] on 7 March 2023. We ran them through the Nextstrain’s ncov-ingest pipeline [40], which provides a list of all nucleotide mutations relative to the Wuhan-Hu-1/2019 reference (Genbank: MN908947) via Nextclade analysis [41]. Sequences identified as being problematic due to divergence issues or variant sequences reported prior to the variant’s origin (date issues) were excluded. We then selected sequences from Switzerland, Denmark, and Germany, three countries with different testing and sequencing strategies resulting in different case-detection and sequencing coverage. The total number of sequences at the start of our analysis was 162,049 for Switzerland, 632,400 for Denmark, and 901,748 for Germany. All sequences are available from GISAID after registration as EPI SET 240326pm for Switzerland, EPI SET 240326mz for Denmark, and EPI SET 240326uh for Germany (see also S1-S3 Tables).
To identify genetically identical sequences efficiently on a large number of sequences, the list of nucleotide mutations was used as a hash key, with sequences with identical hash keys being classified as a cluster. To minimize the chance that sequences with low numbers of mutations, which may have arisen independently, falsely cluster together, only sequences with more than four mutations were used. Due to the mutation rate of SARS-CoV-2, this limitation only impacted sequences at the very start of the pandemic and before our study period, as most lineages had more than four nucleotide mutations by March/April 2020.
Clustering by lists of nucleotide mutations is efficient but imperfect, as sequencing errors such as lack of coverage and use of ambiguous bases can impact whether sequence mutation lists hash identically. We assumed that such errors are randomly distributed through time and thus have minimal effect on the overall cluster size distribution of such a large number of sequences. It’s infeasible to account for all possible sequencing errors, but in an effort to minimize their impact, for all recognised Nextstrain variants, variant-defining mutations as obtained from CoVariants.org [42] were removed and replaced with the variant name. This prevents variant sequences being erroneously separated if they are missing variant-defining mutations. The robustness of the resulting clusters for each country was checked by picking 15 clusters at random, plus the top 10 largest clusters, and identifying them on phylogenetic trees and verifying that the shared mutations appeared only once, forming a monophyletic cluster. The code used for this processing is available at github.com/emmahodcroft/sc2_rk_public.
We grouped the identical sequence clusters into monthly time windows from January to December 2021. We assigned clusters to a given month if at least one sequence was sampled during that month. We focused on this period as the arrival of the SARS-CoV-2 variant of concern (VoC) Alpha in late 2020 led to a scale-up in sequencing efforts in all three countries. Sequencing uptake remained relatively high though 2021 until the arrival of Omicron in late 2021, when a dramatic increase in cases led to a reduction in case ascertainment and sequencing coverage. The number of sequences that were assigned to identical sequence clusters from 1 January 2021 to 31 December 2021 was 96,622 for Switzerland, 267,472 for Denmark, and 355,193 for Germany.
We calculated the sequencing coverage for each month as the ratio of the number of sampled sequences in GISAID over the total number of laboratory-confirmed cases as reported by public health authorities in the respective country. For each country and month we determined among the sequences that have been assigned to identical sequence clusters the number of sequences that have been sampled in the specific month. We directly retrieved daily numbers of newly confirmed cases from public sources of Switzerland [43], Denmark [44] and Germany [45] and summarized them to monthly values. For comparison with our estimates of Re, we also downloaded estimates that were based on laboratory-confirmed cases for all three countries (github.com/covid-19-Re) [7]. To show as additional information in results figures, we retrieved proportions of viral variants among sequences for all three countries on a bi-weekly basis from CoVariants.org [42].
Mathematical model
We derived a model of the size distribution of identical sequence clusters (Fig 1). To this end, we applied branching process theory to viral transmission, with nodes corresponding to cases and connections between two nodes corresponding to transmission events. We assumed that for each node the number of offspring, i.e. the number of persons to whom an infected individual transmitted the virus, is independent and identically distributed. In addition to the viral transmission process, we consecutively took into account both the mutation of the virus and the incomplete case-detection. At each node of the branching process, a mutation of the virus could occur, with a constant probability for all nodes. If this happened, then the mutation was passed on to all secondary cases. The mutation process allowed us to divide the overall transmission tree into multiple smaller transmission trees by the viral genome sequence present at the nodes. From there we obtained a model of the distribution of the size of identical sequence clusters according to the parameters governing viral transmission and mutation. A detailed description of all different steps can be found in section 3 of Supplementary Material S1 Text.

The branching process model creates transmission clusters. Viral mutation splits the transmission clusters into identical sequence clusters. The numbers indicate the size of the observed identical sequence clusters, i.e. the number of cases in the clusters that were tested and sequenced.
This approach allowed us to adapt a method previously developed by Blumberg and Lloyd-Smith [34] to estimate Re and k from the distribution of cluster size to our specific case involving the size of identical sequence clusters. This method assumes a negative binomial distribution for the number of secondary cases with mean Re (interpreted as the average number of secondary cases per infectious case in the current conditions of transmission and immunity) and dispersion parameter k (lower values implying more dispersion, and thus more superspreading events). In each secondary case, the probability that the virus will mutate was defined as:
 where M is the expected number of nucleotide mutations observed in a SARS-CoV-2 genome per year and D the mean generation time. For a within-variant rate of 14 mutations per year [46] and a mean generation time of 5.2 days [47], the probability of mutation for each case is 18.1%. Since a new mutation splits the transmission clusters, we introduced a new metric, the genomic reproduction number:
 that is related to the effective reproduction number of cases Re and corresponds to the average number of secondary cases within a given identical sequence cluster. Since the number of secondary cases follows a negative binomial distribution with mean Re and dispersion parameter k, the number of secondary cases that belong to the same identical sequence cluster as their source case also follows a negative binomial distribution with mean Rg and dispersion parameter k.
As a last step, we incorporated incomplete case-detection assuming an independent observation process [38]. We computed the probability that a case was detected as the product of the probability that a case was confirmed by a test and the probability that the viral genome of a confirmed case was sequenced.
Bayesian inference
We developed a Bayesian inference framework to estimate the model parameters from the size distribution of identical sequence clusters and implemented in Stan, a probabilistic modeling platform using Hamiltonian Monte Carlo methods [48]. We used weakly-informative prior distributions for Re, k, and the testing probability and an informative prior distribution for the yearly mutation rate M. The mean generation time and the sequencing probability were taken as fixed values. We estimated Re, k, and the testing probability for monthly time windows from January to December 2021. The posterior samples were summarized by their mean and 95% credible interval (CrI). More details can be found in sections 4 and 6 of Supplementary Material S1 Text. The R and Stan code files are provided within the R package estRodis, available on the following GitHub repository: github.com/mwohlfender/estRodis.
Simulations
We conducted a simulation study to validate the model. We generated data of identical sequence clusters for different parameter combinations of Re, k, and the testing and sequencing probability. To this end, we performed stochastic simulations of transmission using branching processes and then applied mutation and incomplete case-detection. Cases with an identical sequence were grouped in a cluster. We subsequently applied our inference framework to the simulated data and compared the mean of the posterior distribution of the estimated parameters to the true values using the root mean squared error and coverage of the true value by the 95% CrI of the posterior distribution (Supplementary Material S1 Text, section 5).
Results
Based on the new metric of the genomic reproduction number Rg, we developed a Bayesian inference model to estimate Re, k, and the testing probability from data on the size distribution of identical sequence clusters. We validated this model using simulated data and investigated how combinations of Re, k, the testing probability, and the sequencing probability could be accurately recovered. To this end, we ran 10 rounds of simulation of 3,000 identical sequence clusters for 240 parameter combinations (Fig 2). Generally, we found that the error between the true and estimated values of Re and k is minimized for higher testing and sequencing probabilities. Our method provided reliable estimates of Re and k as long as Re was below 1.2 (i.e., Rg is below 1 given our assumption for the mutation rate, Fig 2 A and B). When Re was set to 1.3 (so that Rg is above 1), the inference model could not reliably recover the true value anymore. Overall, the validation showed that our model can be used to estimate Re and k in specific settings.

A: Error in estimating the effective reproduction number Re. B: Error in estimating the dispersion parameter k. Error is measured by the root mean squared error (RMSE) between the true value and the estimated mean of the posterior distribution. For each parameter combination, we ran the model 10 times on 3,000 simulated clusters each.
We identified clusters of identical SARS-CoV-2 sequences using real-world sequencing data from Switzerland, Denmark, and Germany. From a total of 96,622 sequences from Switzerland, 267,472 from Denmark, and 355,193 from Germany, we identified 58,587, 84,537 and 218,497 clusters of identical sequences, respectively. Small clusters dominated the distribution of cluster size, with 79.7%, 70.8%, and 79.4% of the clusters being of size one in Switzerland, Denmark, and Germany, respectively. The mean cluster size was 1.65 in Switzerland, 3.16 in Denmark, and 1.63 in Germany, which suggests a higher probability of testing and/or sequencing in Denmark compared to the other countries. The sequencing coverage for laboratory-confirmed SARS-CoV-2 cases indeed differed substantially between the three countries over time, with an average sequencing coverage of 10.4% for Switzerland, 38.2% for Denmark, and 6.4% for Germany over 2021. The number of clusters and the mean of the cluster size also varied by month (Fig 3).

A: Range, mean, 90th percentile and 99th percentile of the identical sequence cluster size distribution and number of clusters by month based on data from GISAID. B: Sequencing coverage (dots) and proportion of SARS-CoV-2 variants (background colour) by month.
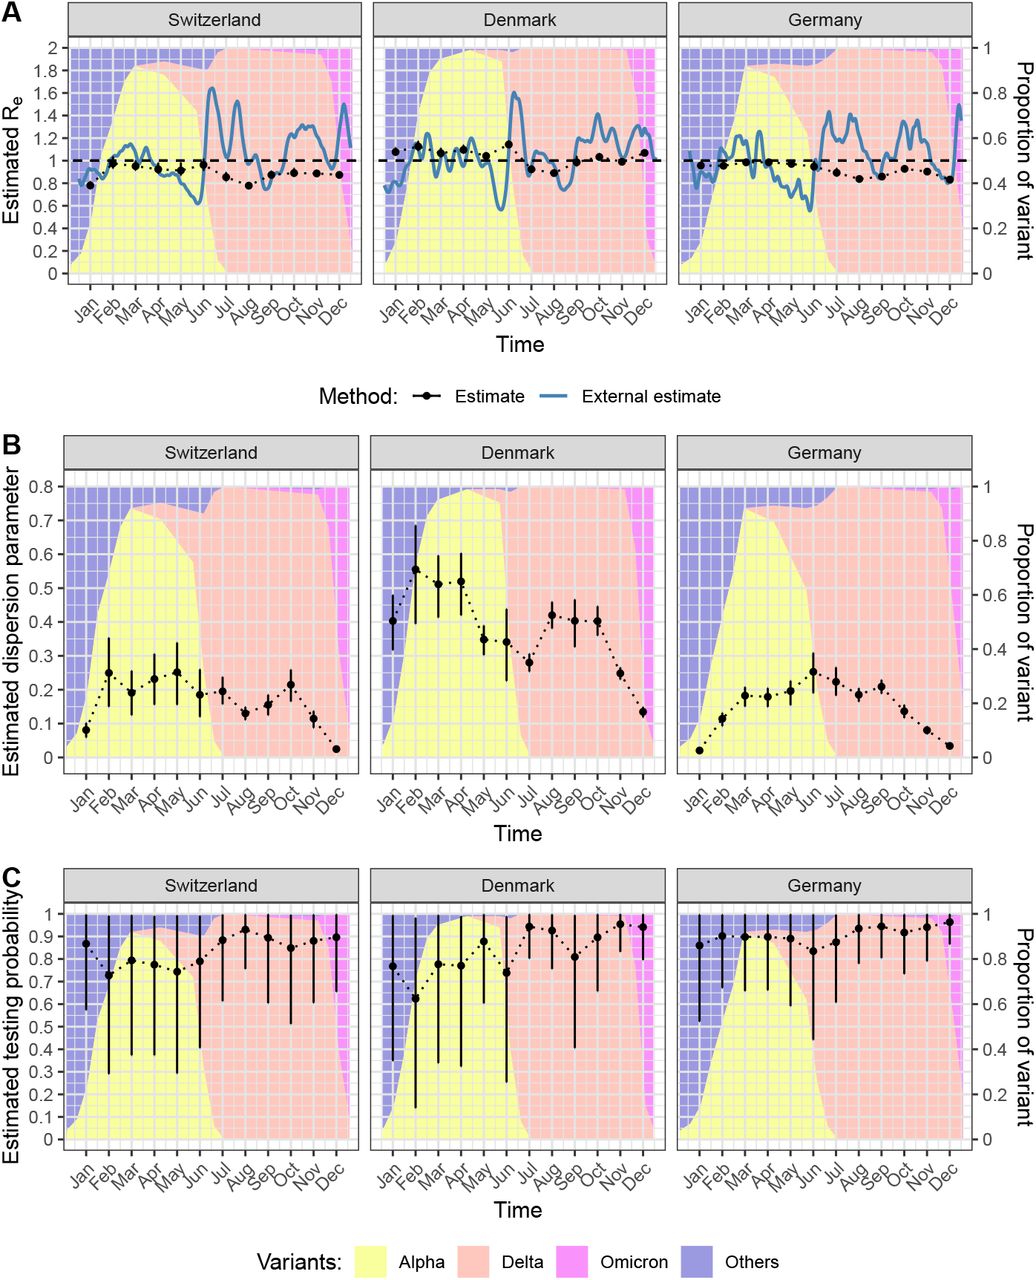
We applied the model to the size distribution of identical sequence clusters to obtain monthly estimates of Re, k, and the testing probability for SARS-CoV-2 in Switzerland, Denmark, and Germany (Fig 4). The estimated Re values per month for each country across 2021 generally remained below 1, though the values did fluctuate through the year (Fig 4A). The average Re value for Switzerland, Denmark, and Germany was 0.89 (95% credible interval, CI: 0.76-1.00), 1.04 (95% CI: 0.88-1.16), and 0.92 (95% CI: 0.83-1.00), respectively. The estimates of Re come with narrow credible intervals. This might be due to the structure of the posterior probability, being highly concentrated around the most likely estimate. Due to the relatively large time window of one month, the underlying trends in Re as estimated based on laboratory-confirmed cases were not captured consistently using our new method based on identical sequence clusters, notably at time points with transitions between SARS-CoV-2 variants.

A: Effective reproduction number Re. B: Dispersion parameter k. C: Testing probability. The estimates are based on monthly time windows of identical sequence clusters. For each month are shown the mean posterior distribution and the 95% credible interval (in black). Re values are compared to external estimates based on laboratory-confirmed cases (in blue, from github.com/covid-19-Re) [7])
Our estimates of the dispersion parameter k varied between the different countries, with average estimates over the 12 month period of 0.17 (95% CI: 0.02-0.30) for Switzerland, 0.38 (95% CI: 0.13-0.60) for Denmark, and 0.15 (95% CI: 0.02-0.27) for Germany. Estimates of k were highest in Denmark, fluctuating around 0.3 to 0.5 from January to October before dropping at the end of the year. Depending on the country and month, the estimates of k have narrower or wider credible intervals. In Switzerland and Germany, the estimates of k were generally lower with values around 0.1 to 0.3 and also dropped at the end of the year. The transition from Alpha to Delta was not associated with a substantial change in the estimates of k.
The estimated testing probability was relatively high and came with more uncertainty. This indicates that the testing probability cannot be precisely estimated from the size distribution of identical sequence clusters using our Bayesian inference model. Thus, we conducted a sensitivity analysis where the testing probability was fixed at 57.6% from January to August 2021 and at 35% from September to December 2021, based on estimates of the case ascertainment using swab positivity in England [49]. This did impact Re and k estimates to a small degree, generally increasing Re estimates slightly and decreasing k estimates slightly (Supplementary Material S1 Text, section 7).
Discussion
We developed a novel Bayesian model to estimate the effective reproduction number, Re, and crucially the level of superspreading of an epidemic from viral sequence data, k. To this end, we introduced a new metric, the genomic reproduction number, Rg, the mean number of secondary cases created by an infected individual that share the same viral genome. Rg is therefore the analogue of Re in the context of clusters of identical sequences. We applied our model to the size distribution of identical sequence clusters of SARS-CoV-2 in Switzerland, Denmark, and Germany in 2021. We obtained monthly estimates of Re around or below the epidemic threshold of 1. The estimates of the dispersion parameter k varied substantially by country and month and were typically between 0.1 and 0.5. Together, our study illustrates how the increasing amount of viral sequence data can be used to inform epidemiological parameters of SARS-CoV-2 and potentially other pathogens.
The main strength of our study is the presentation of a new method to estimate epidemiological parameters, specifically the overdispersion in the number of secondary cases, from viral sequence data alone. While Re can often be reliably estimated from counts of laboratory-confirmed cases as well, estimating k has historically been considerably more challenging since it requires either direct information about transmission chains or clusters. With the novel method presented here, this challenge can be overcome through making use of the large number of sequences available for SARS-CoV-2. In addition, our method uses a computationally efficient way to identify clusters of identical sequences without the need to reconstruct very large phylogenies. Finally, the Bayesian inference model allows a full propagation of the uncertainty in the viral transmission parameters, the mutation rate, and the incomplete case-detection.
Our study comes with a number of limitations. First, the presented method requires a large amount of sequence data and a relatively high case ascertainment to obtain reliable estimates of epidemiological parameters. We expect such data sets to become more common with further technological developments in diagnostics and sequencing, in particular for outbreaks and epidemics of emerging infectious diseases. Second, miscalls in sequences, such as reversions to a reference sequence, might have resulted in some clusters that are artificially separated or combined. We countered this problem to a certain extent by replacing variant-defining sequences with the variant name. For the remaining sequences, we expect that miscalls would have only little impact on the overall cluster size distribution and the parameter estimates. Third, we assumed an independent observation process, i.e., infected cases are detected randomly and tested cases are sequenced at random. However, testing and sequencing uptake might cluster in certain settings, such as during contact tracing and outbreak investigations. Lastly, we did not consider changes in the mutation rate and the generation time during the study period, which could have led to different ratios between Re and Rg, especially for different SARS-CoV-2 variants.
Our estimates of Re were not able to fully capture the observed changes when Re is estimated from laboratory-confirmed cases. This could be a result of our assumption to assume a fixed time window (months) for which we estimated averaged epidemiological parameters during an ongoing epidemic. This introduces potential biases due to left and right censoring. On the one hand, we partly circumvented this problem by assigning identical sequence clusters to a given month if at least one sequence was sampled during that month. On the other hand, this has the disadvantage that we included clusters in our analysis that can span much longer time periods than one month and that cover different epidemic phases with widely different values of Re. Furthermore, the transition periods from one SARS-CoV-2 variant to another pose an additional challenge to our inference method, as by definition sequence clusters cannot span over these transitions. Thus, it is not surprising that our method cannot capture the rapid changes of Re and its rise after the arrival of new variants, such as the growth of Delta and Omicron in June and December 2021, respectively. The issue with left and right censoring also means that our method cannot reliably estimate Re when the genomic reproduction number Rg is above 1, i.e., when some clusters can grow - in theory - indefinitely. Together, these limitations can explain why our estimates of Re seemed to fluctuate around the epidemic threshold of 1, which corresponds to the long-term average of an ongoing epidemic.
In contrast, the estimates of k (range: 0.15-0.38) that we obtained with our new method fit well within the range of previous estimates for SARS-CoV-2 [18–32]. Interestingly, k was considerably higher in Denmark compared to Switzerland and Germany, indicating fewer superspreading events. While Switzerland and Germany had similar levels of testing uptake and laboratory-confirmed cases during most of 2021, the testing uptake in Denmark was considerably higher while the number of laboratory-confirmed cases was similar to the other countries. This suggests a higher case ascertainment and a better control of SARS-CoV-2 transmission in Denmark, which could have led to fewer opportunities for superspreading events and, as a consequence, higher values of k. Using a similar methodology, Tran-Kiem and Bedford [39] estimated k at 0.63 (95% confidence interval: 0.34-1.56) in New Zealand, which is somewhat higher than our estimates. Again, this can be explained by the fact that they analyzed sequence clusters during a period when there was a high level of transmission control with little opportunities for superspreading events. Lastly, it remains unclear how our estimates of k were affected by the left and right censoring of clusters, but the relatively low estimates in January and December 2021 could be impacted by the early spread of Alpha and Omicron. Another potential explanation is that superspreading events may favoured by indoor gathering during winter periods.
The vast amount of genomic data that was generated during the pandemic provides novel opportunities to characterize and track the transmission dynamics of SARS-CoV-2. Our newly developed Bayesian model to infer epidemiological parameters from the size distribution of identical sequence clusters can reliably estimate the level of superspreading through the dispersion parameter k and has the potential to inform about Re, albeit with some practical limitations for the latter. With the increasing affordability and ease of sequencing, we expect that large volumes of sequence data will become more readily available in the future, making it possible to adapt this method to other pathogens and to estimate the transmission heterogeneity in different countries, for different variants, and over time.
Data Availability
Sequence data are available via GISAID after registration, and are available in EPI_SET_240326pm (doi.org/10.55876/gis8.240326pm) for Switzerland, EPI_SET_240326mz (doi.org/10.55876/gis8.240326mz) for Denmark, and EPI_SET_240326uh (doi.org/10.55876/gis8.240326uh) for Germany; see also the supplementary tables 1-3. Code to generate identical sequence clusters from the starting alignments is available via github.com/emmahodcroft/sc2_rk_public. Functions for estimation of parameters and simulation of identical sequence clusters are available via the R package estRodis github.com/mwohlfender/estRodis. Code used for the analysis of data and results as well as the creation of plots and tables is available via github.com/mwohlfender/R_overdispersion_cluster_size.
http://doi.org/10.55876/gis8.240326pm
http://doi.org/10.55876/gis8.240326mz
http://doi.org/10.55876/gis8.240326uh
https://github.com/emmahodcroft/sc2_rk_public
https://github.com/mwohlfender/estRodis
https://github.com/mwohlfender/R_overdispersion_cluster_size
Supporting information
S1 Text. Additional results, figures and tables.
S1 Table. GISAID EPI SET Table 1 - Switzerland
S2 Table. GISAID EPI SET Table 2 – Denmark
S3 Table. GISAID EPI SET Table 3 - Germany
Funding
EH, RH, and CA were supported or received funding by the Swiss National Science Foundation (No 196046). MW, JR, and CA were supported or received funding by the Multidisciplinary Center for Infectious Diseases, University of Bern, Bern, Switzerland. JR was supported by the Swiss National Science Foundation (No 189498). CA received funding from the European Union’s Horizon 2020 research and innovation program - project EpiPose (No 101003688). This project was supported by the ESCAPE project (101095619), funded by the European Union. Views and opinions expressed are however those of the author(s) only and do not necessarily reflect those of the European Union or European Health and Digital Executive Agency (HADEA). Neither the European Union nor the granting authority can be held responsible for them. This work was funded by UK Research and Innovation (UKRI) under the UK government’s Horizon Europe funding guarantee (grant number 10051037). This work has received funding from the Swiss State Secretariat for Education, Research and Innovation (SERI) under contract number 22.00482. EH was supported by a Swiss National Science Foundation Starting Grant (TMSGI3 211225).
Data and Code Availability
Sequence data are available via GISAID after registration, and are available in EPI_SET_240326pm (doi.org/10.55876/gis8.240326pm) for Switzerland, EPI_SET_240326mz (doi.org/10.55876/gis8.240326mz) for Denmark, and EPI_SET_240326uh (doi.org/10.55876/gis8.240326uh) for Germany; see also the supplementary tables 1-3.
Code to generate identical sequence clusters from the starting alignments is available via github.com/emmahodcroft/sc2_rk_public. Functions for estimation of parameters and simulation of identical sequence clusters are available via the R package estRodis github.com/mwohlfender/estRodis. Code used for the analysis of data and results as well as the creation of plots and tables is available via github.com/mwohlfender/R_overdispersion_cluster_size
Acknowledgments
We gratefully acknowledge all data contributors, i.e., the authors and their originating laboratories responsible for obtaining the specimens, and their submitting laboratories for generating the genetic sequence and metadata and sharing via the GISAID Initiative, on which this research is based. We also gratefully acknowledge and thank all labs around the world that have collected and shared SARS-CoV-2 sequences we used in our study, and in particular the labs in Switzerland, Germany, and Denmark, where the sequence data for this study originated. A complete list of the labs that generated the data we used from GISAID can be found in at the EPI SETs.
We additionally thank Pierre-Yves Boëlle for valuable feed-back on the project and for the suggestion to validate the compatibility of the simulation of identical sequences with cluster data from Switzerland, Denmark and Germany by a posterior predictive check. We also thank Eugenio Valdano for a stimulating discussion of the project and his advice on how to assign clusters of identical sequences to months. Calculations were performed on UBELIX (www.id.unibe.ch/hpc), the HPC cluster at the University of Bern.
References


