
Abstract
Group-level differences in brain macrostructure between individuals at risk for psychosis and healthy controls have been well documented. However, while differences in cortical grey/white matter contrast (GWC), likely reflecting differences in myelin content, have been reported in clinical populations with psychotic disorders, no studies have explored GWC in individuals at elevated risk for psychosis. In this study, we explored whether brain microstructure, as measured with GWC, differs between young adults who endorsed psychotic experiences or genetic high risk for psychosis and healthy controls, and whether individual differences in GWC in at-risk individuals are associated with the number and psychotic experiences. The sample included individuals from two magnetic resonance imaging (MRI) substudies of the Avon Longitudinal Study of Parents and Children (ALSPAC): the psychotic experiences study and the schizophrenia recall-by-genotype study. The final sample included four groups of young adults 19-24 years old: individuals endorsing psychotic experiences (n=119) and health controls (n=117) and individuals with high (n=95) and low genetic risk for psychosis (n=95). Statistical analyses were performed using FSL’s Permutation Analysis of Linear Models (PALM), controlling for age and sex. The results showed no statistically significant differences in GWC between any of the groups and no significant associations between GWC and the number and experiences of psychotic experiences. In conclusion, the results indicate that GWC is not a sensitive neuroimaging marker for psychosis risk in young adults.
1. Introduction
Magnetic resonance imaging (MRI) studies have documented group-level brain structural and microstructural differences between individuals with psychotic disorders and healthy controls (Birur et al. 2017; Bose et al. 2009; Ching et al. 2022; Falkai, Schmitt, and Andreasen 2018; Schmidt et al. 2016; Andreassen et al. 2023; Haukvik et al. 2018; Hibar et al. 2018). However, whether these differences represent risk factors or develop together with the disorder or in relation to medication is not well understood. Studies of individuals at risk, whether it be a genetic risk or individuals who endorse subclinical psychosis symptoms, can provide new insights into developmental processes in psychotic disorders. In the present study, we utilized a state-of-the-art MRI-based signal intensity measure, gray/white matter contrast (GWC), and explored brain microstructure in young adults with genetic high risk or those endorsing psychotic experiences in comparison to healthy controls. Additionally, we tested whether individual differences in GWC in these risk groups were related to the number of psychotic experiences.
Patients with schizophrenia and bipolar disorder have been found to have subtle structural brain differences in comparison to healthy controls. Both groups on average show lower cortical volume, with a greater reduction in volume in schizophrenia affecting frontal, temporal and occipital regions(Madre et al. 2020; Rimol et al. 2012). Patients with schizophrenia also show widespread thinner cortex and smaller cortical surface area, with the largest effects in the frontal and temporal region (van Erp et al. 2016), while patients with bipolar disorder predominantly show thinner cortex, but not smaller surface area, in comparison to healthy controls (Hibar et al. 2018; Madre et al. 2020). Patient groups also show, on average, larger ventricles, and smaller bilateral hippocampi and left thalamus (Haukvik et al. 2018; Hibar et al. 2018; van Erp et al. 2016), although patients with schizophrenia appear to have smaller hippocampal and amygdala volumes and larger right putamen volume in comparison to patients with bipolar disorder (Haukvik et al. 2018; Ohi et al. 2022; van Erp et al. 2016).
One way to examine whether the differences observed in brain structure in patients with psychotic disorders exist before the onset of the disorder is to study individuals at elevated risk for developing psychosis (Paolo Fusar-Poli 2017). Individuals can be considered at high genetic risk for developing a psychotic disorder, defined by familiar risk (Smieskova et al. 2010) or by having common or rare genetic variants linked to psychotic disorders (Karayiorgou, Simon, and Gogos 2010). Individuals who endorse psychotic experiences (PE) from the general population or help-seeking individuals who do not meet diagnostic criteria for a psychotic disorder are also considered at increased risk for developing psychosis (Paolo Fusar-Poli 2017; Modenato et al. 2021; Yung et al. 1996; Jalbrzikowski et al. 2021; Drakesmith et al. 2015).
It has been estimated that monozygotic twins of patients with a psychotic disorder have a 40-50% lifetime risk of psychotic disorders and first-degree relatives of patients with schizophrenia have been estimated to have a 10-fold increased risk for later illness (Smieskova et al. 2010). Familial risk for schizophrenia has been associated with smaller brain volumes and lower cortical thickness relative to subjects from low-risk families (Chan et al. 2011; Ivleva et al. 2013; Zwarte et al. 2019). Genetic risk can also be studied using polygenic risk scores (PRS). The PRS is a result of a large number of common genetic variants that are likely contributing to a disorder (Ripke et al. 2014). Each variant has a small effect, but by combining them one can derive a score with larger predictive power (Choi, Mak, and O’Reilly 2018). These PRSs can be calculated in unaffected individuals to study the role of disease genetics (Daetwyler, Villanueva, and Woolliams 2008). High PRS for schizophrenia has in healthy adults been associated with lower cortical thickness in lateral orbitofrontal, inferior frontal, and posterior cingulate regions (Zhu et al. 2021). Contrary to these findings, however, a meta-analysis (van der Merwe et al. 2019) did not find any significant associations between PRS for schizophrenia and grey matter volume, white matter volume, globus pallidus volume and total brain volume.
The risk of developing a psychotic disorder ranges from 41% to 54% within one year and 18% to 20% within two years among individuals with clinical high risk for psychosis (CHR) (Paolo Fusar-Poli 2017; Paolo Fusar-Poli et al. 2015; 2020; Jalbrzikowski et al. 2021). A large body of work has used MRI to investigate brain structural differences in individuals at CHR for psychosis (Chung et al. 2019; Del Re et al. 2021; Fornito et al. 2008; P. Fusar-Poli et al. 2011; Iwashiro et al. 2012; Klauser et al. 2015; Koutsouleris et al. 2009; Kwak et al. 2019; Mechelli et al. 2011; Sun et al. 2009; Takayanagi et al. 2017; Tomyshev et al. 2019; Velakoulis et al. 2006; Ziermans et al. 2009; Zikidi et al. 2020). The largest to-date study of CHR individuals found that in comparison to healthy controls, individuals with CHR showed widespread lower cortical thickness, but no differences in surface area or subcortical volumes (Jalbrzikowski et al. 2021). Moreover, CHR individuals who later developed a psychotic disorder had lower cortical thickness in paracentral, superior temporal and fusiform regions in comparison to both CHR individuals who did not develop psychosis and healthy controls (Jalbrzikowski et al. 2021). Similar structural differences have been found among young adults who endorse psychotic experiences. Studies have found group-level differences in brain microstructures such as fractional anisotropy, an indication of disturbed white matter microstructure among these individuals compared to those healthy control (Peters and Karlsgodt 2015; Smigielski et al. 2022; León-Ortiz et al. 2022; Drakesmith et al. 2016) Differences in grey matter volume in the left supramarginal gyrus (Drakesmith et al. 2015) and greater brain volume in the middle frontal gyrus into the superior frontal gyrus in individuals with persistent psychotic experience have been reposted (Fonville et al. 2019). However, another study did not find any differences in gray matter volume in a whole-brain analysis (Fonville et al. 2015).
Although the studies discussed above indicate that differences in brain microstructure exist prior to the onset of psychotic disorders, newer and less explored MRI signal intensity measures can provide additional information about brain microstructure, including the small tissue subcomponents that together make up the gross shape or macrostructure of the brain (Norbom et al. 2019). One such approach is to compute a GWC measure from intensities sampled across the cortical mantle and within closely subjacent white matter (Salat et al. 2009), where higher GWC indicates a greater discrepancy between grey and white matter. GWC may potentially improve the sensitivity to detect differences between individuals at risk for psychosis and healthy controls. Further, it might offer increased biological specificity of the findings, as GWC is presumed to be a proxy measure for differences in intracortical and subjacent white matter myelin content (Eickhoff et al. 2005; Salat et al. 2009; Stüber et al. 2014). During childhood and adolescence, GWC shows an age-related decrease, thought to partly reflect protracted intracortical myelination (Norbom et al. 2019). Only a few studies to date have used GWC to examine brain microstructure in patients with psychotic disorders (Jørgensen et al. 2016; Kong et al. 2012; 2015; Chwa et al. 2020), while no studies have examined GWC in psychosis risk groups. A study by Jørgensen et al. (2016) included adults with schizophrenia, bipolar disorder and healthy controls found higher GWC in pre- and postcentral gyri, the transverse temporal gyri, posterior insula, and parieto-occipital regions in patients with schizophrenia. They also found higher contrast primarily in the left precentral gyrus in patients with bipolar disorder, but no significant differences between the two patient groups. Jørgensen et al. (2016) also found that increased GWC was associated with increased severity of hallucinations in patients, but no associations for delusions or medication. A study by Chwa et al. (2020) similarly showed, that in comparison to healthy controls, individuals with schizophrenia had higher GWC in the right superior frontal lobe encompassing the sensorimotor region. Additionally, they observed an association between lower GWC and increased exposure to second-generation antipsychotics within the superior frontal lobes. A large population-based study of youth by Norbom et al. (2019) also found that increased GWC was associated with more psychosis-spectrum symptoms. Contrary to results from these three studies, Kong et al. (2012) compared GWC in a small sample of adult patients with schizophrenia and healthy controls and observed lower GWC in the patient group in large portions of the cortex, including frontal, temporo-parietal and lateral occipital regions. In a follow-up study, Kong et al. (2015) also found lower regional GWC in the patient group. In sum, the three largest existing studies indicate increased GWC primarily in highly myelinated sensory and motor regions in patients with schizophrenia and increased GWC is associated with increased psychosis spectrum symptoms, although discrepant findings have also been reported. Thus, our understanding of the progressive effect these disorders have on GWC is limited and no studies to date have examined GWC in individuals with genetic risk for psychosis or those who endorse psychotic experiences.
The present study aimed to explore differences in brain microstructure before the onset of psychotic disorders by comparing GWC between young adults with genetic risk or those endorsing psychotic experiences and healthy controls. We hypothesized to see regionally higher GWC in the psychotic experience group in comparison to healthy controls, based on the to-date largest studies of GWC in patients with schizophrenia and those endorsing psychosis spectrum symptoms (Chwa et al. 2020; Jørgensen et al. 2016; Norbom et al. 2019). To our knowledge, there is a lack of research on GWC in groups with genetic risk for psychosis, but previous studies have found limited evidence for associations between PGS for schizophrenia and brain macrostructure (Lancaster et al. 2019a; Papiol et al. 2014; van der Merwe et al. 2019), thus, we hypothesized that there would be no significant difference in GWC between the high genetic risk group and the low genetic risk group. We also hypothesized regionally higher GWC in the group of individuals who endorsed psychotic experiences relative to the genetic risk group. Finally, we hypothesized that individual differences in the number of psychotic experiences would be positively associated with the GWC psychotic experiences group, based on findings from a previous study observing a positive association between hallucination symptoms and GWC in patients with psychotic disorders (Jørgensen et al. 2016). We did not expect to observe a significant association between GWC and psychotic experiences in the genetic risk group since previous studies have reported no association between PRS for schizophrenia and psychotic symptoms (Jones et al. 2016; Lancaster et al. 2019a). Overall, the study aimed to provide new insights into the neural underpinnings of risk for psychotic disorders and examine whether previously reported differences in GWC in patients represent risk factors or are more likely to develop later in the course of the disorders.
2. Experimental procedures
2.1 Sample
The data for this study is from the Avon Longitudinal Study of Parents and Children (ALSPAC) study at the University of Bristol (see (Golding, Pembrey, and Jones 2001), for more information). Pregnant women residents in Avon, UK with an expected date of delivery between 1st April 1991 and 31st December 1992 were invited to take part in the ALSPAC study. The initial number of pregnancies enrolled was 14,541 and 13,988 children were alive at 1 year of age. When the oldest children were approximately 7 years of age, an attempt was made to bolster the initial sample while eligible cases who had failed to join the original study. The total sample size for analysis using any data collected after the age of seven is therefore 15,447 pregnancies and 14,901 children alive at 1 year of age. Data of 14,822 unique women (G0 mothers) were enrolled in ALSPAC as of September 2021 (Boyd et al. 2013; Fraser et al. 2013).
We used magnetic resonance imaging (MRI) and clinical data from two substudies (Sharp et al. 2020; Northstone et al. 2019). The first substudy, the Psychotic Experiences (PE) study, consisted of young adults having experienced at least one definitive or suspected psychotic experience during the past 6 months at the age of 17-18 years, as assessed with the clinical interview the psychotic-like symptoms semi-structured interview (PLIKS) and healthy control. From 4,323 participants with available data, 252 individuals were recruited for MRI scanning between ages 21 and 24 years as part of this study; 126 individuals with a history of psychotic experience and 126 healthy controls with no reported psychotic experiences. The second substudy, the schizophrenia recall-by-genotype (SZP-RbG) study, included young adults with high or low genetic risk for schizophrenia, as defined by the polygenic risk score (PRS). Genotyping was done by subcontracting the Wellcome Trust Sanger Institute, UK and the Laboratory Corporation of America, Burlington, NC. The genetic risk scores for schizophrenia were derived from Plink (version 1.07; as described elsewhere, (Lancaster et al. 2019b)) which summed together the number of risk alleles for each single nucleotide polymorphism (SNP) using the Psychiatric Genomics Consortium summary statistics (PGC) SCZ genome-wide association studies (GWAS) using the methods described by the international Schizophrenia Consortium. Out of 8,653 participants with available genotype data, 196 individuals were recruited for MRI scanning between the ages of 19 and 21 years as part of this study: 98 with a high genetic risk score for schizophrenia and 98 with a low genetic risk for schizophrenia. Researchers were blinded to which tail of the genetic risk score for schizophrenia distribution participants were selected from during both data collection and processing. Before analyses, we excluded duplicates from the PE subsample (n=6). Further details on the samples after MRI quality control (section 2.4), are reported in Table 1.
Written informed consent was collected from all participants. Ethical approval for all neuroimaging studies was obtained from the ALSPAC Ethics and Law Committee and the Local Research Ethics Committees. Consent for biological samples has been collected in accordance with the Human Tissue Act (2004). The current study was conducted in line with the Declaration of Helsinki and was approved by the Norwegian Regional Committee for Medical and Health Research Ethics (REK 269241).
2.6 MRI acquisition
All the neuroimaging data were acquired at Cardiff University Brain Research Imaging Center (CUBRIC) on the same 3 Tesla General Electric HDx scanner (GE Medical Systems) using an 8-channel head coil. The T1-weighted structural images were obtained using an FSPGR sequence (1 mm isotropic resolution, TR = 7.8/7.9 ms, TE = 3.0 ms, TI = 450 ms, flip angle = 20°) for both MRI substudies. Participants were instructed to have a typical night’s sleep before each scan, not to drink more than one alcoholic beverage and to abstain from drinking coffee within 2 hours preceding the scan (Sharp et al. 2020).
2.7 MRI processing
FreeSurfer (version 7.3.2) was used to process the T1-weighted images via the ‘recon-all’ command including the -qcache flag. This automated pipeline includes removal of non-brain tissue, voxel intensity correction for B1 field inhomogeneities, segmentation of voxels into white matter, grey matter or cerebral spinal fluid and generation of surface-based models of white and grey matter (Fischl 2012).
We sampled signal intensities for each participant from the nonuniform intensity normalized volume (nu.mgz) using the FreeSurfer function mri_vol2surf. For each vertex, gray matter intensities were sampled at six equally spaced points. White matter intensities were sampled at each vertex at 10 equally spaced points, starting from the gray/white boundary and ending at a fixed distance of 1.5 mm into white matter. We calculated the average intensity value for each tissue type to obtain single separate measures of gray and white matter intensity per vertex. GWC was then computed as 100X(white - gray)/[(white+gray)/2], such that a higher value reflects a greater difference between cortical gray matter and white matter signal intensities.
2.8 MRI quality control
For MRI quality control, we performed a manual rating of reconstructed images following the ENIGMA consortium protocol. Visual inspection of the cortical external parcellation and cortical internal parcellation was performed for all the participants. Images were inspected separately for the cortical parcellation and the internal parcellation and were rated a “pass”, “moderate”, or “fail” quality. Fail level of scoring was defined as the presence of motion or other artefacts that significantly compromised image quality. For our analyses, focusing on GWC, we used the cortical quality control ratings. Three subjects in the PE substudy failed the cortical quality control, and three subjects in the SCZ-RbG substudy failed the quality control. These subjects were excluded from all analyses.
2.9 Clinical assessment
Psychotic experiences were assessed using PLIKS. PLIKS is a semi-structured interview which consists of 12 core questions covering the past 6-month occurrence of hallucinations, delusions, and experience of thought interference. Seven of the 12 core questions were derived from DISC-IV and five from section 17 of the Schedules for Clinical Assessment in Neuropsychiatry (SCAN) version 2.0. Clinicians rate the symptoms as either not present, suspected, definitely present, not relevant, or refused to answer. Study data were collected and managed using REDCap electronic data capture tools hosted at the University of Bristol. REDCap (Research Electronic Data Capture) is a secure, web-based software platform designed to support data capture for research studies (Harris et al. 2009). For our analyses of associations between GWC and psychotic experiences within at-risk groups, we included three PLIKS measures from interviews conducted around age 24 years (mean = 24.2, SD = 0.7): 1) the total number of psychosis-like symptoms, 2) whether the young person ever had experienced none, suspected, or definite psychosis-like symptoms, including a distinction between ‘definite non-clinical’ and ‘definite clinical’ diagnoses before age 24, and 3) whether the young person has none, suspected, or definite psychosis-like symptoms within the past 6 months at age 24, including a distinction between ‘definite non-clinical’ and ‘definite clinical’ diagnoses. Please note that the study website contains details of all the data available through a fully searchable data dictionary and variable search tool (Bristol, n.d.).
2.10 Statistical analysis
All statistical analyses were performed using the nonparametric statistical tool Permutation Analysis of Linear Models (PALM) in FSL (6.0.0) (Alberton et al. 2020). To correct for multiple comparisons, we used a false discovery rate (FDR) set at 5%. In the first set of analyses, we used general linear models to examine the effect of group on vertex-wise GWC, controlling for sex assigned at birth and age at the time of scan. Three separate analyses were performed to examine if there were group differences in GWC. First, we examined differences in GWC between the young adults who endorsed psychotic experiences and healthy controls in the psychotic experiences study. Second, we examined if there were any differences in GWC between young adults in the high genetic-risk group and the low genetic-risk group in the SCZ-RbG study. Third, we examined if there were differences in GWC between the young adults who endorsed psychotic experiences and the genetic high-risk group, excluding individuals who were part of both groups (n=11).
In the second set of analyses, general linear models were used to examine if the number of psychotic experiences (i.e., psychotic experiences before age 24, and psychotic experiences in the past six months) were associated with vertex-wise GWC within the young adults with psychotic experience and the genetic high risk group, respectively, controlling for sex and age at scan. The number and experiences of the psychotic experiences were z-transformed prior to the analyses.
2 Results
3.1 Demographics
The demographics and clinical characteristics of the samples are summarized in Table 1. The number of female participants was larger in both risk groups and healthy control. Participants in the psychotic experience group endorsed more psychotic experiences than participants in the high-genetic-risk group. Please see Figure 1 for the distribution of psychotic experiences and age for all the groups.

Distribution of the number of symptoms and age for the health controls (HC), psychotic experience group (PE), high genetic risk group (HGR), and low genetic risk group (LGR).
3.2 Group differences in grey/white matter contrast
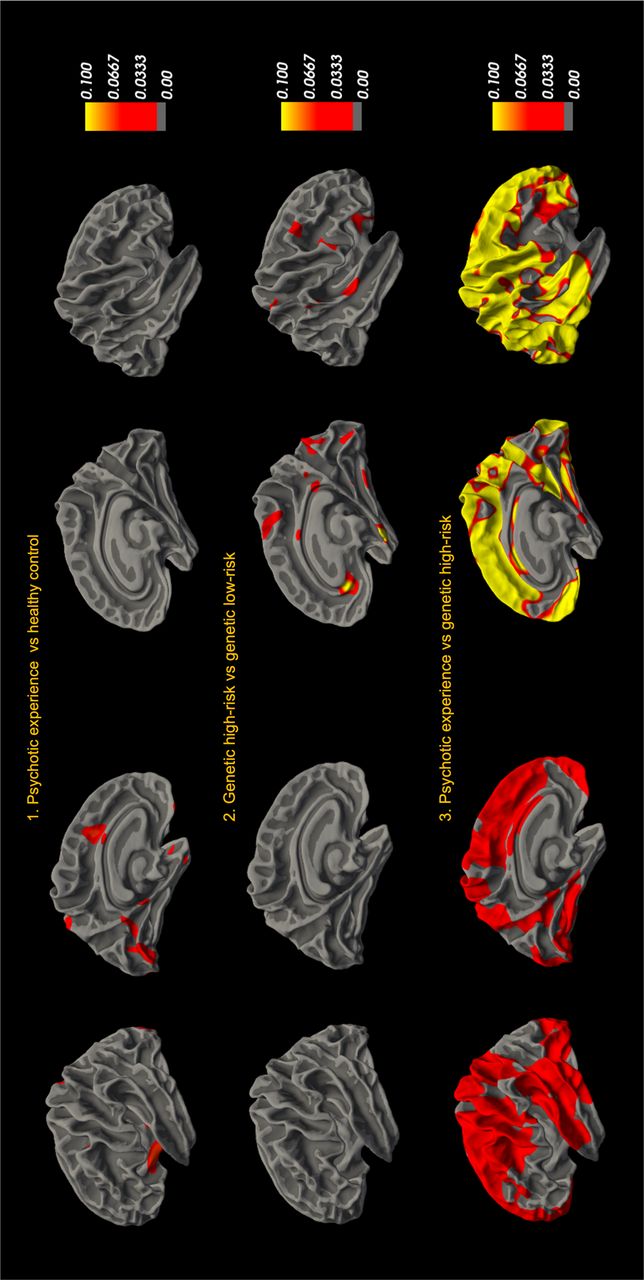
In our first set of analyses, we used general linear models to examine group differences in vertex-wise GWC. No corrected significant group differences in GWC were observed between the psychotic experiences group and healthy control or between the high genetic risk group and low genetic risk group. Moreover, no corrected significant differences in GWC were observed when comparing two risk groups, the psychotic experiences group and the high genetic risk group. Uncorrected effect sizes for all group comparisons are shown in Figure 2.

GWC groups-level comparison. 1) Differences in GWC between individuals with psychotic experiences (PE) and healthy controls (HC), 2) GWC differences between high genetic risk (HGR) groups and low genetic risk (LGR) groups and 3) GWC differences between two risk groups, PE and HGR.
3.3 Association between gray/white matter contrast and psychotic-experiences
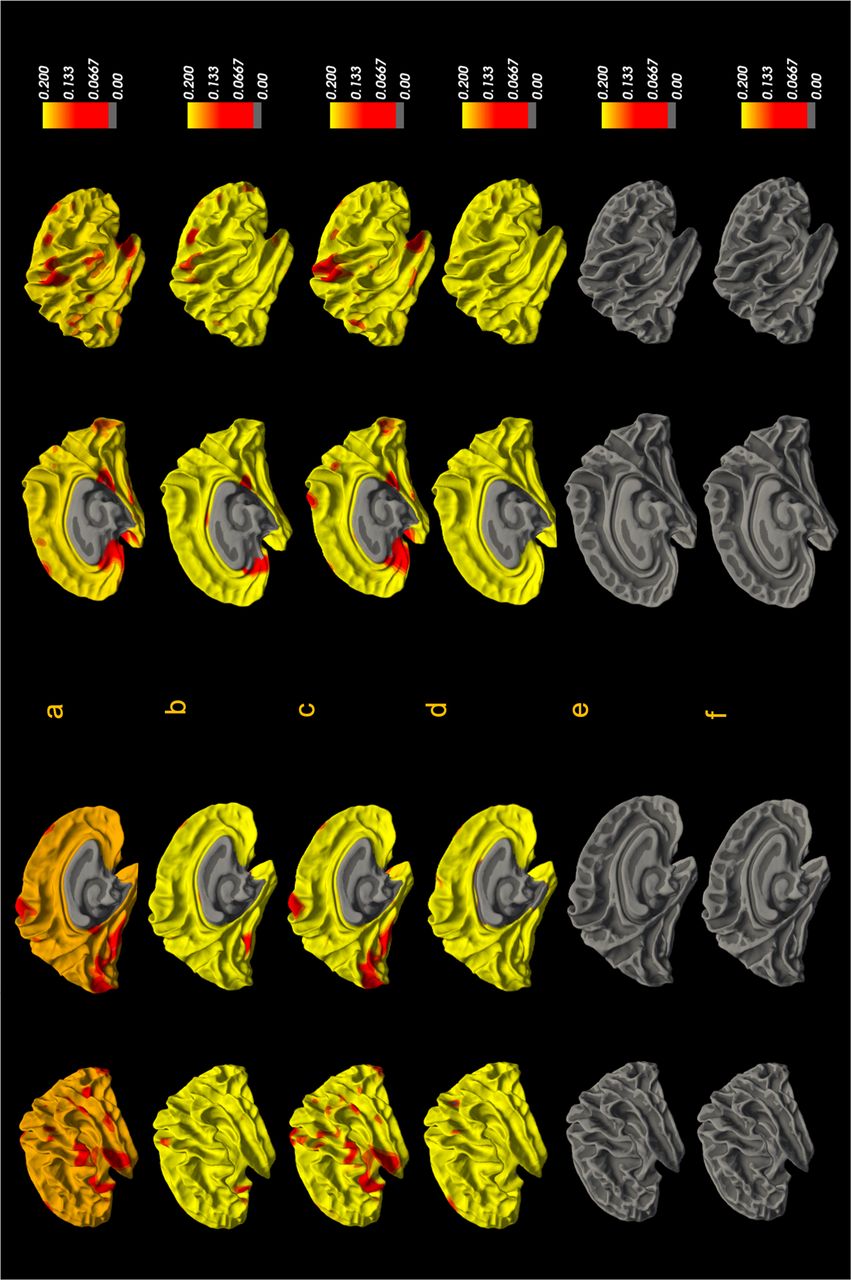
In our second set of analyses, we examined the association between vertex-wise GWC and the number of psychotic experience, experiences of psychotic experiences before age 24, and psychotic experiences in the past six months within the two risk groups. The clinical measures used in these analyses were from the semi-structured interviews conducted at approximately age 24 years. The analyses did not show any corrected significant associations between the number of symptoms, symptoms before age 24, or symptoms in the past six months at age 24 and vertex-wise GWC in either of the two risk groups. Uncorrected effect sizes are shown in Figure 3.

Vertex-vice group associations in the psychotic experience group between GWC and a) the number of psychotic experiences, b) psychotic-like experiences within the past 6 months at age 24, and c) psychotic experiences before age 24. Associations in the genetic high-risk group between GWC and d) the number of psychotic experiences, e) psychotic-like experiences within the past 6 months at age 24 and f) psychotic experiences before age 24.
3 Discussion
The present study aimed to investigate brain microstructure as indexed by GWC in young adults who endorsed psychotic experiences or those at genetic risk for psychosis. Specifically, we tested for group differences between individuals who endorsed psychotic experiences and healthy controls, between individuals with high and low genetic risk, and between the two risk groups. No significant differences in GWC were observed between the groups. Our result therefore did not support our hypothesis that individuals endorsing the presence of psychotic experiences would have regionally higher GWC in comparison to healthy controls and individuals with high genetic risk. Within the high-risk groups, individual differences in the number and psychotic experiences were not significantly associated with GWC. Our hypothesis that the number and psychotic experiences would be positively associated with GWC within group endorsing psychotic experiences was not supported. Overall, our results indicate that GWC is not a sensitive neurobiological marker for psychosis risk in young adults.
Previous studies conducted in clinical populations with psychotic disorders, specifically schizophrenia and bipolar disorder, have found group differences in GWC. Jørgensen et al. (2016) found higher GWC in pre- and postcentral gyri, the transverse temporal gyri, posterior insula, and parieto-occipital regions among patients with schizophrenia in comparison to healthy control and patients with bipolar disorder. They also observed higher GWC in patients with bipolar disorder in comparison to healthy controls. In line with these results, Chwa et al. (2020) found higher GWC within the right superior frontal lobe encompassing the sensorimotor region in patients with schizophrenia in comparison to healthy controls. Kong et al. (2012; 2015), albeit in smaller samples, also observed differences in GWC among patients with schizophrenia and healthy controls, but in the opposite direction in large portions of the cortex, including frontal, temporoparietal and lateral occipital regions. As we did not find any group-level differences in GWC in young adults with psychotic experiences or genetic risk for psychosis, it is possible that such differences are only present in clinical groups or in groups with higher risk. Schizophrenia has been also hypothesized to involve progressive pathogenic neural mechanisms, which might not be present in risk groups (Borgwardt et al. 2007).
Jørgensen et al. (2016) also found a positive association between GWC and experiences of hallucinations in the transverse temporal cortices bilaterally and subthreshold symptoms in the transverse temporal cortex and left occipital lobe clusters. Chwa et al. (2020) found a negative association between cumulative dosage exposure to second-generation antipsychotics and GWC bilaterally in the frontal lobe and within the right orbital frontal cortex after controlling for cortical volume differences. These observations open avenues for explaining the GWC differences observed in clinical populations to be related to secondary factors such as the severity of clinical symptoms or medication. It is therefore possible that our null results are due to the group who endorsed psychotic experiences having a relatively low symptom load and limited psychotic experiences. Previous studies in both clinical and high-risk populations have reported associations between severity of symptoms and brain structure and microstructure (Satterthwaite et al. 2016). The relatively low number of endorsement of psychotic experiences in our sample indicates that the sample had a relatively low psychosis risk.
Our results are in line with our hypothesis that there would not be any differences in GWC between individuals with high and low genetic risk for psychosis. Results from previous studies examining the association between schizophrenia PRS and brain structure and microstructure are contradictory (Dimitriadis et al. 2023; Fonville et al. 2019; Lancaster et al. 2019a; Neilson et al. 2018; Ohi et al. 2014). A meta-analysis did not find any association between schizophrenia PRS and brain structure, and studies that found an association had small effect sizes (van der Merwe et al. 2019). This could be due to the limited predictivity power of schizophrenia PRS. PRS performs worse when the sample consists of individuals from different ancestries (Andreassen et al. 2023), however our sample consisted mainly of white European individuals. A previous ALSPAC study did not find any association between schizophrenia PRS and psychotic experiences (Jones et al. 2016), while other studies with larger samples have found associations between schizophrenia PRS and psychotic-like experiences (Barbu et al. 2023; Elkrief et al. 2023).
Another possible explanation for why we did not observe any group differences in GWC could be the neuroimaging metric used. GWC might not be a sensitive neural marker for capturing differences in risk populations with relatively low risk. However, studies measuring GWC in different clinical populations have demonstrated that GWC is a sensitive marker for capturing illness-related changes (Putcha et al. 2023; Salat et al. 2009; Xu et al. 2024; Wang et al. 2023). Studies have found GWC to be sensitive to capturing β-amyloid pathology in earlier stages of Alzheimer’s disorder (AD) (Putcha et al. 2023). Further, changes in GWC have been associated with cognitive performance among AD individuals with underlying β-Amyloit pathology and with increased age among individuals with dementia (Salat et al. 2009; Xu et al. 2024). Changes in GWC have not only been observed among older clinical populations but also among young children with attention deficit hyperactivity disorder (Wang et al. 2023). Further, GWC is suggested to capture microstructural changes before the emergence of cortical atrophy and be more sensitive to capturing these microstructural changes earlier than conventional neuroimaging parameters (Xu et al. 2024; Putcha et al. 2023). In light of these studies, GWC seems to be a sensitive neural marker for capturing microstructural changes in the clinical population. The reasons why we did not observe any differences in our study sample could be the result of lower statistical power and that most individuals in our samples had low symptom load (See Figure 1.).
The null results of the present study should be interpreted in the light of some limitations. As discussed above, our samples endorsed relatively few psychotic experiences and should therefore be considered as a low-risk group. Second, larger samples and greater statistical power might be needed to detect subtle differences in GWC clinical or genetic risk groups. Third, given the limited statistical power, we did not examine differences in GWC between individuals who transitioned to full psychotic disorder and those who did not. Lastly, recruitment of individuals with psychotic experiences from the general population has lower predictive power than recruitment of help-seeking participants, which can lead to null results (Paolo Fusar-Poli et al. 2015), however: population-based sampling is argued to minimize self-reporting, referral and selection biases (Drakesmith et al. 2015). Considering these limitations, future studies could focus on the developmental nature of psychosis using a longitudinal study design including different imaging metrics and clinical measures at multiple time points and seek to include larger samples that also include individuals with higher clinical or genetic risk. Nonetheless, in conclusion, our null results indicate that GWC is not a sensitive neuroimaging marker for psychosis risk in young adults with relatively low risk.
4 Conclusion
The findings of the current study showed no GWC differences between young adults with psychotic experiences and high genetic risk for psychosis nor any association between GWC and the number of psychotic experiences. This suggests that GWC is not a sensitive measure to capture microstructural changes in individuals with relatively low psychosis-risk.
Data Availability
All data are available from the Avon longitudinal study of parents and children upon request.
Acknowledgements
We are extremely grateful to all the families who took part in this study, the midwives for their help in recruiting them, and the whole ALSPAC team, which includes interviewers, computer and laboratory technicians, clerical workers, research scientists, volunteers, managers, receptionists and nurses.
References


