medRxiv
  • Home
  • About
  • Submit
  • ALERTS / RSS
Advanced Search

Quantitative T1 and Effective Proton Density (PD*) mapping in children and adults at 7T from an MP2RAGE sequence optimised for uniform T1-weighted (UNI) and FLuid And White matter Suppression (FLAWS) contrasts

View ORCID ProfileAyşe Sıla Dokumacı, View ORCID ProfileKaty Vecchiato, Raphael Tomi-Tricot, View ORCID ProfileMichael Eyre, View ORCID ProfilePhilippa Bridgen, Pierluigi Di Cio, View ORCID ProfileChiara Casella, View ORCID ProfileTobias C. Wood, View ORCID ProfileJan Sedlacik, Tom Wilkinson, Sharon L. Giles, View ORCID ProfileJoseph V. Hajnal, View ORCID ProfileJonathan O’Muircheartaigh, View ORCID ProfileShaihan J. Malik, View ORCID ProfileDavid W. Carmichael
doi: https://doi.org/10.1101/2024.06.28.24307535
Ayşe Sıla Dokumacı
1Biomedical Engineering Department, School of Biomedical Engineering and Imaging Sciences, King’s College London, London, United Kingdom
2London Collaborative Ultra high field System (LoCUS), London, United Kingdom
  • Find this author on Google Scholar
  • Find this author on PubMed
  • Search for this author on this site
  • ORCID record for Ayşe Sıla Dokumacı
  • For correspondence: ayse.dokumaci{at}kcl.ac.uk
Katy Vecchiato
2London Collaborative Ultra high field System (LoCUS), London, United Kingdom
3Department of Forensic and Neurodevelopmental Sciences, Institute of Psychiatry, Psychology and Neuroscience, King’s College London, London, United Kingdom
4Centre for the Developing Brain, School of Biomedical Engineering and Imaging Sciences, King’s College London, London, United Kingdom
  • Find this author on Google Scholar
  • Find this author on PubMed
  • Search for this author on this site
  • ORCID record for Katy Vecchiato
Raphael Tomi-Tricot
1Biomedical Engineering Department, School of Biomedical Engineering and Imaging Sciences, King’s College London, London, United Kingdom
2London Collaborative Ultra high field System (LoCUS), London, United Kingdom
5MR Research Collaborations, Siemens Healthcare Limited, Frimley, United Kingdom
  • Find this author on Google Scholar
  • Find this author on PubMed
  • Search for this author on this site
Michael Eyre
1Biomedical Engineering Department, School of Biomedical Engineering and Imaging Sciences, King’s College London, London, United Kingdom
2London Collaborative Ultra high field System (LoCUS), London, United Kingdom
  • Find this author on Google Scholar
  • Find this author on PubMed
  • Search for this author on this site
  • ORCID record for Michael Eyre
Philippa Bridgen
1Biomedical Engineering Department, School of Biomedical Engineering and Imaging Sciences, King’s College London, London, United Kingdom
2London Collaborative Ultra high field System (LoCUS), London, United Kingdom
  • Find this author on Google Scholar
  • Find this author on PubMed
  • Search for this author on this site
  • ORCID record for Philippa Bridgen
Pierluigi Di Cio
1Biomedical Engineering Department, School of Biomedical Engineering and Imaging Sciences, King’s College London, London, United Kingdom
2London Collaborative Ultra high field System (LoCUS), London, United Kingdom
  • Find this author on Google Scholar
  • Find this author on PubMed
  • Search for this author on this site
Chiara Casella
2London Collaborative Ultra high field System (LoCUS), London, United Kingdom
4Centre for the Developing Brain, School of Biomedical Engineering and Imaging Sciences, King’s College London, London, United Kingdom
  • Find this author on Google Scholar
  • Find this author on PubMed
  • Search for this author on this site
  • ORCID record for Chiara Casella
Tobias C. Wood
7Department of Neuroimaging, Institute of Psychiatry, Psychology and Neuroscience, King’s College London, London, United Kingdom
  • Find this author on Google Scholar
  • Find this author on PubMed
  • Search for this author on this site
  • ORCID record for Tobias C. Wood
Jan Sedlacik
2London Collaborative Ultra high field System (LoCUS), London, United Kingdom
8Robert Steiner MR Unit, Medical Research Council Laboratory of Medical Sciences, Hammersmith Hospital Campus, Du Cane Road, London, UK
9Mansfield Centre for Innovation, Imaging Sciences, Institute of Clinical Sciences, Imperial College London, Hammersmith Hospital Campus, Du Cane Road, London, UK
  • Find this author on Google Scholar
  • Find this author on PubMed
  • Search for this author on this site
  • ORCID record for Jan Sedlacik
Tom Wilkinson
1Biomedical Engineering Department, School of Biomedical Engineering and Imaging Sciences, King’s College London, London, United Kingdom
2London Collaborative Ultra high field System (LoCUS), London, United Kingdom
  • Find this author on Google Scholar
  • Find this author on PubMed
  • Search for this author on this site
Sharon L. Giles
1Biomedical Engineering Department, School of Biomedical Engineering and Imaging Sciences, King’s College London, London, United Kingdom
2London Collaborative Ultra high field System (LoCUS), London, United Kingdom
10Guy’s and St Thomas’ NHS Foundation Trust, London, United Kingdom
  • Find this author on Google Scholar
  • Find this author on PubMed
  • Search for this author on this site
Joseph V. Hajnal
1Biomedical Engineering Department, School of Biomedical Engineering and Imaging Sciences, King’s College London, London, United Kingdom
2London Collaborative Ultra high field System (LoCUS), London, United Kingdom
4Centre for the Developing Brain, School of Biomedical Engineering and Imaging Sciences, King’s College London, London, United Kingdom
  • Find this author on Google Scholar
  • Find this author on PubMed
  • Search for this author on this site
  • ORCID record for Joseph V. Hajnal
Jonathan O’Muircheartaigh
2London Collaborative Ultra high field System (LoCUS), London, United Kingdom
3Department of Forensic and Neurodevelopmental Sciences, Institute of Psychiatry, Psychology and Neuroscience, King’s College London, London, United Kingdom
4Centre for the Developing Brain, School of Biomedical Engineering and Imaging Sciences, King’s College London, London, United Kingdom
11MRC Centre for Neurodevelopmental Disorders, King’s College London, London, United Kingdom
  • Find this author on Google Scholar
  • Find this author on PubMed
  • Search for this author on this site
  • ORCID record for Jonathan O’Muircheartaigh
Shaihan J. Malik
1Biomedical Engineering Department, School of Biomedical Engineering and Imaging Sciences, King’s College London, London, United Kingdom
2London Collaborative Ultra high field System (LoCUS), London, United Kingdom
  • Find this author on Google Scholar
  • Find this author on PubMed
  • Search for this author on this site
  • ORCID record for Shaihan J. Malik
David W. Carmichael
1Biomedical Engineering Department, School of Biomedical Engineering and Imaging Sciences, King’s College London, London, United Kingdom
2London Collaborative Ultra high field System (LoCUS), London, United Kingdom
  • Find this author on Google Scholar
  • Find this author on PubMed
  • Search for this author on this site
  • ORCID record for David W. Carmichael
  • Abstract
  • Full Text
  • Info/History
  • Metrics
  • Supplementary material
  • Data/Code
  • Preview PDF
Loading

Abstract

Introduction Quantitative MRI is important for non-invasive tissue characterisation. In previous work we developed a clinically feasible multi-contrast protocol for T1-weighted imaging based on the MP2RAGE sequence that was optimised for both children and adults. It was demonstrated that a range of Fluid And White Matter Suppression (FLAWS) related contrasts could be produced while maintaining T1-weighted uniform image (UNI) quality, a challenge at higher field strengths. Here we introduce an approach to use these images to calculate effective proton density (PD*) and quantitative T1 relaxation maps especially for shorter repetition times (TRMP2RAGE) than those typically used previously.

Methods T1 and PD* were estimated from the analytical equations of the MP2RAGE signal derived for partial Fourier acquisitions. The sensitivity of the fitting results was evaluated with respect to the TRMP2RAGE and B1+ effects on both excitation flip angles and inversion efficiency and compared to vendor T1 maps which do not use B1+ information. Data acquired for a range of individuals (aged 10-54 years) at the shortest TRMP2RAGE (4000ms) were compared across white matter (WM), cortical grey matter, and deep grey matter regions.

Results The T1 values were insensitive to the choice of different TRMP2RAGE. The results were similar to the vendor T1 maps if the B1+ effects on the excitation flip angle and inversion efficiency were not included in the fits. T1 values varied over development into adulthood, especially for the deep grey matter regions whereas only a very small difference was observed for WM T1. Effective PD maps were produced which did not show a significant difference between children and adults for the age range included.

Conclusion We produced PD* maps and improved the accuracy of T1 maps from an MP2RAGE protocol that is optimised for UNI and FLAWS-related contrasts in a single scan at 7T by incorporating the excitation flip angle and inversion efficiency related effects of B1+ in the fitting. This multi-parametric protocol made it possible to acquire high resolution images (0.65mm iso) in children and adults within a clinically feasible duration (7:18 min:s). The combination of analytical equations utilizing B1+ maps led to T1 fits that were consistent at different TRMP2RAGE values. Average WM T1 values of adults and children were very similar (1092ms vs 1117ms) while expected reductions in T1 with age were found for GM especially for deep GM.

1 Introduction

Quantitative MRI has an important role in the measurement of tissue microstructure and its alteration as part of healthy development and ageing (Deoni, 2010; Eminian et al., 2018; Lutti et al., 2014) and in a wide range of pathology (Adler et al., 2017; McDowell et al., 2018).

Many different approaches exist for longitudinal relaxation constant (T1) mapping (A. G. Teixeira et al., 2020; Brix et al., 1990; Christensen et al., 1974; Crawley & Henkelman, 1988; Deichmann & Haase, 1992; Deoni, 2007; Deoni et al., 2003; Frahm et al., 1986; Fram et al., 1987; Graumann et al., 1986; Gupta, 1977; Hahn, 1950; Helms et al., 2008; Henderson et al., 1999; Homer & Beevers, 1985; Leipert & Marquardt, 1976; Look & Locker, 1968, 1970; Lutti et al., 2014; Ma et al., 2023; Wright et al., 2008); however, a fast and widely used approach at 7 Tesla (T) for human brain is the Magnetization Prepared 2 Rapid Gradient Echoes (MP2RAGE) (Marques et al., 2010) sequence. The MP2RAGE sequence (Marques et al., 2010), which is an extension of the Magnetization Prepared RApid Gradient Echo (MPRAGE) sequence (Marques et al., 2010; Mugler & Brookeman, 1990; Van de Moortele et al., 2009), has been used at 7T to produce 3D structural T1-weighted brain images and T1 maps. This sequence acquires two Gradient Echo (GRE) images (INV1 and INV2) at two different inversion times (TI1 and TI2) following a non-selective adiabatic inversion pulse where the time between two consecutive inversion pulses is called TRMP2RAGE(Marques et al., 2010). These two images are combined to form the uniform T1-weighted image (UNI) which is insensitive to receive field (B1-) variability, proton density (PD), and T2* effects (Marques et al., 2010; Van de Moortele et al., 2009). T1 maps are typically produced using the UNI signal from look up tables (LUTs) which assume uniform B1+(Marques et al., 2010). Nonetheless, derived images and quantitative maps are still sensitive to transmit field (B1+) inhomogeneity effects (Marques et al., 2010).

Even though the MP2RAGE scan parameters can be optimised to reduce the B1+ effects, some residual B1+ bias is likely to be present in the T1 maps (Marques & Gruetter, 2013; Van de Moortele et al., 2009). To overcome this problem, Marques et al. (Marques & Gruetter, 2013) employed the MP2RAGE sequence(Marques et al., 2010) and SA2RAGE sequence (Eggenschwiler et al., 2012) that is used to calculate B1+ values assuming a single T1 value over the whole brain together (Marques & Gruetter, 2013). Two 2D look up tables relating either the T1 value to the MP2RAGE signal intensity and the B1+ value or the B1+ value to the MP2RAGE signal intensity and the T1 value were utilized iteratively to estimate both T1 and B1+(Marques & Gruetter, 2013). The B1+ effect was considered only for the excitation pulses and not for the adiabatic inversion pulse (Marques & Gruetter, 2013).

A study investigating the inter-site variability compared two datasets one of which was acquired with a low B1+-sensitive protocol like the one by Marques and Gruetter (Marques & Gruetter, 2013) while using a parallel transmit head coil for improved B1+ homogeneity (Haast et al., 2021). This demonstrated that B1+ inhomogeneity affects both the T1 values (Marques & Gruetter, 2013) and segmentation and cortical surface calculation (Haast et al., 2018), with differing values with and without B1+ inhomogeneity correction (Haast et al., 2021).

The MP2RAGE sequence can also be optimised to produce GM-dominant FLuid And White Matter Suppression (FLAWS) images (Beaumont et al., 2019, 2021; Martin et al., 2023; Massire et al., 2021; Müller et al., 2022; Tanner et al., 2012; Urushibata et al., 2019), which can be beneficial for deep GM visualisation and potentially improve lesion detection in multiple sclerosis and focal cortical dysplasia (Chen et al., 2018; Martin et al., 2023; Massire et al., 2021; Müller et al., 2022). It would be advantageous to be able to obtain T1 maps from these protocols, but T1 estimation is challenging due to the low grey matter (GM) signal in the bias-reduced UNI image which is used to calculate T1 unless additional bias-reduced FLAWS-related images such as the FLAWShc is used for this purpose (Beaumont et al., 2021).

A further clinically relevant quantitative value is proton density (PD) which is defined as the number of MR visible hydrogen protons in tissue (Mezer et al., 2016; Tofts, 2003). PD values have been shown to be altered in multiple sclerosis (Engström et al., 2014; Gracien et al., 2017), brain oedema in hepatic encephalopathy (Shah et al., 2008), and peritumoral oedema in malignant gliomas (Blystad et al., 2017). Quantitative PD maps can be obtained from MP2RAGE protocols; however, this has not been performed to the best of our knowledge.

A number of studies have proposed to obtain T1 maps by adding an additional GRE block to the MP2RAGE sequence (Marques et al., 2010) named as MP3RAGE: Hung et al. (Hung et al., 2013) determined T1 by fitting the inversion efficiency (eff) of the pulse as a free parameter if the pulse profile information was not available; Rioux et al. (Rioux et al., 2014) obtained T1 and flip angle (FA) information by using three different combinations of the images acquired at different inversion times using a LUT as in Marques et al. (Marques et al., 2010); and Olsson et al. (Olsson et al., 2022) fitted T1 and B1+ simultaneously by using closed-form approximations of the signal equations for small FAs while assuming an eff value of 0.96.

In this study, we aimed to determine if high quality T1 and effective PD (PD*) maps could be generated from a 7T protocol with shorter than conventional repetition times (TRMP2RAGE), previously optimised to generate UNI and FLAWS-related contrasts in a single scan (Dokumacı et al., 2023). The term effective PD has been used because the T2* effects have not been considered(Cercignani et al., 2018; Weiskopf et al., 2013). To achieve this aim, analytical equations that account for partial Fourier acquisitions were derived and fitting was performed using the analytical equations in combination with B1+ maps while investigating the effects of B1+ both on the excitation flip angles and the inversion efficiency (eff). Results using protocols with different TRMP2RAGE values were compared. Data from children and adults using the short TRMPRAGE (=4000ms) were acquired and changes in T1 with age were investigated.

2 Methods

2.1 Theory

The time between two consecutive inversion pulses in an MP2RAGE sequence, TRMP2RAGE, includes two GRE blocks, the delay (TA) following the first inversion pulse until the start of the first GRE block, the delay (TB) between the two GRE blocks, and the remaining time (TC) following the second GRE block until the application of the next inversion pulse (Marques et al., 2010). Following the approach of Marques et al.(Marques et al., 2010), the MP2RAGE steady-state signal for the longitudinal magnetization and the modified signal equations accounting for the partial Fourier acquisition for the GRE blocks were derived as(Dokumaci AS, 2022): Embedded Image

Embedded Image Embedded Image

In Eqn. (1), EA = exp(-TA/T1), EB = exp(-TB/T1), EC = exp(-TC/T1), and E1 = exp(-TRGRE/T1). TRGRE is the time between the small flip angle excitations in the GRE blocks (n in total). The efficiency of the inversion pulse is denoted as eff and defined as (Marques et al., 2010) 𝑀𝑧,𝑖𝑛𝑣 = −𝑒𝑓𝑓𝑀𝑧(0) where Mz,inv is the inverted longitudinal magnetisation and Mz(0) is the initial longitudinal magnetisation. Equations (2) and (3) account for the partial Fourier factor of 6/8 in the first phase encoding (partition) direction, acquired in the innermost k-space loop. This results in a shift of the k-space centre from the middle of the n phase encoding blocks to (n/3 + 1) in the sequence implementation.

To fit T1 and M0 (PD) a nonlinear least-squares solver (lsqnonlin) in MATLAB (R2022b, The Mathworks, Natick, Massachusetts) was used to minimise the cost function:

Embedded Image for f1 = s1 - PD*k1 and f2 = s2 - PD*k2 where s1 and s2 are the measured GRETI1 and GRETI2 signals, respectively with the theoretical values of PD*k1 and PD*k2 from Eqns. (2) and (3). The term seq represents the imaging parameters TRGRE, TI1, TI2, TRMP2RAGE, n, α1, α2 whose values are known. The terms k1 and k2 are not functions of PD but depend on T1 and the sequence parameters.

The fitting “options” for the lsqnonlin function were MaxIterations = 100000; MaxFunctionEvaluations = 400000; FunctionTolerance = 1e-20; FiniteDifferenceStepSize = 1e-2; and OptimalityTolerance = 1e-10. The T1 search range was 200ms to 30000ms while for the unscaled PD 0 to 100000 was used. The initial values for T1 and PD were 1500ms and 20000, respectively.

2.2 Different Fits for Calculating T1

To explore the weighting of the two likely factors contributing to spatial effects (inversion efficiency (eff) and B1+ variability) different fits were performed using the nonlinear least-squares algorithm:

Fit 1 excluded B1+ information in the excitation flip angles (α1 and α2) and assumed eff=1 throughout the whole 3D image. Fit 2 included B1+ information in the excitation flip angles (α1 and α2) but still assumed eff =1. Lastly, Fit 3 included both the B1+ information and variable eff.

For all fits, the phase information was used to determine the polarity of the magnetization due to T1 recovery at the first inversion time (TI1).

The effect of TRMP2RAGE on the fits was investigated. In addition, T1 maps from the vendor which are determined from a LUT without using B1+ information (Marques et al., 2010) were included for comparison. The function colorbarpzn (He, 2024) running in MATLAB was used to create the blue-white-red colormaps and colorbars.

2.3 Data Acquisition

All data was obtained under institutional ethical approval (REMAS 8700 and 18/LO/1766) and following informed consent. For all scans, a MAGNETOM Terra 7T system (Siemens Healthcare, Erlangen, Germany) using a single transmit (1Tx/32Rx) coil (Nova Medical) was employed.

The summary of scan protocols is given in Table 1. Most of the data were acquired using the protocol optimized in our previous study (Dokumacı et al., 2023) that confers the benefits of short scan time, high resolution, and high-quality FLAWS and UNI contrast options from a single scan. Firstly, data were obtained with different TRMP2RAGE values in a small group of 4 healthy adults (32±2 years, 1f) to assess the invariance of the T1 estimate to the TRMP2RAGE (Table 1a). Secondly, data from 7 healthy children (12±2 years, 2f) and 2 more adults making it 6 adults in total (35±9 years, 1f) were obtained to determine if expected age-related T1 changes could be observed; TRMP2RAGE=4000ms was used for all the scans in Table 1b except for Protocol 3 which had a low sensitivity to B1+ with a longer TRMP2RAGE (Marques et al., 2010) (TRMP2RAGE=8000ms).

View this table:
  • View inline
  • View popup
  • Download powerpoint
Table 1.

TI1/TI2 is the time between the inversion pulse and the centre of k-space for the 1st/2ndGRE block (Marques et al., 2010). Parallel imaging was employed using GRAPPA (Griswold et al., 2002). a) Scans obtained in 4 healthy adults: a partial Fourier factor of 6/8 was used in both phase encoding directions. b) Scan parameters applied in healthy children and adults. Protocol 3 had low sensitivity to B1+ but a longer TRMP2RAGE. A partial Fourier factor of 6/8 was used only in one direction (slice partial Fourier) for Protocols 2 and 3.

To determine the effect of B0 inclusion on the eff of the inversion pulse, a B0 map (GRE sequence with 3 echoes TE1/TE2/TE3 = 1.02ms/2.26ms/4.08ms and TR=10ms) was acquired in one subject. In addition to the B0 map, MP2RAGE data using 2 different protocols (Protocols 2 and 3) and 2 different B1+ maps (sat_tfl and AFI (Yarnykh, 2007)) were obtained where sat_tfl refers to the B1+ method that uses a slice-selective preconditioning pulse in combination with a turbo FLASH readout (Chung et al., 2010; Fautz et al., 2008).

2.4 T1 and PD* estimation and analysis

Data preprocessing consisted of the following steps performed in MATLAB (R2022b, The Mathworks, Natick, Massachusetts): 1) using the FLAWShco images a brain mask was produced to limit the fit to brain and surrounding cerebrospinal fluid, 2) B1+ map processing, 3) B1- bias field calculation for PD* map generation, and 4) determining the inversion efficiency (eff) maps which are explained in detail below.

2.4.1 Producing the brain mask

FLAWShco images were generated using the INV1 and INV2 images (Beaumont et al., 2021; Dokumacı et al., 2023; Tanner et al., 2012) and converted to NIfTI using the dicm2nii function (Li et al., 2016). A brain mask was calculated from a segmentation performed on the FLAWShco image in SPM12 (Penny et al., 2007). Regions were assigned to be within the brain if they had probability of p>0.99 of being either white matter (WM), grey matter (GM), or cerebrospinal fluid (CSF). The resulting binary mask was edited to produce a closed mask with the application of the imclose and imfill morphological operators in MATLAB.

2.4.2 B1+ map processing

B1+ maps were smoothed using the hMRI toolbox (Tabelow et al., 2019) and co-registered and resliced using the FLAWShco image (Beaumont et al., 2021; Dokumacı et al., 2023; Tanner et al., 2012) as the reference and the B1+ magnitude images as the source in SPM12 (Penny et al., 2007). The relative B1+ values for each voxel were multiplied by the nominal flip angles to define the actual flip angles subsequently used in the fitting process.

2.4.3 B1- related bias field calculation

Maps of the B1- related signal bias in the PD* fits were produced using SPM12(Penny et al., 2007) using the following parameters in the Segment module: extremely light regularisation (0.00001), Bias FWHM of 30 mm cutoff, and 3 different tissue types were chosen because the fits were masked.

2.4.4. Determining the inversion efficiency (eff) maps

The adiabatic inversion pulse was a hyperbolic secant (Baum et al., 1985; Silver et al., 1984) whose eff was determined using Bloch simulations for each spatial location for all subjects independently using the RF pulse information exported from the DICOM files in combination with the B1+ maps and, where available, B0 maps.

2.5 Data Analysis in FreeSurfer

To determine the T1 and PD* values for different brain regions, UNI images were segmented in FreeSurfer 7.3 (Fischl, 2012). For this purpose, the UNI images were masked with the same closed masks that were used in the fitting process. Masked images were denoised using the DenoiseImage function (Manjón et al., 2010) in Advanced Normalization Tools (ANTs)(Avants et al., 2009). A variant of the N3 Bias Correction algorithm(Sled et al., 1997, 1998), N4 Bias Correction algorithm (N4BiasFieldCorrection function) (Tustison et al., 2010) implemented in the ANTs (Avants et al., 2009) package was used with the default parameters (spline spacing b = 180; convergence c = [50x50x50x50, 0]). The masks were part of the inputs for both functions. Images were reoriented to standard orientation using the fslreorient2std function in FSL (FMRIB Software Library) (Jenkinson et al., 2012; Smith et al., 2004).

These images were segmented using the recon-all function (Collins et al., 1994; Dale et al., 1999; Fischl, 2004; Fischl et al., 2001, 2002; Fischl, Sereno, & Dale, 1999; Fischl, Sereno, Tootell, et al., 1999; Fischl & Dale, 2000; Non-Uniform Intensity Correction. http://Www.Bic.Mni.Mcgill.ca/Software/N3/Node6.Html, n.d.; Sled et al., 1997, 1998) of FreeSurfer(Fischl, 2012) with -all (to perform all including subcortical segmentations) and -cm (to conform to the maximum resolution) options. All segmentations were checked via visual assessment by using the Subcortical Automatic Segmentation (aseg) and Automatic Cortical Parcellation (aparc) files produced by FreeSurfer overlaid on original T1-weighted images. If the UNI image segmentation was not successful, the steps above were applied to the FLAWShco images to be used as the FreeSurfer input. In one subject, parameters used for all other subjects did not result in a good segmentation and therefore were adjusted - a spline spacing of b = 100 and convergence c = [1000, 0] were used to get an improved result.

The intersection of the FreeSurfer and SPM masks were used for WM while adding another constraint to include the values with T1 ≤ 2000 ms to avoid contamination from CSF due to imperfect segmentation; for cortex the additional constraint was T1 ≤ 2500 ms. For deep GM regions, only the FreeSurfer segmentations were used because of the high constraint in the SPM segmentation (p>0.99) leading to region of interests including very few voxels (in the extreme cases without any voxels) but, like the cortex, voxels with T1 ≤ 2500 ms were included in the masks. Regional T1 mean values and standard deviations (SD) were calculated for the group of subjects who had the TRMP2RAGE=4000ms protocols to see how the values within different brain regions change by age and to establish values in children at 7T.

3 Results

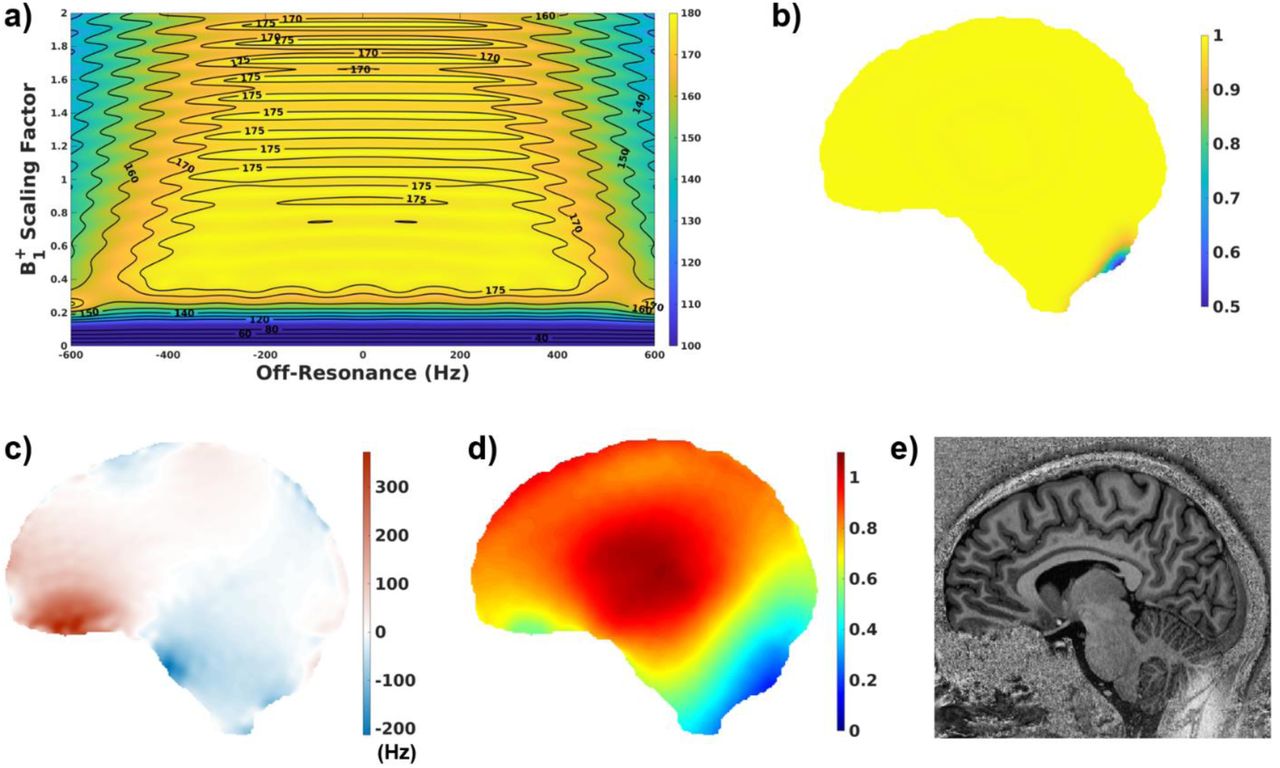
The pulse profile with the inversion efficiency simulated using the B0 and B1+ maps from the scan where Protocols 2 and 3 were compared are given in Figure 1. As seen in Figure 1a-b, the inversion pulse is very efficient for a large range of B1+ and off-resonance values. For this slice, the inversion efficiency mean value ± standard deviation was 0.995 ± 0.023 with a minimum value of 0.477. Without the inclusion of B0 information in the inversion efficiency calculations, the inversion efficiency for this slice was simulated as 0.995 ± 0.023 with a minimum of 0.478. Inversion efficiency over the 3D volume was calculated as 0.990 ± 0.048 and 0.990 ± 0.047 with and without the inclusion of the B0 map, respectively.

Figure 1.
  • Download figure
  • Open in new tab
Figure 1.

a) Pulse profile using a range of B0 and B1+ values for this pulse which is insensitive to a large range of B0 and B1+ values b) Inversion Efficiency (eff) map using c) B0 map from a slice acquired in this scan and d) the corresponding B1+ map (sat_tfl) e) the corresponding UNI image which shows a big change at the back of the cerebellum exactly where the eff deviates from 1.

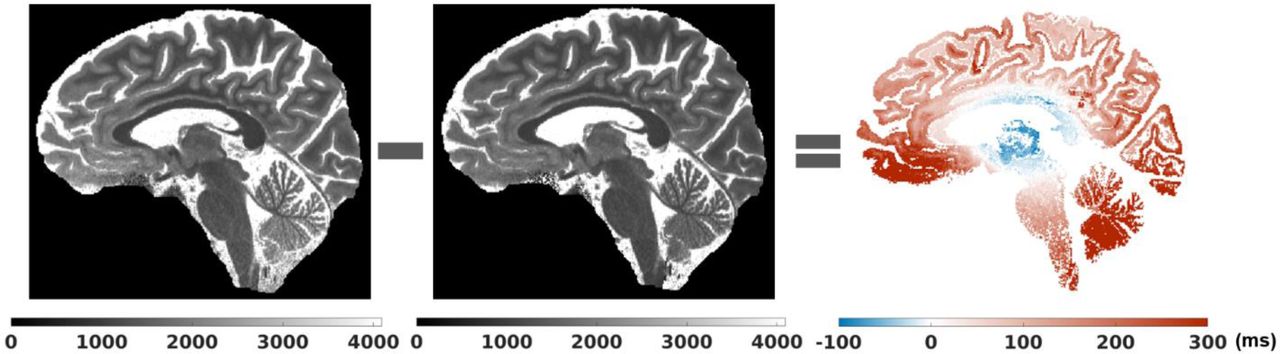
The differences between the vendor T1 map which is based on a LUT that does not use B1+ information and the fit that uses B1+ information demonstrated the expected spatial effect in T1 due to the spatial variation in the B1+ field (Fig. 2). Different fits (Fits 1-3) were performed to investigate the contribution of the eff and B1+ variability to these spatial effects.

Figure 2.
  • Download figure
  • Open in new tab
Figure 2.

Vendor T1 map (a), the fit (b), and their difference for WM and GM (c) demonstrating the spatial effect related to B1+ non-uniformity.

Figure 3 shows the histograms of WM and cortex from the data of one adult subject using Protocol 1 for these different fits and the vendor T1 map. Supplementary Figure 1 shows the histograms from the deep GM regions. Table 2 lists the means and standard deviations for 4 adults including this subject (Adult 1) for WM and cortex.

Figure 3.
  • Download figure
  • Open in new tab
Figure 3.

WM and cortex histograms for the vendor T1 map and different fits in one adult (Adult 1). Fit 1 does not consider the B1+ information like the vendor map. Fit 2 considers the B1+ information but assumes the inversion efficiency to be uniform (eff = 1) for each pixel. Fit 3 uses both the B1+ and eff maps for each pixel. Fit 1 produced the closest results to those of the vendor map. The results from Fits 2 and 3 were similar because of the high inversion efficiency of the adiabatic inversion pulse (eff = 0.994 ± 0.028 over all subjects).

View this table:
  • View inline
  • View popup
  • Download powerpoint
Table 2.

Means and SDs for WM and cortex T1 values (ms) using different fits for 4 adults (Protocol 1). As in Fig.3, the vendor map results are closest to those obtained with Fit 1 for all subjects. Likewise, Fits 2 and 3 provided very similar results due to the high inversion efficiency of the adiabatic pulse.

In all subjects, the mean and median values of the vendor map and Fit 1 were the closest as both ignored the B1+ information. For this highly efficient hyperbolic secant adiabatic inversion pulse with an eff of 0.994 ± 0.028 over 13 subjects, the results from Fit 2 and Fit 3 were very similar. Supplementary Table 1 shows the T1 results using different fits in deep GM regions where a similar trend is observed.

To investigate the effect of TRMP2RAGE on T1 fits, 4 different TRMP2RAGE protocols (Table 1a) were compared using the Fit 3 estimation (accounting for B1+ effects on both the excitation flip angles and the eff). In Figure 4, the T1 means and standard deviations for different brain regions with different TRMP2RAGE values are shown. The standard deviation at each TRMP2RAGE corresponds to the physiological variation of the T1 over the whole brain. The horizontal dotted lines correspond to the mean across TRMP2RAGE. The mean values and the uncertainty of the average using these different protocols are given above the lines. The uncertainty of the average is very small for each brain region in all adults which indicates the high precision of the T1 fits across TRMP2RAGE.

Figure 4.
  • Download figure
  • Open in new tab
Figure 4.

T1 measurements using Fit 3 and protocols with different TRMP2RAGE values in 4 adults. The horizontal dotted lines correspond to the mean of the 4 measurements and the mean and uncertainty of the average is given above the line which indicates the small effect of these TRMP2RAGE on the fits. TRMP2RAGE 5000 and TRMP2RAGE 5000* correspond to the protocols 5000 (1) and 5000 (2) in Table 1a, respectively.

After investigating the effect of TRMP2RAGE on the fits, data acquired at TRMP2RAGE=4000ms were compared in children and adults. Figure 5 shows the results from different protocols (see Table 1b for protocol summaries) for WM, cortex and deep GM structures in children and adults. The difference between children and adult T1s was significant for GM regions especially for caudate and putamen. WM values were very similar for both populations.

Figure 5.
  • Download figure
  • Open in new tab
Figure 5.

T1 fits (Fit 3) using different protocols (triangles correspond to Protocol 1 and disks correspond to Protocol 2 in Table 1b) with the same TRMP2RAGE value (4000ms) in 7 children and 6 adults for different brain regions. The T1 values of the children are generally higher compared to those of the adults for the GM regions especially for caudate and putamen. WM values of the children (12 ± 2 years) and adults (35 ± 9 years) are very similar.

The plots for PD* values in different brain regions using different protocols in children and adults are shown in Figure 6. There is not a prominent difference between children and adult PD* values. Table 3 summarizes the means and standard deviations for T1 and PD* values of the children and adult populations.

Figure 6.
  • Download figure
  • Open in new tab
Figure 6.

PD* values (Fit 3) using different protocols (triangles correspond to Protocol 1 and disks correspond to Protocol 2 in Table 1b) with the same TRMP2RAGE value (4000ms) in 7 children and 6 adults for different brain regions. There is not a large difference between the children and adult PD* values although thalamus PD* values suggest a very slight decrease by age. The PD* values were scaled with respect to the WM mean which was assumed to be 0.69(Weiskopf et al., 2013). No T2* correction was made which would include a similar multiplication factor for WM and GM.

View this table:
  • View inline
  • View popup
  • Download powerpoint
Table 3.

Means and standard deviations (SD) of T1, PD*, and B1+ in different brain regions of children and adults. The standard deviations reflect the physiological variation of tissue T1 across the brain. The difference between the T1 values of children and adults is significant for GM regions while the WM T1 values are very close. The PD* results of children and adults are very similar as well.

T1 values were fitted (Fit 3) over the 3D image using 2 different B1+ maps for Protocol 2 (TRMP2RAGE=4000ms) and it was also compared with Protocol 3 (TRMP2RAGE=8000ms) which is highly insensitive to B1+ changes. The B1+ sensitivities of all protocols used in this study are given in Supplementary Figure 2. The B1+ maps (sat_tfl and AFI) are shown in Supplementary Figure 3 for a slice with the corresponding T1 fits using Protocol 2.

Figure 7 demonstrates representative images and parameters maps that were produced using a single acquisition in under 7.5 minutes from a healthy child. The vendor T1 map and the T1 fit are displayed in the same range (0 to 4095 ms). The PD* map was scaled such that the WM mean would be equal to 0.69. No T2* correction was made for the PD* images. The T2* effect is expected to be similar for WM and GM.

Figure 7.
  • Download figure
  • Open in new tab
Figure 7.

Different contrasts and parameter maps at 0.65 mm isotropic resolution were generated using a single MP2RAGE acquisition in 7:18 (min:s) from a healthy child. The vendor T1 map and the T1 fit are displayed in the same T1 range (0 to 4095 ms). The PD* image has not been corrected for T2* effects which would be a small factor due to the short TE (around 3 ms) and similar for WM and GM.

4 Discussion and Conclusion

In this study, we improved the accuracy of T1 maps and derived PD* images produced from our multi-contrast protocol that is optimised for UNI and FLAWS-related contrasts in a single scan (Dokumacı et al., 2023) at 7T by including B1+ effects for both the excitation flip angles and the inversion pulse in the fitting. This protocol made it possible to acquire high resolution images (0.65mm iso) in children and adults thanks to its short scan duration (7:18 min:s). T1 fitting results were consistent at different TRMP2RAGE values (4000 ms, 4500 ms, and 5000 ms) for different brain regions (See Fig. 4). The fits resulted in a mean adult WM T1 value of 1092 ± 63 ms which was slightly lower than the values found in literature with the mean range of 1100-1400 ms (Marques et al., 2010; Marques & Norris, 2018; Wright et al., 2008). Mean T1 WM value for children (12 ±2 years) was 1117 ± 74 ms. This result being very similar to the adult T1 is not surprising as the myelination is relatively mature after 2-3 years of age with much smaller amplitude development into adulthood (Barkovich, 2000). Cortex and deep GM regions generally had slightly lower values compared to the literature adult T1 values (Caan et al., 2019) although they were similar and demonstrates the same pattern of lower T1 values in deep GM regions such as the thalamus. It was observed that the GM T1 values of children were higher than those of adults especially in deep GM regions such as caudate and putamen. This was consistent with the expected reductions in T1 with age from literature (Cho et al., 1997; Gracien et al., 2017). Cho and colleagues (Cho et al., 1997) demonstrated at 1.5T that T1 vs age relationship follows a quadratic curve with minimum T1 values observed for deep GM between ages of 38-48 while the inflection in the curve does not happen before 60 years for cortex. Figure 5 shows similar trends for deep GM and cortex with a higher T1 in the younger subjects. No significant difference was observed between the mean PD* values of children and adults (Figure 6 and Table 3). This is similar to the results from previous studies for this age range (Hagiwara et al., 2021; Saito et al., 2012). The PD* values in the thalamus (Figure 6) hints a very small decrease with age, but a larger study is required to confirm this result. Furthermore, it is possible that these small changes are related to small residual T2*-related changes in the PD* measure, despite the relatively short TE. A study by Callaghan and colleagues(Callaghan et al., 2014) found negative correlations between effective proton density and age in the putamen, pallidum, caudate nucleus, and the red nucleus with an echo time of 8.45ms at 3T.

It was confirmed that the B1+ has a large effect on the T1 values as found by Haast and colleagues (Haast et al., 2021) which necessitates future inclusion of the B1+ in T1 fits. This is particularly relevant where the protocol is sensitive to B1+ variations at shorter TRMP2RAGE values which are a consequence of the requirements of short scan durations and high-resolution. The comparison of the B1+ corrected high-resolution images (0.65 mm isotropic) to lower-resolution images (1 mm isotropic) acquired with a low-B1+-sensitive protocol by Marques and Gruetter (Marques & Gruetter, 2013) revealed that by using any suitable B1+ map, the residual effects of B1+ variability on T1 maps can be removed. The accuracy of the B1+ map is important as it might affect the T1 results significantly for protocols that are more sensitive to B1+ variations. T1 values fitted using two different B1+ mapping methods in one subject were comparable (Table 4 and Supplementary Figure 3). It could be beneficial to use protocols that are less sensitive to B1+ variations while satisfying the short scan duration criterion for instance by combining CS methods (Candes & Wakin, 2008; Donoho, 2006; Lustig et al., 2007; Mussard et al., 2020; Puy et al., 2012; Trotier et al., 2019, 2022; Vasanawala et al., 2010) with longer TRMP2RAGE values.

View this table:
  • View inline
  • View popup
  • Download powerpoint
Table 4.

T1 value comparison (Fit 3) in the same subject using different B1+ maps (sat_tfl and AFI) and different protocols. Protocol 3 (TRMP2RAGE=8000ms) is less sensitive to the variations in B1+.

Quantitative results are also affected by the accuracy of the segmentations. We used an additional precaution to prevent contamination by CSF voxels by limiting the masks for T1 values ≤ 2000 ms for WM and ≤ 2500 ms for GM. T1 restriction was found to have a negligible effect on all the values except for hippocampus which is an area more prone to segmentation errors (Supplementary Table 2).

One limitation of our study was that the B0 map was available for only one subject. However, due to the very high inversion efficiency of this hyperbolic secant adiabatic pulse (eff = 0.994 ± 0.028 over all subjects), the simulated B0 effect in the inversion efficiency using the map acquired in this subject was negligible. As seen in Figure 1, the efficiency deviates from 1 when B1+ is very low and it is not so related to B0. No separate correction was made for the exponential term−𝑇𝐸/𝑇∗ but TE was very short (about 3 ms). Another limitation was that the signal equations assumed the conventional mono-exponential decay (Labadie et al., 2014; Metere et al., 2017).

In conclusion, it was possible to produce quantitative T1 and PD* maps in children and adults at 7T in addition to the UNI and FLAWS-related contrasts from a single scan by using newly derived analytical equations required for partial Fourier acquisitions while incorporating the B1+ inhomogeneity effect both on the excitation flip angles and the inversion efficiency.

Data Availability

The datasets that support the findings of this study are available upon request for any reasonable scientific purposes.

Competing Interests

Raphael Tomi-Tricot is an employee at Siemens Healthineers.

Author Contributions

A.S.D: Conceptualization, Methodology, Software, Validation, Formal Analysis, Investigation, Resources, Data Curation, Writing – Original Draft, Writing – Review & Editing, Visualization.

K.V: Investigation, Resources, Data Curation, Writing – Review & Editing.

R.T-T: Methodology, Software, Data Curation, Writing – Review & Editing.

M.E: Software, Investigation, Resources, Data Curation, Writing – Review & Editing.

P.B: Investigation, Resources, Data Curation, Project Administration.

P.D.C: Investigation, Resources, Data Curation.

C.C: Investigation, Resources, Data Curation, Writing – Review & Editing.

T.C.W: Methodology, Software, Validation, Writing – Review & Editing.

J.S: Software, Data Curation, Writing – Review & Editing.

T.W: Software, Data Curation.

S.L.G: Resources, Writing – Review & Editing, Project Administration.

J.V.H: Methodology, Validation, Writing – Review & Editing, Visualization.

J.O.M: Methodology, Writing – Review & Editing, Visualization, Supervision, Project Administration, Funding Acquisition.

S.J.M: Conceptualization, Methodology, Software, Validation, Formal Analysis, Writing – Review & Editing, Visualization, Supervision, Funding Acquisition.

D.W.C: Conceptualization, Methodology, Validation, Formal Analysis, Investigation, Resources, Writing – Original Draft, Writing – Review & Editing, Visualization, Supervision, Project Administration, Funding Acquisition.

Acknowledgments

The authors would like to acknowledge David Leitão, Ronald Mooiweer, and Oral Ersoy Dokumaci for valuable discussions.

This research was supported by GOSHCC Sparks Grant V4419, King’s Health Partners, in part by the Medical Research Council (UK) (grants MR/ K006355/1 and MR/LO11530/1) and Medical Research Council Center for Neurodevelopmental Disorders, King’s College London (MR/N026063/1), and by core funding from the Wellcome EPSRC Centre for Medical Engineering at King’s College London [WT203148/Z/16/Z]. J.O.M, K.V, and C.C were funded by a Sir Henry Dale Fellowship jointly by the Wellcome Trust and the Royal Society (206675/Z/17/Z). C.C was also funded by a grant from GOSHCC (VC1421). M.E was funded by Action Medical Research (GN2835) and the British Paediatric Neurology Association. This research was funded in whole, or in part, by the Wellcome Trust [WT203148/Z/16/Z and 206675/Z/17/Z] and by the National Institute for Health Research (NIHR) Biomedical Research Centre based at Guy’s and St Thomas’ NHS Foundation Trust and King’s College London and/or the NIHR Clinical Research Facility. The views expressed are those of the author(s) and not necessarily those of the NHS, the NIHR or the Department of Health and Social Care. For the purpose of open access, the author has applied a CC BY public copyright licence to any Author Accepted Manuscript version arising from this submission.

References

  1. ↵
    A. G. Teixeira, R. P., Neji, R., Wood, T. C., Baburamani, A. A., Malik, S. J., & Hajnal, J. V. (2020). Controlled saturation magnetization transfer for reproducible multivendor variable flip angle T 1 and T 2 mapping. Magnetic Resonance in Medicine, 84(1), 221–236. doi:10.1002/mrm.28109
    OpenUrlCrossRef
  2. ↵
    Adler, S., Lorio, S., Jacques, T. S., Benova, B., Gunny, R., Cross, J. H., Baldeweg, T., & Carmichael, D. W. (2017). Towards in vivo focal cortical dysplasia phenotyping using quantitative MRI. NeuroImage: Clinical, 15, 95–105. doi:10.1016/j.nicl.2017.04.017
    OpenUrlCrossRefPubMed
  3. ↵
    Avants, B. B., Tustison, N., & Song, G. (2009). Advanced normalization tools (ANTS). Insight j, 2(365), 1– 35.
    OpenUrl
  4. ↵
    Barkovich, A. J. (2000). Concepts of myelin and myelination in neuroradiology. AJNR. American Journal of Neuroradiology, 21(6), 1099–1109.
    OpenUrlPubMedWeb of Science
  5. ↵
    Baum, J., Tycko, R., & Pines, A. (1985). Broadband and adiabatic inversion of a two-level system by phase-modulated pulses. Physical Review A, 32(6), 3435–3447. doi:10.1103/PhysRevA.32.3435
    OpenUrlCrossRefPubMed
  6. ↵
    Beaumont, J., Gambarota, G., Saint-Jalmes, H., Acosta, O., Ferré, J., Raniga, P., & Fripp, J. (2021). High- resolution multi-T 1 –weighted contrast and T 1 mapping with low sensitivity using the fluid and white matter suppression (FLAWS) sequence at 7T. Magnetic Resonance in Medicine, 85(3), 1364– 1378. doi:10.1002/mrm.28517
    OpenUrlCrossRef
  7. ↵
    Beaumont, J., Saint-Jalmes, H., Acosta, O., Kober, T., Tanner, M., Ferré, J. C., Salvado, O., Fripp, J., & Gambarota, G. (2019). Multi T1-weighted contrast MRI with fluid and white matter suppression at 1.5 T. Magnetic Resonance Imaging, 63, 217–225. doi:10.1016/j.mri.2019.08.010
    OpenUrlCrossRef
  8. ↵
    Blystad, I., Warntjes, J. B. M., Smedby, Ö., Lundberg, P., Larsson, E.-M., & Tisell, A. (2017). Quantitative MRI for analysis of peritumoral edema in malignant gliomas. PLOS ONE, 12(5), e0177135. doi:10.1371/journal.pone.0177135
    OpenUrlCrossRefPubMed
  9. ↵
    Brix, G., Schad, L. R., Deimling, M., & Lorenz, W. J. (1990). Fast and precise T1 imaging using a TOMROP sequence. Magnetic Resonance Imaging, 8(4), 351–356. doi:10.1016/0730-725X(90)90041-Y
    OpenUrlCrossRefPubMedWeb of Science
  10. ↵
    Caan, M. W. A., Bazin, P., Marques, J. P., de Hollander, G., Dumoulin, S. O., & van der Zwaag, W. (2019). MP2RAGEME: T 1, T 2 *, and QSM mapping in one sequence at 7 tesla. Human Brain Mapping, 40(6), 1786–1798. doi:10.1002/hbm.24490
    OpenUrlCrossRef
  11. ↵
    Callaghan, M. F., Freund, P., Draganski, B., Anderson, E., Cappelletti, M., Chowdhury, R., Diedrichsen, J., FitzGerald, T. H. B., Smittenaar, P., Helms, G., Lutti, A., & Weiskopf, N. (2014). Widespread age-related differences in the human brain microstructure revealed by quantitative magnetic resonance imaging. Neurobiology of Aging, 35(8), 1862–1872. doi:10.1016/j.neurobiolaging.2014.02.008
    OpenUrlCrossRefPubMed
  12. ↵
    Candes, E. J., & Wakin, M. B. (2008). An Introduction To Compressive Sampling. IEEE Signal Processing Magazine, 25(2), 21–30. doi:10.1109/MSP.2007.914731
    OpenUrlCrossRefWeb of Science
  13. ↵
    Cercignani, M., Dowell, N. G., & Tofts, P. S. (2018). Quantitative MRI of the brain: principles of physical measurement.
  14. ↵
    Chen, X., Qian, T., Kober, T., Zhang, G., Ren, Z., Yu, T., Piao, Y., Chen, N., & Li, K. (2018). Gray-matter-specific MR imaging improves the detection of epileptogenic zones in focal cortical dysplasia: A new sequence called fluid and white matter suppression (FLAWS). NeuroImage: Clinical, 20, 388–397. doi:10.1016/j.nicl.2018.08.010
    OpenUrlCrossRefPubMed
  15. ↵
    Cho, S., Jones, D., Reddick, W. E., Ogg, R. J., & Steen, R. G. (1997). Establishing norms for age-related changes in proton T1 of human brain tissue in vivo. Magnetic Resonance Imaging, 15(10), 1133– 1143. doi:10.1016/S0730-725X(97)00202-6
    OpenUrlCrossRefPubMedWeb of Science
  16. ↵
    Christensen, K. A., Grant, D. M., Schulman, E. M., & Walling, C. (1974). Optimal determination of relaxation times of fourier transform nuclear magnetic resonance. Determination of spin-lattice relaxation times in chemically polarized species. The Journal of Physical Chemistry, 78(19), 1971– 1977. doi:10.1021/j100612a022
    OpenUrlCrossRef
  17. ↵
    Chung, S., Kim, D., Breton, E., & Axel, L. (2010). Rapid B 1 + mapping using a preconditioning RF pulse with TurboFLASH readout. Magnetic Resonance in Medicine, 64(2), 439–446. doi:10.1002/mrm.22423
    OpenUrlCrossRefPubMed
  18. ↵
    Collins, D. L., Neelin, P., Peters, T. M., & Evans, A. C. (1994). Automatic 3D intersubject registration of MR volumetric data in standardized Talairach space. Journal of Computer Assisted Tomography, 18(2), 192–205.
    OpenUrlCrossRefPubMedWeb of Science
  19. ↵
    Crawley, A. P., & Henkelman, R. M. (1988). A comparison of one-shot and recovery methods in T1 imaging. Magnetic Resonance in Medicine, 7(1), 23–34. doi:10.1002/mrm.1910070104
    OpenUrlCrossRefPubMed
  20. ↵
    Dale, A. M., Fischl, B., & Sereno, M. I. (1999). Cortical Surface-Based Analysis. NeuroImage, 9(2), 179–194. doi:10.1006/nimg.1998.0395
    OpenUrlCrossRefPubMedWeb of Science
  21. ↵
    Deichmann, R., & Haase, A. (1992). Quantification of T1 values by SNAPSHOT-FLASH NMR imaging. Journal of Magnetic Resonance (1969), 96(3), 608–612. doi:10.1016/0022-2364(92)90347-A
    OpenUrlCrossRefWeb of Science
  22. ↵
    Deoni, S. C. L. (2007). High-resolution T1 mapping of the brain at 3T with driven equilibrium single pulse observation of T1 with high-speed incorporation of RF field inhomogeneities (DESPOT1-HIFI). Journal of Magnetic Resonance Imaging, 26(4), 1106–1111. doi:10.1002/jmri.21130
    OpenUrlCrossRefPubMedWeb of Science
  23. ↵
    Deoni, S. C. L. (2010). Quantitative Relaxometry of the Brain. Topics in Magnetic Resonance Imaging, 21(2), 101–113. doi:10.1097/RMR.0b013e31821e56d8
    OpenUrlCrossRefPubMed
  24. ↵
    Deoni, S. C. L., Rutt, B. K., & Peters, T. M. (2003). Rapid combined T 1 and T 2 mapping using gradient recalled acquisition in the steady state. Magnetic Resonance in Medicine, 49(3), 515–526. doi:10.1002/mrm.10407
    OpenUrlCrossRefPubMed
  25. ↵
    Dokumaci AS, V. K. T.-T. R. B. P. E. M. W. T. C. C. S. J. W. T. G. S. H. J. M. S. O. J. C. DW. (2022). Evaluation of quantitative T1 and PD mapping at 7T from an MP2RAGE Sequence optimised to obtain UNI and FLAWS contrast images in a single scan. In Proc. Intl. Soc. Magn. Reson. Med. (Vol. 30, p. 1244).
    OpenUrl
  26. ↵
    Dokumacı, A. S., Aitken, F. R., Sedlacik, J., Bridgen, P., Tomi-Tricot, R., Mooiweer, R., Vecchiato, K., Wilkinson, T., Casella, C., Giles, S., Hajnal, J. V., Malik, S. J., O’Muircheartaigh, J., & Carmichael, D. W. (2023). Simultaneous Optimization of MP2RAGE T1-weighted (UNI) and FLuid And White matter Suppression (FLAWS) brain images at 7T using Extended Phase Graph (EPG) Simulations. Magnetic Resonance in Medicine, 89(3), 937–950. doi:10.1002/mrm.29479
    OpenUrlCrossRef
  27. ↵
    Donoho, D. L. (2006). Compressed sensing. IEEE Transactions on Information Theory, 52(4), 1289–1306. doi:10.1109/TIT.2006.871582
    OpenUrlCrossRefWeb of Science
  28. ↵
    Eggenschwiler, F., Kober, T., Magill, A. W., Gruetter, R., & Marques, J. P. (2012). SA2RAGE: A new sequence for fast B 1 + -mapping. Magnetic Resonance in Medicine, 67(6), 1609–1619. doi:10.1002/mrm.23145
    OpenUrlCrossRefPubMed
  29. ↵
    Eminian, S., Hajdu, S. D., Meuli, R. A., Maeder, P., & Hagmann, P. (2018). Rapid high resolution T1 mapping as a marker of brain development: Normative ranges in key regions of interest. PLOS ONE, 13(6), e0198250. doi:10.1371/journal.pone.0198250
    OpenUrlCrossRef
  30. ↵
    Engström, M., Warntjes, J. B. M., Tisell, A., Landtblom, A.-M., & Lundberg, P. (2014). Multi-Parametric Representation of Voxel-Based Quantitative Magnetic Resonance Imaging. PLoS ONE, 9(11), e111688. doi:10.1371/journal.pone.0111688
    OpenUrlCrossRefPubMed
  31. ↵
    Fautz, H. P., Vogel, M., Gross, P., Kerr, A., & Zhu, Y. (2008). B1 mapping of coil arrays for parallel transmission. Proceedings of the 16th Annual Meeting of ISMRM, Toronto, Canada, 1247.
  32. ↵
    Fischl, B. (2004). Automatically Parcellating the Human Cerebral Cortex. Cerebral Cortex, 14(1), 11–22. doi:10.1093/cercor/bhg087
    OpenUrlCrossRefPubMedWeb of Science
  33. ↵
    Fischl, B. (2012). FreeSurfer. NeuroImage, 62(2), 774–781. doi:10.1016/j.neuroimage.2012.01.021
    OpenUrlCrossRefPubMedWeb of Science
  34. ↵
    Fischl, B., & Dale, A. M. (2000). Measuring the thickness of the human cerebral cortex from magnetic resonance images. Proceedings of the National Academy of Sciences, 97(20), 11050–11055. doi:10.1073/pnas.200033797
    OpenUrlAbstract/FREE Full Text
  35. ↵
    Fischl, B., Liu, A., & Dale, A. M. (2001). Automated manifold surgery: constructing geometrically accurate and topologically correct models of the human cerebral cortex. IEEE Transactions on Medical Imaging, 20(1), 70–80. doi:10.1109/42.906426
    OpenUrlCrossRefPubMedWeb of Science
  36. ↵
    Fischl, B., Salat, D. H., Busa, E., Albert, M., Dieterich, M., Haselgrove, C., van der Kouwe, A., Killiany, R., Kennedy, D., Klaveness, S., Montillo, A., Makris, N., Rosen, B., & Dale, A. M. (2002). Whole Brain Segmentation. Neuron, 33(3), 341–355. doi:10.1016/S0896-6273(02)00569-X
    OpenUrlCrossRefPubMedWeb of Science
  37. ↵
    Fischl, B., Sereno, M. I., & Dale, A. M. (1999). Cortical Surface-Based Analysis. NeuroImage, 9(2), 195–207. doi:10.1006/nimg.1998.0396
    OpenUrlCrossRefPubMedWeb of Science
  38. ↵
    Fischl, B., Sereno, M. I., Tootell, R. B., & Dale, A. M. (1999). High-resolution intersubject averaging and a coordinate system for the cortical surface. Human Brain Mapping, 8(4), 272–284. doi:10.1002/(sici)1097-0193(1999)8:4<272::aid-hbm10>3.0.co;2-4
    OpenUrlCrossRefPubMedWeb of Science
  39. ↵
    Frahm, J., Haase, A., & Matthaei, D. (1986). Rapid Three-Dimensional MR Imaging Using the FLASH Technique. Journal of Computer Assisted Tomography, 10(2), 363–368. doi:10.1097/00004728-198603000-00046
    OpenUrlCrossRefPubMedWeb of Science
  40. ↵
    Fram, E. K., Herfkens, R. J., Johnson, G. A., Glover, G. H., Karis, J. P., Shimakawa, A., Perkins, T. G., & Pelc, N. J. (1987). Rapid calculation of T1 using variable flip angle gradient refocused imaging. Magnetic Resonance Imaging, 5(3), 201–208. doi:10.1016/0730-725X(87)90021-X
    OpenUrlCrossRefPubMedWeb of Science
  41. ↵
    Gracien, R.-M., Nürnberger, L., Hok, P., Hof, S.-M., Reitz, S. C., Rüb, U., Steinmetz, H., Hilker-Roggendorf, R., Klein, J. C., Deichmann, R., & Baudrexel, S. (2017). Evaluation of brain ageing: a quantitative longitudinal MRI study over 7 years. European Radiology, 27(4), 1568–1576. doi:10.1007/s00330-016-4485-1
    OpenUrlCrossRefPubMed
  42. ↵
    Graumann, R., Fischer, H., & Oppelt, A. (1986). A new pulse sequence for determining T 1 and T 2 simultaneously. Medical Physics, 13(5), 644–647. doi:10.1118/1.595867
    OpenUrlCrossRefPubMed
  43. ↵
    Griswold, M. A., Jakob, P. M., Heidemann, R. M., Nittka, M., Jellus, V., Wang, J., Kiefer, B., & Haase, A. (2002). Generalized autocalibrating partially parallel acquisitions (GRAPPA). Magnetic Resonance in Medicine, 47(6), 1202–1210. doi:10.1002/mrm.10171
    OpenUrlCrossRefPubMedWeb of Science
  44. ↵
    Gupta, R. K. (1977). A new look at the method of variable nutation angle for the measurement of spin-lattice relaxation times using fourier transform NMR. Journal of Magnetic Resonance (1969), 25(1), 231–235. doi:10.1016/0022-2364(77)90138-X
    OpenUrlCrossRef
  45. ↵
    Haast, R. A. M., Ivanov, D., & Uludağ, K. (2018). The impact of correction on <scp>MP2RAGE</scp> cortical <scp>T</scp> 1 and apparent cortical thickness at 7 <scp>T</scp>. Human Brain Mapping, 39(6), 2412–2425. doi:10.1002/hbm.24011
    OpenUrlCrossRef
  46. ↵
    Haast, R. A. M., Lau, J. C., Ivanov, D., Menon, R. S., Uludağ, K., & Khan, A. R. (2021). Effects of MP2RAGE B1+ sensitivity on inter-site T1 reproducibility and hippocampal morphometry at 7T. NeuroImage, 224, 117373. doi:10.1016/j.neuroimage.2020.117373
    OpenUrlCrossRef
  47. ↵
    Hagiwara, A., Fujimoto, K., Kamagata, K., Murata, S., Irie, R., Kaga, H., Someya, Y., Andica, C., Fujita, S., Kato, S., Fukunaga, I., Wada, A., Hori, M., Tamura, Y., Kawamori, R., Watada, H., & Aoki, S. (2021). Age-Related Changes in Relaxation Times, Proton Density, Myelin, and Tissue Volumes in Adult Brain Analyzed by 2-Dimensional Quantitative Synthetic Magnetic Resonance Imaging. Investigative Radiology, 56(3), 163–172. doi:10.1097/RLI.0000000000000720
    OpenUrlCrossRef
  48. ↵
    Hahn, E. L. (1950). Spin Echoes. Physical Review, 80(4), 580–594. doi:10.1103/PhysRev.80.580
    OpenUrlCrossRefWeb of Science
  49. ↵
    Helms, G., Dathe, H., Kallenberg, K., & Dechent, P. (2008). High-resolution maps of magnetization transfer with inherent correction for RF inhomogeneity and T 1 relaxation obtained from 3D FLASH MRI. Magnetic Resonance in Medicine, 60(6), 1396–1407. doi:10.1002/mrm.21732
    OpenUrlCrossRefPubMedWeb of Science
  50. ↵
    Henderson, E., McKinnon, G., Lee, T.-Y., & Rutt, B. K. (1999). A fast 3D Look-Locker method for volumetric T1 mapping. Magnetic Resonance Imaging, 17(8), 1163–1171. doi:10.1016/S0730-725X(99)00025-9
    OpenUrlCrossRefPubMed
  51. ↵
    Homer, J., & Beevers, M. S. (1985). Driven-equilibrium single-pulse observation of T1 relaxation. A reevaluation of a rapid “new” method for determining NMR spin-lattice relaxation times. Journal of Magnetic Resonance (1969), 63(2), 287–297. doi:10.1016/0022-2364(85)90318-X
    OpenUrlCrossRef
  52. ↵
    Hung, W., Chen, P., Chuang, T., Chang, H., & Wu, M. (2013). High resolution volumetric T1 mapping using a novel MP3RAGE method. International Society for Magnetic Resonance in Medicine Annual Meeting, 2353.
  53. ↵
    Jenkinson, M., Beckmann, C. F., Behrens, T. E. J., Woolrich, M. W., & Smith, S. M. (2012). FSL. NeuroImage, 62(2), 782–790. doi:10.1016/j.neuroimage.2011.09.015
    OpenUrlCrossRefPubMedWeb of Science
  54. ↵
    Labadie, C., Lee, J., Rooney, W. D., Jarchow, S., Aubert-Frécon, M., Springer, C. S., & Möller, H. E. (2014). Myelin water mapping by spatially regularized longitudinal relaxographic imaging at high magnetic fields. Magnetic Resonance in Medicine, 71(1), 375–387. doi:10.1002/mrm.24670
    OpenUrlCrossRef
  55. ↵
    Leipert, T. K., & Marquardt, D. W. (1976). Statistical analysis of NMR spin-lattice relaxation times. Journal of Magnetic Resonance (1969), 24(2), 181–199. doi:10.1016/0022-2364(76)90027-5
    OpenUrlCrossRef
  56. ↵
    Li, X., Morgan, P. S., Ashburner, J., Smith, J., & Rorden, C. (2016). The first step for neuroimaging data analysis: DICOM to NIfTI conversion. Journal of Neuroscience Methods, 264, 47–56. doi:10.1016/j.jneumeth.2016.03.001
    OpenUrlCrossRefPubMed
  57. ↵
    Look, D. C., & Locker, D. R. (1968). Nuclear Spin-Lattice Relaxation Measurements by Tone-Burst Modulation. Physical Review Letters, 20(18), 987–989. doi:10.1103/PhysRevLett.20.987
    OpenUrlCrossRef
  58. ↵
    Look, D. C., & Locker, D. R. (1970). Time saving in measurement of NMR and EPR relaxation times. Review of Scientific Instruments, 41(2), 250–251.
    OpenUrlCrossRef
  59. ↵
    Lustig, M., Donoho, D., & Pauly, J. M. (2007). Sparse MRI: The application of compressed sensing for rapid MR imaging. Magnetic Resonance in Medicine, 58(6), 1182–1195. doi:10.1002/mrm.21391
    OpenUrlCrossRefPubMedWeb of Science
  60. ↵
    Lutti, A., Dick, F., Sereno, M. I., & Weiskopf, N. (2014). Using high-resolution quantitative mapping of R1 as an index of cortical myelination. NeuroImage, 93, 176–188. doi:10.1016/j.neuroimage.2013.06.005
    OpenUrlCrossRefPubMed
  61. ↵
    Ma, Y.-J., Moazamian, D., Port, J. D., Edjlali, M., Pruvo, J.-P., Hacein-Bey, L., Hoggard, N., Paley, M. N. J., Menon, D. K., Bonekamp, D., Pravatà, E., Garwood, M., Danesh-Meyer, H., Condron, P., Cornfeld, D. M., Holdsworth, S. J., Du, J., & Bydder, G. M. (2023). Targeted magnetic resonance imaging (tMRI) of small changes in the T1 and spatial properties of normal or near normal appearing white and gray matter in disease of the brain using divided subtracted inversion recovery (dSIR) and divided reverse subtracted inversion recovery (drSIR) sequences. Quantitative Imaging in Medicine and Surgery, 13(10), 7304–7337. doi:10.21037/qims-23-232
    OpenUrlCrossRef
  62. ↵
    Manjón, J. V., Coupé, P., Martí-Bonmatí, L., Collins, D. L., & Robles, M. (2010). Adaptive non-local means denoising of MR images with spatially varying noise levels. Journal of Magnetic Resonance Imaging, 31(1), 192–203. doi:10.1002/jmri.22003
    OpenUrlCrossRefPubMed
  63. ↵
    Marques, J. P., & Gruetter, R. (2013). New Developments and Applications of the MP2RAGE Sequence -Focusing the Contrast and High Spatial Resolution R1 Mapping. PLoS ONE, 8(7), e69294. doi:10.1371/journal.pone.0069294
    OpenUrlCrossRefPubMed
  64. ↵
    Marques, J. P., Kober, T., Krueger, G., van der Zwaag, W., Van de Moortele, P.-F., & Gruetter, R. (2010). MP2RAGE, a self bias-field corrected sequence for improved segmentation and T1-mapping at high field. NeuroImage, 49(2), 1271–1281. doi:10.1016/j.neuroimage.2009.10.002
    OpenUrlCrossRefPubMedWeb of Science
  65. ↵
    Marques, J. P., & Norris, D. G. (2018). How to choose the right MR sequence for your research question at 7 T and above? NeuroImage, 168, 119–140. doi:10.1016/j.neuroimage.2017.04.044
    OpenUrlCrossRef
  66. ↵
    Martin, A., Emorine, T., Megdiche, I., Créange, A., Kober, T., Massire, A., & Bapst, B. (2023). Accurate Diagnosis of Cortical and Infratentorial Lesions in Multiple Sclerosis Using Accelerated Fluid and White Matter Suppression Imaging. Investigative Radiology, 58(5), 337–345. doi:10.1097/RLI.0000000000000939
    OpenUrlCrossRef
  67. ↵
    Massire, A., Seiler, C., Troalen, T., Girard, O. M., Lehmann, P., Brun, G., Bartoli, A., Audoin, B., Bartolomei, F., Pelletier, J., Callot, V., Kober, T., Ranjeva, J.-P., & Guye, M. (2021). T1-Based Synthetic Magnetic Resonance Contrasts Improve Multiple Sclerosis and Focal Epilepsy Imaging at 7 T. Investigative Radiology, 56(2), 127–133. doi:10.1097/RLI.0000000000000718
    OpenUrlCrossRef
  68. ↵
    McDowell, A. R., Shelmerdine, S. C., Carmichael, D. W., & Arthurs, O. J. (2018). High resolution isotropic diffusion imaging in post-mortem neonates: a feasibility study. The British Journal of Radiology, 91(1092), 20180319. doi:10.1259/bjr.20180319
    OpenUrlCrossRef
  69. ↵
    Metere, R., Kober, T., Möller, H. E., & Schäfer, A. (2017). Simultaneous Quantitative MRI Mapping of T1, T2* and Magnetic Susceptibility with Multi-Echo MP2RAGE. PLOS ONE, 12(1), e0169265. doi:10.1371/journal.pone.0169265
    OpenUrlCrossRef
  70. ↵
    Mezer, A., Rokem, A., Berman, S., Hastie, T., & Wandell, B. A. (2016). Evaluating quantitative proton- density-mapping methods. Human Brain Mapping, 37(10), 3623–3635. doi:10.1002/hbm.23264
    OpenUrlCrossRefPubMed
  71. ↵
    Mugler, J. P., & Brookeman, J. R. (1990). Three-dimensional magnetization-prepared rapid gradient-echo imaging (3D MP RAGE). Magnetic Resonance in Medicine, 15(1), 152–157. doi:10.1002/mrm.1910150117
    OpenUrlCrossRefPubMedWeb of Science
  72. ↵
    Müller, J., La Rosa, F., Beaumont, J., Tsagkas, C., Rahmanzadeh, R., Weigel, M., Bach Cuadra, M., Gambarota, G., & Granziera, C. (2022). Fluid and White Matter Suppression. Investigative Radiology, 57(9), 592–600. doi:10.1097/RLI.0000000000000877
    OpenUrlCrossRef
  73. ↵
    Mussard, E., Hilbert, T., Forman, C., Meuli, R., Thiran, J., & Kober, T. (2020). Accelerated MP2RAGE imaging using Cartesian phyllotaxis readout and compressed sensing reconstruction. Magnetic Resonance in Medicine, 84(4), 1881–1894. doi:10.1002/mrm.28244
    OpenUrlCrossRefPubMed
  74. Non-Uniform Intensity Correction. http://www.bic.mni.mcgill.ca/software/N3/node6.html. (n.d.).
  75. ↵
    Olsson, H., Andersen, M., Kadhim, M., & Helms, G. (2022). MP3RAGE: Simultaneous mapping of T 1 and B1+ in human brain at 7T. Magnetic Resonance in Medicine, 87(6), 2637–2649. doi:10.1002/mrm.29151
    OpenUrlCrossRef
  76. ↵
    Penny, W., Friston, K., Ashburner, J., Kiebel, S., & Nichols, T. (2007). Statistical Parametric Mapping: The Analysis of Functional Brain Images. doi:10.1016/B978-0-12-372560-8.X5000-1
    OpenUrlCrossRef
  77. ↵
    Puy, G., Vandergheynst, P., Gribonval, R., & Wiaux, Y. (2012). Universal and efficient compressed sensing by spread spectrum and application to realistic Fourier imaging techniques. EURASIP Journal on Advances in Signal Processing, 2012(1), 6. doi:10.1186/1687-6180-2012-6
    OpenUrlCrossRef
  78. ↵
    Rioux, J. A., Saranathan, M., & Rutt, B. K. (2014). Simultaneous whole-brain t1 and flip angle mapping with MP3RAGE. Proceedings of the 22nd Annual Meeting of ISMRM, Milan, Italy, 3216.
  79. ↵
    Saito, N., Watanabe, M., Sakai, O., & Jara, H. (2012). Human lifespan age-related changes of the brain proton density by quantitative MRI. Proceedings of the 20th Annual Meeting of ISMRM, 780.
  80. ↵
    Shah, N. J., Neeb, H., Kircheis, G., Engels, P., Häussinger, D., & Zilles, K. (2008). Quantitative cerebral water content mapping in hepatic encephalopathy. NeuroImage, 41(3), 706–717. doi:10.1016/j.neuroimage.2008.02.057
    OpenUrlCrossRefPubMed
  81. ↵
    Silver, M. S., Joseph, R. I., & Hoult, D. I. (1984). Highly selective and π pulse generation. Journal of Magnetic Resonance (1969), 59(2), 347–351. doi:10.1016/0022-2364(84)90181-1
    OpenUrlCrossRef
  82. ↵
    Sled, J. G., Zijdenbos, A. P., & Evans, A. C. (1997). A Comparison of Retrospective Intensity Non-uniformity Correction Methods for MRI. Information Processing in Medical Imaging. https://api.semanticscholar.org/CorpusID:27760780
  83. ↵
    Sled, J. G., Zijdenbos, A. P., & Evans, A. C. (1998). A nonparametric method for automatic correction of intensity nonuniformity in MRI data. IEEE Transactions on Medical Imaging, 17(1), 87–97. doi:10.1109/42.668698
    OpenUrlCrossRefPubMedWeb of Science
  84. ↵
    Smith, S. M., Jenkinson, M., Woolrich, M. W., Beckmann, C. F., Behrens, T. E. J., Johansen-Berg, H., Bannister, P. R., De Luca, M., Drobnjak, I., Flitney, D. E., Niazy, R. K., Saunders, J., Vickers, J., Zhang, Y., De Stefano, N., Brady, J. M., & Matthews, P. M. (2004). Advances in functional and structural MR image analysis and implementation as FSL. NeuroImage, 23, S208–S219. doi:10.1016/j.neuroimage.2004.07.051
    OpenUrlCrossRefPubMedWeb of Science
  85. ↵
    Tabelow, K., Balteau, E., Ashburner, J., Callaghan, M. F., Draganski, B., Helms, G., Kherif, F., Leutritz, T., Lutti, A., Phillips, C., Reimer, E., Ruthotto, L., Seif, M., Weiskopf, N., Ziegler, G., & Mohammadi, S. (2019). hMRI – A toolbox for quantitative MRI in neuroscience and clinical research. NeuroImage, 194, 191–210. doi:10.1016/j.neuroimage.2019.01.029
    OpenUrlCrossRef
  86. ↵
    Tanner, M., Gambarota, G., Kober, T., Krueger, G., Erritzoe, D., Marques, J. P., & Newbould, R. (2012). Fluid and white matter suppression with the MP2RAGE sequence. Journal of Magnetic Resonance Imaging, 35(5), 1063–1070. doi:10.1002/jmri.23532
    OpenUrlCrossRefPubMed
  87. ↵
    Tofts, P. (2003). Quantitative MRI of the Brain (P. Tofts, Ed.). Wiley. doi:10.1002/0470869526
    OpenUrlCrossRef
  88. ↵
    Trotier, A. J., Dilharreguy, B., Anandra, S., Corbin, N., Lefrançois, W., Ozenne, V., Miraux, S., & Ribot, E. J. (2022). The Compressed Sensing MP2RAGE as a Surrogate to the MPRAGE for Neuroimaging at 3 T. Investigative Radiology, 57(6), 366–378. doi:10.1097/RLI.0000000000000849
    OpenUrlCrossRefPubMed
  89. ↵
    Trotier, A. J., Rapacchi, S., Faller, T. L., Miraux, S., & Ribot, E. J. (2019). Compressed-Sensing MP2RAGE sequence: Application to the detection of brain metastases in mice at 7T. Magnetic Resonance in Medicine, 81(1), 551–559. doi:10.1002/mrm.27438
    OpenUrlCrossRef
  90. ↵
    Tustison, N. J., Avants, B. B., Cook, P. A., Yuanjie Zheng, Egan, A., Yushkevich, P. A., & Gee, J. C. (2010). N4ITK: Improved N3 Bias Correction. IEEE Transactions on Medical Imaging, 29(6), 1310–1320. doi:10.1109/TMI.2010.2046908
    OpenUrlCrossRefPubMedWeb of Science
  91. ↵
    Urushibata, Y., Kuribayashi, H., Fujimoto, K., Kober, T., Grinstead, J. W., Isa, T., & Okada, T. (2019). Advantages of fluid and white matter suppression (FLAWS) with MP2RAGE compared with double inversion recovery turbo spin echo (DIR-TSE) at 7T. European Journal of Radiology, 116, 160–164. doi:10.1016/j.ejrad.2019.04.019
    OpenUrlCrossRef
  92. ↵
    Van de Moortele, P.-F., Auerbach, E. J., Olman, C., Yacoub, E., Uğurbil, K., & Moeller, S. (2009). T1 weighted brain images at 7 Tesla unbiased for Proton Density, T2⁎ contrast and RF coil receive B1 sensitivity with simultaneous vessel visualization. NeuroImage, 46(2), 432–446. doi:10.1016/j.neuroimage.2009.02.009
    OpenUrlCrossRefPubMedWeb of Science
  93. ↵
    Vasanawala, S. S., Alley, M. T., Hargreaves, B. A., Barth, R. A., Pauly, J. M., & Lustig, M. (2010). Improved Pediatric MR Imaging with Compressed Sensing. Radiology, 256(2), 607–616. doi:10.1148/radiol.10091218
    OpenUrlCrossRefPubMed
  94. ↵
    Weiskopf, N., Suckling, J., Williams, G., Correia, M. M., Inkster, B., Tait, R., Ooi, C., Bullmore, E. T., & Lutti, A. (2013). Quantitative multi-parameter mapping of R1, PD*, MT, and R2* at 3T: a multi-center validation. Frontiers in Neuroscience, 7. doi:10.3389/fnins.2013.00095
    OpenUrlCrossRefPubMed
  95. ↵
    Wright, P. J., Mougin, O. E., Totman, J. J., Peters, A. M., Brookes, M. J., Coxon, R., Morris, P. E., Clemence, M., Francis, S. T., Bowtell, R. W., & Gowland, P. A. (2008). Water proton T1 measurements in brain tissue at 7, 3, and 1.5T using IR-EPI, IR-TSE, and MPRAGE: results and optimization. Magnetic Resonance Materials in Physics, Biology and Medicine, 21(1), 121. doi:10.1007/s10334-008-0104-8
    OpenUrlCrossRefPubMed
  96. ↵
    Xiaowei He (2024). Positive-zero-negative colorbar (https://www.mathworks.com/matlabcentral/fileexchange/110190-positive-zero-negative-colorbar), MATLAB Central File Exchange. Retrieved January 26, 2024. (n.d.).
  97. ↵
    Yarnykh, V. L. (2007). Actual flip-angle imaging in the pulsed steady state: A method for rapid three- dimensional mapping of the transmitted radiofrequency field. Magnetic Resonance in Medicine, 57(1), 192–200. doi:10.1002/mrm.21120
    OpenUrlCrossRefPubMed
Back to top
PreviousNext
Posted July 01, 2024.
Download PDF

Supplementary Material

Data/Code
Email

Thank you for your interest in spreading the word about medRxiv.

NOTE: Your email address is requested solely to identify you as the sender of this article.

Enter multiple addresses on separate lines or separate them with commas.
Quantitative T1 and Effective Proton Density (PD*) mapping in children and adults at 7T from an MP2RAGE sequence optimised for uniform T1-weighted (UNI) and FLuid And White matter Suppression (FLAWS) contrasts
(Your Name) has forwarded a page to you from medRxiv
(Your Name) thought you would like to see this page from the medRxiv website.
CAPTCHA
This question is for testing whether or not you are a human visitor and to prevent automated spam submissions.
Share
Quantitative T1 and Effective Proton Density (PD*) mapping in children and adults at 7T from an MP2RAGE sequence optimised for uniform T1-weighted (UNI) and FLuid And White matter Suppression (FLAWS) contrasts
Ayşe Sıla Dokumacı, Katy Vecchiato, Raphael Tomi-Tricot, Michael Eyre, Philippa Bridgen, Pierluigi Di Cio, Chiara Casella, Tobias C. Wood, Jan Sedlacik, Tom Wilkinson, Sharon L. Giles, Joseph V. Hajnal, Jonathan O’Muircheartaigh, Shaihan J. Malik, David W. Carmichael
medRxiv 2024.06.28.24307535; doi: https://doi.org/10.1101/2024.06.28.24307535
Twitter logo Facebook logo LinkedIn logo Mendeley logo
Citation Tools
Quantitative T1 and Effective Proton Density (PD*) mapping in children and adults at 7T from an MP2RAGE sequence optimised for uniform T1-weighted (UNI) and FLuid And White matter Suppression (FLAWS) contrasts
Ayşe Sıla Dokumacı, Katy Vecchiato, Raphael Tomi-Tricot, Michael Eyre, Philippa Bridgen, Pierluigi Di Cio, Chiara Casella, Tobias C. Wood, Jan Sedlacik, Tom Wilkinson, Sharon L. Giles, Joseph V. Hajnal, Jonathan O’Muircheartaigh, Shaihan J. Malik, David W. Carmichael
medRxiv 2024.06.28.24307535; doi: https://doi.org/10.1101/2024.06.28.24307535

Citation Manager Formats

  • BibTeX
  • Bookends
  • EasyBib
  • EndNote (tagged)
  • EndNote 8 (xml)
  • Medlars
  • Mendeley
  • Papers
  • RefWorks Tagged
  • Ref Manager
  • RIS
  • Zotero
  • Tweet Widget
  • Facebook Like
  • Google Plus One

Subject Area

  • Radiology and Imaging
Subject Areas
All Articles
  • Addiction Medicine (349)
  • Allergy and Immunology (668)
  • Allergy and Immunology (668)
  • Anesthesia (181)
  • Cardiovascular Medicine (2648)
  • Dentistry and Oral Medicine (316)
  • Dermatology (223)
  • Emergency Medicine (399)
  • Endocrinology (including Diabetes Mellitus and Metabolic Disease) (942)
  • Epidemiology (12228)
  • Forensic Medicine (10)
  • Gastroenterology (759)
  • Genetic and Genomic Medicine (4103)
  • Geriatric Medicine (387)
  • Health Economics (680)
  • Health Informatics (2657)
  • Health Policy (1005)
  • Health Systems and Quality Improvement (985)
  • Hematology (363)
  • HIV/AIDS (851)
  • Infectious Diseases (except HIV/AIDS) (13695)
  • Intensive Care and Critical Care Medicine (797)
  • Medical Education (399)
  • Medical Ethics (109)
  • Nephrology (436)
  • Neurology (3882)
  • Nursing (209)
  • Nutrition (577)
  • Obstetrics and Gynecology (739)
  • Occupational and Environmental Health (695)
  • Oncology (2030)
  • Ophthalmology (585)
  • Orthopedics (240)
  • Otolaryngology (306)
  • Pain Medicine (250)
  • Palliative Medicine (75)
  • Pathology (473)
  • Pediatrics (1115)
  • Pharmacology and Therapeutics (466)
  • Primary Care Research (452)
  • Psychiatry and Clinical Psychology (3432)
  • Public and Global Health (6527)
  • Radiology and Imaging (1403)
  • Rehabilitation Medicine and Physical Therapy (814)
  • Respiratory Medicine (871)
  • Rheumatology (409)
  • Sexual and Reproductive Health (410)
  • Sports Medicine (342)
  • Surgery (448)
  • Toxicology (53)
  • Transplantation (185)
  • Urology (165)