
Abstract
Background Developing medicine from scratch to governmental authorization and detecting adverse drug reactions (ADR) have barely been economical, expeditious, and risk-averse investments. The availability of large-scale observational healthcare databases and the popularity of large language models offer an unparalleled opportunity to enable automatic high-throughput drug screening for both repurposing and pharmacovigilance.
Objectives To demonstrate a general workflow for automatic high-throughput drug screening with the following advantages: (i) the association of various exposure on diseases can be estimated; (ii) both repurposing and pharmacovigilance are integrated; (iii) accurate exposure length for each prescription is parsed from clinical texts; (iv) intrinsic relationship between drugs and diseases are removed jointly by bioinformatic mapping and large language model - ChatGPT; (v) causal-wise interpretations for incidence rate contrasts are provided.
Methods Using a self-controlled cohort study design where subjects serve as their own control group, we tested the intention-to-treat association between medications on the incidence of diseases. Exposure length for each prescription is determined by parsing common dosages in English free text into a structured format. Exposure period starts from initial prescription to treatment discontinuation. A same exposure length preceding initial treatment is the control period. Clinical outcomes and categories are identified using existing phenotyping algorithms. Incident rate ratios (IRR) are tested using uniformly most powerful (UMP) unbiased tests.
Results We assessed 3,444 medications on 276 diseases on 6,613,198 patients from the Clinical Practice Research Datalink (CPRD), an UK primary care electronic health records (EHR) spanning from 1987 to 2018. Due to the built-in selection bias of self-controlled cohort studies, ingredients-disease pairs confounded by deterministic medical relationships are removed by existing map from RxNorm and nonexistent maps by calling ChatGPT. A total of 16,901 drug-disease pairs reveals significant risk reduction, which can be considered as candidates for repurposing, while a total of 11,089 pairs showed significant risk increase, where drug safety might be of a concern instead.
Conclusions This work developed a data-driven, nonparametric, hypothesis generating, and automatic high-throughput workflow, which reveals the potential of natural language processing in pharmacoepidemiology. We demonstrate the paradigm to a large observational health dataset to help discover potential novel therapies and adverse drug effects. The framework of this study can be extended to other observational medical databases.
1 Introduction
Currently approved treatment options for many diseases are limited, including cancer, Alzheimer’s disease, Parkinson’s disease, depressive and bipolar disorders, and HIV etc. As a consequence, there is a considerable unmet demand for disease-modifying medications for many disorders. Evolution of therapeutics for disease modification has not been successful due to restricted drug targets, high-expense, and time-consuming experiments. Meanwhile, there are more than 3,000 medications currently being prescribed in the UK, with many employed for specific indications. Extensive opportunities can be taken to repurpose existing medications for new indications, along with possible sequences of treatments for various groups of disorders.
Aside from discovering new uses, existing drugs must be overseen during their whole circulation for adverse drug reactions (ADR), also known as side-effects, and other unintended consequences. In the UK, ADRs may account for 5-8% of impromptu hospitalizations that result in 4-6% hospital beds filled, with an approximate annual bill of £1-2.5bn for the National Health Service (NHS) (Jordan et al., 2018). Before supervisory authorization, randomized clinical trials (RCTs), often considered as the gold standard for causal effects, serve as fundamental sources for ADRs. Though drugs have rigorous preapproval procedures in the UK, many ADRs with low incidence rates may not be discovered during clinical trials due to limited sample size with several thousand people, insufficient followup, highly-stratified population without certain diseases and/or history of drug classes, restricting causal effects to a subgroup with poor coincidence in real-world clinical scenarios. Therefore, only a partial list of undesired effects are known when new drugs are approved.
However, unknown ADRs are likely to appear and evolve into a threat to public health after releasing new drugs to the market. As millions of people with heterogeneous medical history may take the same drug, post-marketing pharmacovigilance systems are considered indispensable and worthwhile to detect and report ADRs in a timely manner. Currently, ADRs are detected by spontaneous reports where patients report individual negative symptoms to health professionals. This system is quite competent for instant recurrable reactions to therapies with low intrinsic risks. Since pre-exposure cases are generally not reported, spontaneous reports are not appropriate for ADRs with high inherent rates or delayed responses (Harpaz et al., 2013). Due to limitations of RCTs and spontaneous reports, evidence from observational studies has turned out be a vital source for post-approval drug surveillance owing to their population size, long pre- and post-exposure follow-up, and wide coverage of patients from all backgrounds.
The secondary use of longitudinal observational databases, including electronic health records (EHRs) and administrative claims, offer the possibility to characterize relationships between drugs and clinical outcomes with real-world insights (Shin et al., 2021). These types of data capture broad healthcare information including diagnoses from physicians, therapies filled for patients, lab tests, and other information, which have been actively used to conduct hypothesis-testing pharmacoepidemiology studies for causal effects of defined exposure on subsequent clinical outcomes. In recent years, there has been increasing interest in adopting these datasets to inform early drug development (Mittal et al., 2017), to identify novel treatment pathways (Yao et al., 2011), to fathom disease etiology as well as prevention, and to discover unknown benefits (Glicksberg et al., 2019) and side-effects of existing medications (Zhou et al., 2018) in a fast, large-scale data-driven, nonparametric, hypothesis generating, and high-throughput method.
Prior work employing identical study design have focused either on specific clinical outcomes (Kern et al., 2019, 2021; Teneralli et al., 2021; Kern et al., 2022) or particular drug class of interest (Cepeda et al., 2019). All these real-world applications concentrated on unacknowledged benefits of existing medications based on US administrative claims data. The other common type of observational data-electronic health records and the other direction of effects-unknown ADRs haven’t been investigated.
Empirical performance has been compared with several study designs (Ryan, Stang, et al., 2013; Norén et al., 2013) and assessed as a tool for risk identification in observational healthcare data (Ryan, Schuemie, et al., 2013; Ryan and Schuemie, 2013). Due to inadequate prescription information in claims data, a fixed 30 days gap between consecutive fills were utilized to calculate length of exposure. Previous applications also require manual removal of drug confounded by indication. Above-mentioned investigations focus merely on associations without relating target quantity to causal interpretation.
The year 2023 has seen an explosive growth of artificial intelligence generated content (AIGC) (Y. Cao et al., 2023; Gozalo-Brizuela and Garrido-Merchan, 2023; Bubeck et al., 2023; OpenAI, 2023b), especially the release a powerful large language model (LLM) ChatGPT-4 created by OpenAI (2023a). Though ChatGPT is a general language model (Wolfram, 2023), its application to healthcare has been demonstrated by chatbox (Lee et al., 2023). As a disruptor to the healthcare industry (Eloundou et al., 2023), its utility on epidemiology hasn’t been widely explored. We bring the power of ChatGPT into a pharmacoepidemiologic setting, aiming to remove known intertwined drug-disease pairs.
In this work, we aim to establish an automated framework to screen available drugs on possible diseases for both unknown positive and negative clinical signals with more accurate exposure length, auto-removal of drug-indication pairs, and causal-wise interpretation. Drug-disease pairs with significant risk reduction could inform potential treatment options for new indications while those pairs with significant risk increase may be monitored for drug safety.
2 Methods
2.1 Study design
We discuss the major limitation of existing pharmacoepidemiology study design for drug screening in Table 1. Depending on the target population, we can roughly categorize study designs into cohort study, case-control, spontaneous reporting systems, and other specific arrangements. Due to confounding by indication in observational health databases, the external control group in cohort studies has to have the same background conditions with the exposure group in order to ensure overlap. If this is not satisfied, researchers can barely interpret what particular contrasts are made, leading to spurious signals for drug screening. Real-world performance of cohort studies with external control group have been investigated by Ryan, Schuemie, et al. (2013); Norén et al. (2013). Since a self-controlled cohort study does not rely on any form of external control group, it becomes a natural choice for drug screening.
Limitations of existing pharmacoepidemiology study design for drug screening
The second category case-based design focuses on cases and can be further divided into case-control and self-controlled case-only depending on the existence of an external control group. Case-based methods are not suitable for drug screening since case-control requires an external control group while a self-controlled case-only study incorporates solely individuals who experience the outcome of interest. Detailed comparison of self-controlled case-only designs are available in Hallas and Pottegård (2014); Takeuchi et al. (2018) and empirical behavior of case-based methods has been studied by Madigan et al. (2013); Suchard et al. (2013). The third type is a disproportionality analysis of drug-disease combinations of spontaneous reports as explained in Huang et al. (2014). As disproportionality analysis depends entirely on case counts without bringing in person time as exposure length, this method can be appropriate for spontaneous reports but not healthcare data. DuMouchel et al. (2013) demonstrated this limitation using real-world data.
Method comparison and detailed demonstration of common pharmacoepidemiology studies are available in Murphy et al. (2011); OHDSI (2020). Schuemie et al. (2012); Ryan and Schuemie (2013); Ryan, Stang, et al. (2013); Ryan et al. (2012); Reps et al. (2013) assessed various study designs for risk identification by large simulation and empirical performance. Some other methods, such as tree-based scan statistic (Kulldorff et al., 2003, 2013) and supervised learning (Reps et al., 2014, 2015), have been devised but they failed to provide risk estimates. Remaining study designs, including case-specular, case-distribution, case-control-specular, case series, case reports, ecological study, and proportional mortality study, are not suitable for pharmacoepidemiology and are not explained here.
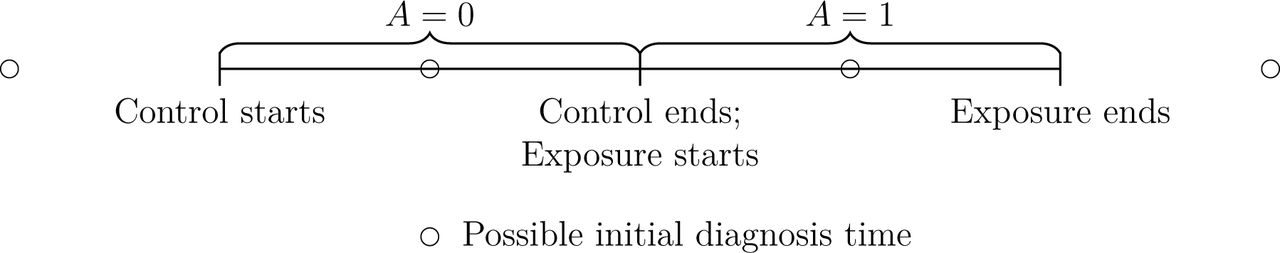
Owing to limitations of existing pharmacoepidemiology study design, we focus on the self-controlled cohort for high-throughput drug screening (Kern et al., 2019; Cepeda et al., 2019; Teneralli et al., 2021; Kern et al., 2021, 2022). As illustrated in Figure 1, a self-controlled cohort only uses new users of the drug of interest where individuals serve as their own controls to handle confounding, by contrasting incidence rate after exposure versus before exposure. Based on simulation studies, a self-controlled cohort revealed less biased estimates with better predictive performance than other study designs (Ryan, Schuemie, et al., 2013; Ryan and Schuemie, 2013; Schuemie et al., 2013, 2020).

Illustration of self-controlled cohort study design. An example studying the relationship of a drug-disease pair by incorporating all new drug-users into the cohort. Equal person-time are allocated to exposed period after initial prescription and to unexposed period before first treatment for each specific patient. Disease incidence can take place before unexposure starts, during unexposure, during exposure, after exposure ends, or never happens. This arrangement is replicated for available medications on possible diseases in the database.
2.2 Data sources
The screening is conducted on Clinical Practice Research Datalink (CPRD), an ongoing primary care database consisting of more than 60 million participants with 16 million currently registered patients among 674 general practices in the UK (https://www.cprd.com/). The follow-up started in 1987 and ended until mortality, transfer-out, or last collection of practice, whichever comes the earliest. The mean and standard deviation of follow-up are 16.77 years and 15.75 years. CPRD include diagnosis (coded in medcode), therapy (coded in prodcode and common dosages), lab tests, consultation, and referral information. The use of CPRD database is approved by Independent Scientific Advisory Committee (ISAC) with protocol 20_000207.
2.3 Exposure lengths
Raw prescription information is available in one of the CPRD tables “therapy”. For each prescription, the table contains patient id, “prodcode” for medicinal product, “eventdate” for prescription date, “qty” for total quantity prescribed, and “numdays” for duration entered by prescriber (“CPRD GOLD Data Specification”, 2021). By linking to the ‘common dosages’ table, “dose_duration”, estimated duration available for 1% of all data, and raw clinical text can be obtained for every prescription. The “eventdate” in the table is frequently considered as the start date of exposure. Although the stop date is not recorded, it can still be approximated by calculating exposure duration from several sources within existing CPRD data. “numdays” and “dose_duration” are two off-the-shelf variables but failed to work due to large percentage of missing (>95%). Even when present, these two variables are not flexible or variable in determining exposure lengths when dose frequency (DF), number of doses per day, and dose number (DN), number of tablets to take each time, belong to ranges rather than fixed values. As the percentage of missing is less than 5%, our last resort to calculate exposure period is to divide “qty” by the number of doses to be taken per day, also referred to as numeric daily dose (ndd), which can be computed by
 where DI represents dose interval (number of days between doses). DF, DN, and DI can all be parsed from unstructured free text written by general practitioners following Karys-tianis et al. (2015); Alfattni et al. (2022) using R package doseminer (Selby, 2021a). To extend exposure period by reducing “ndd” when clinical texts inform a range of plausible values, we set DF to max, DN and DI to min.
We describe the algorithm along with 10 decision nodes to process drug exposure from therapy data in CPRD in Table 2. There are other plausible options for each decision illustrated in Pye et al. (2018); Yimer et al. (2021b) with detailed description of each decision in Pye et al. (2018, Data S3). Note that these decisions for data preparation can influence risk attribution of clinical outcomes more or less.
10 decision nodes of the exposure preparation algorithm.
The conversion from raw data into a table with exposure length can be roughly realized in 3 broad steps. The initial cleaning step aims to correct missing and implausible values for “qty” and “ndd”. Though thresholds for medications can be obtained by medical knowledge and by scraping the British National Formulary (BNF) website https://bnf.nice.org.uk following Selby (2021b), the mapping between BNF products and drug substance in CPRD is modest. Thus for simplicity and completeness, we set the maximum of “qty” as 5,000, minimum of “qty” as 1, maximum of “ndd” as 50, and minimum of “ndd” as 1. The second step generates stop dates at the prescription level by “qty” and “ndd”. The last step starts by summing durations for the same medication with the same start dates. Then we overlook overlapping prescriptions due to enormous time-complexity when adding overlap to the end of subsequent prescriptions recursively for all drug users. To compensate for possible shorter exposure time, we allow for a maximum of 90-day gap between consecutive refills when constructing the exposure period. The first and second steps are implemented using R package drugprepr (Yimer et al., 2021a) while the last step leverages data.table to boost speed.
The first prescription date is considered as exposure start and the time from treatment initiation until discontinuation is considered as exposure end. Exposure time is then calculated by
 where “frd” stands for first registration date; “tod” represents transfer out date; “lcd” is last collection date (“CPRD GOLD Data Specification”, 2021). Then control start = exposure start−exposure time and update exposure end = exposure start+exposure time.
A minimum of 30 days exposure increases the chance to capture clinical outcomes. Once exposure period for each drug user is defined, longitudinal diagnosis history can be combined and assessed.
2.4 Outcome definitions
The first incidence of every disease and category is identified by using code lists phenotyped by validated bioinformatic algorithms from https://github.com/spiros/chronological-map-phenotypes/tree/master/primary_care (Kuan et al., 2019). Other code lists, such as https://www.phpc.cam.ac.uk/pcu/research/research-groups/crmh/cprd_cam/ codelists/v11/ (Payne et al., 2020) and https://clinicalcodes.rss.mhs.man.ac.uk/ (Springate et al., 2014), are not adopted since they are less comprehensive, unified and rigorous. A total of 276 distinct diseases and 16 broad condition categories are tested.
2.5 Removing confounding pairs
A self-controlled cohort study requires that initial exposure is not caused by indication. If prior diagnosis lead to subsequent treatment, bogus protective effect will appear because the first diagnosis often occurs before initial prescription. Previous studies can remove drug-indication combinations manually based on subject matter knowledge as they focus either on particular diseases (Kern et al., 2019; Cepeda et al., 2019; Teneralli et al., 2021; Kern et al., 2022) or on a specific class of drugs (Kern et al., 2021) with clear primary indication relationship. However, since we aim to screen available drugs on possible diseases, manual removal is laborious, time-consuming, and prone-to-error. Figure 2 demonstrates the medication-indication open loop starting from prodcode and ending by medcode. To the best of our knowledge, there is no existing drug-indication map available within the UK system, and thus we have to turn to the US system and leverage the may_treat relationship between rxcui and Medical Subject Headings (MeSH) according to RxClass API (2022). Therefore, we need to map prodcode towards rxcui and MeSH to medcode, respectively.

Drug indication map from prodcode to medcode. Solid boxes reveal specific coding system while dashed boxes contain sources of maps between adjacent coding systems along with R packages for extraction. If R package in a dashed box is missing, then the source of map are in machine-readable format.
The open loop starts from prodcode, the only local therapeutic coding system in CPRD which can be mapped towards British National Formulary (BNF) code and gemscript code. In order to connect the UK system to the US system, Systematized Nomenclature of Medicine (SNOMED), an international organized terminology, is selected as the bridge. As the map between gemscript codes and SNOMED drug codes are not actively managed (Gemscript drug code to SNOMED/DM+D code lookup, 2020), the UK national BNF code, currently administered by National Institute for Health and Care Excellence (NICE), is adopted instead. Prodcodes are then mapped to the first six digits of BNF codes at the ingredient level (Prescribing Data: BNF Codes, 2017). Though BNF codes can only be mapped to UK SNOMED drug codes, the “Has specific active ingredient” attributes further convert UK-only SNOMED drug codes to universal SNOMED ingredient codes, which can be used to match rxcui and rxcui ingredients.
Then we need to map MeSH code towards medcode. As MeSH is US-based while medcode is UK-based, SNOMED is again chosen as the international link. Since SNOMED clinical codes can’t be mapped with CPRD-local medcode directly, Readcode, a clinical terminology system that was widely used in UK general practice until 2018, comes into play. SNOMED clinical codes are mapped to Readcode v3 then to Readcode v2. Although Readcode v2 stopped updating in 2016, it is the only version that can be converted to CPRD-local medcode directly. As a result, the drug side, the clinical aspect, along with the rxcui-MeSH drug-indication map can be joined into a comprehensive medcode-prodcode drug-indication table.
After removing drug-disease pairs following the mapped deterministic rules, the remaining drug-disease pairs are still subject to unmappable confounding by indication. To automate the high-throughput screening procedure, we start by calling the ChatGPT API sequentially with the question “is [drug] used to treat [disease]? Just answer yes or no” for all the remaining pairs. This prompt limits the answer from ChatGPT to yes or no without explaining the reasoning of the association. If we modify the last sentence in the prompt to “Just answer yes or no or unknown”, then ChatGPT become quite conservative and tend to answer “unknown” but rarely answers “yes”. The art of prompt engineering has been explored by John (2023).
After pulling out confonding by indication pairs, the remaining duplets, however, are subject to confonding by risk factors of all indications of the drug of interest. Motivated by two-stage least squares, we adopt a two step procedure by taking the output from the first stage as part of input in the second stage. For candicate pairs with the potential for drug repurposing, we start by calling the ChatGPT API with the question: “which diseases are [drug] used to treat? Limit answer within eight words” and record the response as [indication.of.drug] besides the drug-disease pairs. We limit the length of the answers since ChatGPT tends to provide explanations which is irrelevant in the next stage. In the second stage, we identify confounding by risk factors of all indications of the drug of interest with the response from the first stage by asking the question: “is any disease in [indication.of.drug] a risk factor of [disease]? Just answer yes or no”. Eventually, we can discard all pairs subject to confonding by risk factors of all indications of the drug of interest and the remaining pairs are of our interest.
For pharmacovigilance purposes, the drug-disease pairs still suffer from natural confounding issues. The diseases can be a direct consequence of an indication of the drug, and we remove such pairs by asking ChatGPT “is [disease] caused by any indication of [drug] Just answer yes or no”. Though aging does not exacerbate time-varying confounding for drug repurposing in self-controlled cohort studies, it is an major source of bias for drug safety especially for those medications with long exposure. As people getting older after prescribing the drug, the probability of developing aging-related diseases increases regardless of the effect of the medication. Hence, for prescriptions that last longer than a year, we remove pairs with a yes to the question “is [disease] more common as people age? Just answer yes or no”.
2.6 Causal interpretation
To our knowledge, IRR in a self-controlled cohort study has not been couched in explicit counterfactual language, and we discuss causal interpretation of IRR and its additive equivalent, the incident rate difference (IRD) in this section. It can be shown that the interpretability of these quantities relies on untestable common trend assumption between factual rate before exposure and counterfactual rate after treatment initiation had the exposure been removed. This assumption becomes less likely to hold as exposure length increases, so we conduct sensitivity analysis to inspect how estimates are affected by possible violations of assumption in various extent.
Suppose there are a∗ (a = 0, 1, . . ., a∗) exposures of interest, j∗ (j = 1, 2, . . ., j∗) outcomes of interest, and na units who have ever been exposed to treatment a (i = 1, 2, . . ., na). Let Ai be the exposure and the time of the first exposure be time zero. Assume Tia,pre and Tia,post are control period before time 0 and exposed period after time 0 for treatment a, respectively. Let Yija,pre ∈ {0, 1} and Yija,post ∈ {0, 1} denote whether unit i experiences non-terminal event j within [−Tia,pre, 0] and [0, Tia,post]. Note that Yija,pre + Yija,post ∈ {0, 1} for all i, j, a since a patient can only encounter the event no more than once for each treatment. Define Y a as the counterfactual posttreatment event indicator for outcome j had subject i received treatment a. Note that the potential outcomes for the pre-exposure indicator are not defined since it will never be exposed.
We define the potential posttreatment incidence rate (IR) as
 Then, the causal incidence rate ratio (IRR) can be defined as
 and the causal incidence rate difference (IRD) as
 The following conditions are required to identify IRR or IRD.
Assumption 1. Stable unit treatment value assumption (SUTVA): including no inter-ference between subjects after or before exposure  ,
,  ;
;
Assumption 2. Common intensity assumption:  . Had the exposure been removed, the population pretreatment intensity equals to the potential population post-exposure intensity;
Assumption 3. Positivity of population pre-exposed period E(Tia,pre) > 0, positivity of population post-exposed period E(Tia,post) > 0, and positivity of population pretreatment observed outcomes E(Yija,pre) > 0. Causal IRD does not require E(Yija,pre) > 0.
Assumptions 1 and 2 are crucial to identify IRR/IRD but they are both empirically unverifiable. Assumption 2 is similar to parallel trends assumption in difference-in-differences (Abadie, 2005) and rate-change assumptions in calibrated self-controlled cohort study (van Aalst et al., 2021). Note that this assumption is required for self-controlled cohort studies but exchangeability is not needed since its external control group is absent.
Assumption 3 is ensured automatically since the study is designed to be self-controlled. In addition to these requirements, all subjects are assumed to be observable from unexposure starts until exposure ends. Identification issues pertaining to administrative censoring, terminal events such as death, recurrent event, intermittent exposure, and lagtime are beyond the scope of this work (In’T Veld et al., 2001; Power et al., 2015).
Under Assumptions 1, 2, and 3, the causal IRR can be identified and estimated as
 and causal IRD can be identified and estimated as
 Suppose the IRR is a ratio between two rates with Poisson distribution, then the closedform confidence interval can be computed following Graham et al. (2003) as
 where zα/2 is the z-statistic with type I error rate α/2. The closed-form large sample z-test based confidence intervals for IRD between two Poisson rates can be found in Krishnamoorthy and Thomson (2004).
The selection between IRR and IRD depends mainly on research tasks. IRR has the advantage of cancelling background scale such that comparison across treatment a and outcome j can be made directly. IRD focuses on the absolute scale of contrast whose intrinsic incidence rates may differ substantially across a and j such that broader comparisons become less meaningful.
The study results can be controversial in situations especially when Tia,post or Tia,pre is large since time-varying factors may affect the validity of IRR/IRD analyses with critical reliance on the untestable Assumption 2 common intensity. Here, we provide sensitivity analysis to examine how violations of various scale would affect estimates. For IRR, suppose that  , where biasIRR > 0 is the bias for IRR. Under this sensitivity model, the IRR can be expressed as
 Such that when
  becomes an unbiased estimator for IRRa; when
  serves as an upper bound for IRRa; whereas when biasIRR > 1,
  acts as an lower bound for IRRa.
For IRD, we can parameterize the violation as 
 , where biasIRD is the bias for IRD. Under this sensitivity model, the IRD can be expressed as
 When
When  becomes an unbiased estimator for IRDa; when biasIRD > 0,
  serves as an upper bound for IRDa; whereas when
  acts as an lower bound for IRDa.
As neither biasIRR nor biasIRD can be estimated from data, our sensitivity analysis can be conducted by testing a set of values. Note that the conditional counterfactual incidence rate can be defined as  , where X must be baseline time-invariant covariates, such that conditional counterfactual IRR/IRD, identification conditions, estimators, along with sensitivity analysis can be adapted and derived accordingly.
3 Application
A total of 6,613,198 patients, 3,444 medications, and 276 diseases were analyzed in this study. We also investigate various exposure lengths, age groups at initial prescription, drug classes, along with more general disease categories. The exposed period is designed to be the same as unexposed period at the patient level for symmetry and simplicity. Only drug-disease pairs satisfying the following conditions are included: (1) drug does not confound with disease through known pathways; (2) after pairing with a specific drug, the total number of outcomes should be more than 100; (3) the number of outcomes during both control and exposure period is larger than 30. The full lists of drug-disease pairs are available upon request.
If there is no association between the exposure and the outcome, the pretreatment incidence rate should be approximately identical to the posttreatment incidence rate such that the estimated IRR should not be significantly away from 1. An upper 95% confidence interval of IRR < 1 reveals potential protective effect while an lower 95% confidence interval of IRR > 1 indicates possible adverse reactions. A total of 16,901 drug-disease pairs are found with significant risk reduction and a total of 11,089 pairs revealed significant risk augmentation.
For repurposing candidates, we focus on dementia and present upper 95% confidence interval of IRR, the number of participants exposed to each drug, exposure period mean, and exposure period standard deviation by increasing upper 95% confidence interval of IRR in Table 3. Compared with results using IBM MarketScan data (Kern et al., 2019), we discover no overlap between two databases. Though results on other diseases are not tabulated explicitly, our results revealed no overlap with IBM MarketScan on bipolar affective disorder, mania, or depression (Teneralli et al., 2021), and post-traumatic stress disorder (PTSD) (Kern et al., 2022). The only common drug-disease pair among all previous finding is that propranolol hydrochloride might postpone the diagnosis but of Parkinson’s disease (Cepeda et al., 2019).
Candidates for repurposing. upper: upper 95% confidence interval of IRR; N exposed: number of participants; exposure mean: exposure period mean; exposure sd: exposure period standard deviation.
To the best of our knowledge, no self-controlled cohort study has been conducted to explore unknown adverse effects on various diseases. After removing malignancy outcomes, the lower 95% confidence interval of IRR, the number of participants exposed to each drug, exposure period mean, and exposure period standard deviation are presented partially by decreasing lower 95% confidence interval of IRR in table 4.
Candidates for pharmacovigilance. lower: lower 95% confidence interval of IRR; N exposed: number of participants; exposure mean: average exposure length; exposure sd: standard deviation of exposure length.
4 Discussion
This study established a general workflow to screen medications on clinical outcomes. We aim to provide accessible and economical hypothesis-generating tests with limited validity and rigor for the relationship between exposure and clinical outcomes Rothman et al. (2008, Chapter 6). As identifying candidates is the very first step to discover both new uses and unknown ADRs of existing medications, more stringent and expensive hypothesis-testing confirmatory studies such as observational studies or even RCTs with external control group are required to validate signals found in this investigation, which can inform current medical guidelines.
4.1 Strengths
There are several strengths of this work. The self-controlled cohort study is applicable to both drug repurposing and pharmacovigilance by allowing subjects to act as their own control such that all time-fixed covariates, whether observed or not, such as genetics, are automatically controlled for. Compared with other cohort studies, narrow confidence intervals induced by underestimated variability and erroneous findings provoked by multiple comparisons can be avoided by overshooting risk reduction and risk augmentation. Even though potential effects are likely to be missed, the lack of significant discoveries indicates estimated association is not substantial enough to be incorporated rather than absence of such relationship. Afterall, potential false positive (type 1 error) is not a big concern for hypothesis-screening studies since we are targeting candidates for further research instead of confirming absolute causal effects.
We defined causal IRR/IRD and outlined conditions for identification. The major provision that differentiates from exchangeability-based external control group is the common intensity assumption, which involves the relationship between counterfactual posttreatment occurrence had the exposure been removed and observed factual pre-exposure occurrence. Though this can barely hold in practice, the estimated IRR/IRD can still serve as upper bounds for causal IRR/IRD if the control/exposed period is long enough such that aging becomes a dominant factor which boosts post-treatment incidence. As drug screening requires population-level estimates, we confine our focus to Imbens approach (Imbens, 2003) which targets average treatment effects for sensitivity analysis rather than Rosenbaums approach (Rosenbaum, 2002, Chapter 3) which considers sharp null tests and p-values from randomization inference. A potential benefit of Imbens approach is that detailed subject matter knowledge for unmeasured time-varying confounders or their relationship with observed data is not required (Robins et al., 2000). Moreover, IRR/IRD conditioned on time-fixed covariates can be defined and identified readily by some modifications on the assumptions for unconditional IRR/IRD.
Exchangeability-based methods relying on external control group require positivity, SUTVA and conditional ignorability such that treatment and control groups become comparable (Hernán and Robins, 2020). Notably, self-controlled cohort studies are inspired by the argument that observational healthcare data sources seldomly meet these strong and unverifiable assumptions. Putting strong and unverifiable assumptions to handle confounding by conditioning on measured covariates aside, the control group must share the same indication with the treatment group to render sufficient common support due to intrinsic confounding by indication in observational healthcare data. Consistency in SUTVA worsens the selection of external control by demanding only one version of treatment/control, which narrows the comparator group to a set of very limited treatment regimes. The choice between external control and internal control depends heavily on the scientific question and when it comes to high-throughput drug screening, self-controlled studies revealed dramatic advantage over external controlled studies.
Exposure periods serve as a critical component to capture clinical events and to compute incidence rates in self-controlled cohort studies. Owing to inherent discrepancies, prescription lengths are not uniform across medication, patient, practice, and region and setting a fixed value for all prescriptions will lead to inaccurate exposure length, inducing biased IRR/IRD estimates. Therefore, more accurate exposure lengths are computed for each prescription by parsing clinical texts using common dosage information in CPRD. Time-varying confounding for exposure continuity, cessation, and switching can’t be adjusted for in self-controlled cohort studies which may cause additional bias in either direction. Moreover, as some prescriptions have some variability and resilience, sensitivity analysis may be conducted to demonstrate how analytical decisions could affect IRR/IRD in future studies.
Though the major drawback of self-controlled cohort study is its intrinsic confounding related to indications, contraindications, comorbidities, complications, and off-label uses, where temporal sequences are predetermined by existing clinical guidelines or natural connection between diseases. In such cases, medication-disease pairs should be disposed in that these directional effects are expected to show up. Due to medical ontology incompatibility between the UK and the US, only mappable drug-indication pairs can be removed and without the power of modern LLMs, additional manual removal is required based on medical domain knowledge from physicians. The application of ChatGPT not only handles unmappable confounding by indication and other types of drug-disease relationships, but it also opens a door to generate nonexistent high-quality ontologies and extract clinical information from clinical texts, which will add value to the field of bioinformatics and pharmacoepidemiology (Shue et al., 2023).
The last major benefit of the study design would be computational efficiency, allowing researchers to perform large-scale screening on the entire database at relatively fast rate, which can be extended to other similar observational databases.
4.2 Limitations
Chronic diseases might not be well suited for self-controlled cohort analysis when the amount of time on medication after initial prescription is abridged. If this is true, the IR of diseases before and after treatment are expected to be similar as aging does not play an essential role when the exposure length is short. However, this is not the case for many drug-disease pairs found in the study. The main reason is that patients with shorter exposure time add less information to capture outcomes compared with those with relatively longer exposure. Medications with shorter exposure are therefore not a big issue to our study though those with longer exposure are likely to be more meaningful for incidence of chronic conditions. Aside from exposure period, the exact onset time of chronic diseases is hard to determine as symptoms start gradually and formal diagnosis may take place years after actual onset. Slow progression and delayed realization can result in temporal misclassification of chronic diseases and eventually, diagnoses are more likely to be captured after exposure even if the actual condition showed up before drug exposure. This bias leads to erroneously increased estimated risks which may reduce true negatives for repurposing intensions and enlarge false positives for drug safety concerns.
Diagnosis codes to phenotype clinical outcomes are based on established studies rather than subjective definition of conditions. To minimize the impact of under-recording in CPRD data, we do not require multiple diagnoses for the same condition to identify clinical outcomes. Therefore, false positive outcomes may appear due to single exclusion, misrecording, mis-diagnosis, and misclassification. If false positive cases are non-differential with respect to the treatment, then the results should lie around the null which can’t be explained by the directional effects found in the analysis. Moreover, only patients in the UK primary care database are evaluated. Medications not marketed in the UK can be assessed but our approach may require modification when applied to other countries, as treatment guidelines may differ outside the UK.
Another potential limitation of this study is the accuracy of the ChatGPT responses to the queries used to identify known drug-disease associations. Large Language Models (LLMs) like ChatGPT are known to occasionally produce confident but inaccurate responses, a phenomenon often referred to as “hallucination.” This inherent limitation of LLMs could potentially introduce false positives or negatives in the identification of drug-disease associations, thereby affecting the overall reliability of the pharmacovigilance analysis. While LLMs have demonstrated impressive capabilities in processing and synthesizing vast amounts of biomedical literature, their outputs should be treated with caution and verified against established databases and expert knowledge. Future work in this area should consider implementing additional validation steps, such as crossreferencing ChatGPT’s outputs with curated biomedical databases, or developing ensemble approaches that combine LLM-generated insights with traditional bioinformatics methods to mitigate the risk of hallucinated associations and enhance the robustness of the pharmacovigilance findings.
5 Conclusion
There are large unmet medical needs to discover effective disease-modifying therapies and unknown side-effects of existing drugs. The increasing volume and availability of observational healthcare databases provides the basis for detecting unknown benefits and detriments in-silico via large-scale drug screening. We therefore compared current pharmacoepidemiology study design and choose self-controlled cohort study to assess the association between initiation of marketed drugs and the onset of possible diseases in millions of patients using real-world UK primary care EHR data CPRD. Accurate exposure period is calculated by construing unstructured texts. Due to built-in selection bias of self-controlled cohort study, intended drug-disease pairs are discarded based on crossontology maps and answers from the recent LLM - ChatGPT. We also offer causal-wise interpretation of incidence rate contrasts along with Imbens-type sensitivity analysis on the critical common intensity assumption. By screening signals in both directions, this approach identifies 16,901 drug-disease pairs with reduced risk as potential candidates for repurposing and 11,089 pairs with excess risk as possible unknown ADRs. The results of this large-scale analytics can be followed up with more rigorous attention and help generate hypotheses for subsequent observational, preclinical, and clinical research, which examines the validity and efficacy of our paradigm. The general workflow of this work unlocks the potential of AIGC on bioinformatics and pharmacoepidemiology, and can be generalized easily to other observational healthcare databases.
Data Availability
All data produced in the present study require approval from Independent Scientific Advisory Committee (ISAC).
Acknowledgement
This work was supported by IBM Research with award number W1771646 and National Institutes of Health with award number R01AG058063-04. The authors thank Prof. Zach Shahn at the City University of New York, Dr. Bang Zheng and Dr. Bowen Su at Imperial College London for their discussion, explanations, and guidance. The authors are also grateful to the editors and the reviewers for their insightful suggestions.
References
- 1.↵
- 2.↵
- 3.
- 4.
- 5.
- 6.
- 7.
- 8.↵
- 9.
- 10.↵
- 11.
- 12.↵
- 13.
- 14.
- 15.
- 16.
- 17.↵
- 18.↵
- 19.
- 20.
- 21.
- 22.↵
- 23.↵
- 24.↵
- 25.
- 26.↵
- 27.↵
- 28.↵
- 29.↵
- 30.
- 31.
- 32.↵
- 33.↵
- 34.
- 35.
- 36.↵
- 37.↵
- 38.
- 39.↵
- 40.↵
- 41.↵
- 42.↵
- 43.↵
- 44.
- 45.
- 46.
- 47.↵
- 48.
- 49.
- 50.
- 51.↵
- 52.↵
- 53.↵
- 54.
- 55.
- 56.↵
- 57.
- 58.
- 59.
- 60.
- 61.↵
- 62.↵
- 63.
- 64.↵
- 65.
- 66.↵
- 67.↵
- 68.↵
- 69.↵
- 70.↵
- 71.↵
- 72.↵
- 73.
- 74.
- 75.↵
- 76.↵
- 77.
- 78.
- 79.↵
- 80.↵
- 81.↵
- 82.↵
- 83.↵
- 84.
- 85.↵
- 86.↵
- 87.↵
- 88.↵
- 89.
- 90.↵
- 91.↵
- 92.
- 93.
- 94.
- 95.
- 96.
- 97.↵
- 98.
- 99.
- 100.
- 101.↵
- 102.↵
- 103.↵
- 104.↵
- 105.
- 106.↵


