
Abstract
Two molecular phenotypes of the acute respiratory distress syndrome (ARDS) with substantially different clinical trajectories have been identified. Classification as “hyperinflammatory” or “hypoinflammatory” depends on plasma biomarker profiling. Differences in the biology underlying these phenotypes at the site of injury, the lung, are unknown. We analyze tracheal aspirate (TA) transcriptomes from 46 mechanically ventilated subjects to assess differences in lung inflammation and repair between ARDS phenotypes. We then integrate these results with metatranscriptomic sequencing, single-cell RNA sequencing, and plasma proteomics to identify distinct features of each ARDS phenotype. We also compare phenotype-specific differences in gene expression to experimental models of acute lung injury and use an in silico analysis to identify candidate treatments for each phenotype. We find that hyperinflammatory ARDS is associated with increased integrated stress response and interferon gamma signaling, distinct immune cell polarization, and differences in microbial community composition in TA. These findings demonstrate that each phenotype has distinct respiratory tract biology that may be relevant to developing effective therapies for ARDS.
Introduction
The acute respiratory distress syndrome (ARDS) is a clinical condition characterized by noncardiogenic pulmonary edema and hypoxemia within one week of a physiologic insult1. This broad clinical definition encompasses a heterogeneous population of critically ill patients, including those with direct pulmonary injury from pneumonia or aspiration and those with indirect pulmonary injury caused by dysregulated systemic inflammation from sepsis, pancreatitis, or trauma. The global incidence of ARDS has surged during the COVID-19 pandemic, increasing the importance of finding effective treatments. While some pharmacologic treatments have decreased mortality in mechanically ventilated patients with COVID-192,3, no drug has consistently reduced mortality in more typical heterogeneous cohorts of patients with ARDS. There is a growing recognition that biological heterogeneity within the syndrome is a significant barrier to identifying effective treatments4.
Two clinically distinct molecular phenotypes of ARDS (termed “hyperinflammatory” and “hypoinflammatory”) have been identified using latent class analysis of clinical and plasma biomarker data in five clinical trial cohorts and three observational studies1,5–11. The hyperinflammatory phenotype is characterized by elevated plasma inflammatory cytokines (IL-8, IL-6, TNFr-1), lower plasma Protein C and bicarbonate, and higher 90-day mortality compared to the hypoinflammatory phenotype. Differences between phenotypes are not primarily explained by the physiologic insult that caused ARDS (e.g. sepsis, pneumonia, aspiration of gastric contents). Importantly, significant differences in treatment response to simvastatin, ventilator settings, and fluid management have been observed across molecular phenotypes in retrospective analyses of three ARDS clinical trials5–7; further, in patients with COVID-19-related ARDS, hyperinflammatory patients may preferentially respond to corticosteroid treatment12,13. These results suggest that understanding and targeting the heterogeneous biology underlying ARDS molecular phenotypes is essential to identifying effective new treatments for ARDS. Prospective studies designed to identify these phenotypes using parsimonious models are laying the groundwork for precision clinical trials4,14.
Despite this exciting progress, a critical barrier to developing new therapies for ARDS is our superficial understanding of the biological pathways characterizing each phenotype. This knowledge gap was recently cited by an NHLBI workshop on precision medicine in ARDS as a top research priority for the field4. To date, analyses of the biological differences between these phenotypes have been limited to circulating biomarkers in plasma or blood, largely due to the relative ease of sampling. Understanding the biological differences between ARDS phenotypes in the lung will be critical to development of informative pre-clinical models of disease and targeted treatments for ARDS. Here, we employ a systems biology approach incorporating bulk and single-cell RNA-sequencing, metagenomics, and proteomics to understand differences in lung immunology, microbiology, and systemic inflammatory responses between ARDS phenotypes.
Results
Patient enrollment and ARDS phenotype assignment
To determine if previously identified ARDS phenotypes are associated with differences in pulmonary biology, we first studied tracheal aspirates (TA) collected from the Acute Lung Injury in Critical Illness study, a prospective, observational cohort of mechanically ventilated patients admitted to the ICU at the University of California San Francisco Medical Center (UCSFMC). Patients were enrolled in this cohort from July 2013 until March 2020, when enrollment was paused due to the COVID-19 pandemic. 77 out of 323 participants had ARDS in this cohort (Supplementary Figure 1). TA host sequencing was available for 41 of the ARDS participants. In addition, we had TA sequencing from five participants who were intubated for neurologic injury, had no evidence of pulmonary disease on chest x-ray (CXR), and were not immunosuppressed. We used a previously validated three-variable classifier model to determine ARDS molecular phenotype based on plasma IL-8, bicarbonate, and Protein C levels14. When plasma biomarkers were unavailable from the day of TA collection (n=5), we used a recently described and validated machine learning model to assign phenotype11,15. 10 out of 41 ARDS subjects (24%) had hyperinflammatory ARDS, which is consistent with the proportion of hyperinflammatory subjects observed in previous studies5–9. There were four extrapulmonary fungal infections (two C. albicans, one C. glabrata, and one H. capsulatum) in the hyperinflammatory phenotype vs. zero in the hypoinflammatory phenotype (p < 0.01, Table 1). There were no significant differences in patient age, sex, BMI, immunosuppression, or ARDS risk factors between the groups.
Characteristics of patients included in differential expression analysis of ARDS phenotypes from the Acute Lung Injury in Critical Illness cohort. Normally distributed values are reported as mean ± SD. Non-normally distributed values are reported as median [IQR]. Categorical data are reported as N (% of total for category). P-values are for a t-test for normally distributed continuous data, Wilcoxon rank-sum for non-normally distributed, and chi-square test for categorical data. P values are for (1) hyperinflammatory ARDS vs. hypoinflammatory ARDS; (2) hyperinflammatory ARDS vs. controls; (3) hypoinflammatory ARDS vs. controls. *No subjects in this cohort had a systemic viral infection or respiratory fungal infection.
TA RNASeq identifies increased pro-inflammatory cytokine signaling and increased stress response in hyperinflammatory ARDS
We sequenced TA using established methods16 and used DESeq217 and apeglm18 to compare TA gene expression between ARDS molecular phenotypes. 1,334 genes (7% of all protein-coding genes) were differentially expressed between ARDS phenotypes at a false detection rate (FDR) <0.1 and absolute empirical Bayesian posterior log2-fold change >0.5 (Supplementary Figure 2A, Supplementary Data 1A).
We next used Ingenuity Pathway Analysis (IPA)19 Upstream Regulator analysis to analyze differentially expressed genes. This analysis predicts whether measured gene expression is consistent with activation or inhibition of upstream regulators of gene expression, which include cytokines, receptors, transcription factors, enzymes, endogenous chemicals, and drugs. IPA predicted increased activation of several cytokines and other upstream regulators of differentially expressed genes in hyperinflammatory ARDS (Figure 1.A.i, Supplementary Data 2A). Predicted upstream regulators included several pro-inflammatory cytokines that were previously found to be elevated in plasma of patients with hyperinflammatory ARDS, including IL1B, IL6, and TNF. In addition, IPA identified activation of several cytokines that were not previously associated with hyperinflammatory ARDS, including several interferons; IL2 and IL15, which stimulate cytotoxic T cell and NK cell responses20; and the chemokine ligand CCL2/MCP-1. In addition, upstream regulator analysis predicted increased activation of the integrated stress response (XBP1, NFE2L2), T cell activation (CD3, CD28), stimulation of Toll-like receptors (TLR2, TLR3, TLR4, TLR7, TLR9), a metabolic shift to glycolysis (MLXILP), and increased cellular differentiation (MYC, NONO) in hyperinflammatory ARDS (Figure 1.A.ii-iv, Supplementary Data 2A). Because there was a significant difference in fungal infections between phenotypes, we performed a sensitivity analysis adjusting for systemic fungal infections. 997 genes were differentially expressed between phenotypes (711 genes overlapped with the unadjusted analysis), and pathway anlaysis identified similar upstream regulators of gene expression (Supplementary Figure 2, Supplementary Data 1B, Supplementary Data 2B). Together, these analyses identify several novel pathways that are differentially regulated between ARDS molecular phenotypes and support the hypothesis that previously described differences in systemic inflammation are associated with marked differences in respiratory tract biology

Bulk RNA sequencing analyses of TA collected in the Acute Lung Injury in Critical Illness cohort.
A-C) Differential gene expression and IPA upstream regulator scores in TA. A) 10 hyperinflammatory ARDS participants vs. 31 hypoinflammatory ARDS participants. B) 10 hyperinflammatory ARDS participants vs. five hypoinflammatory ARDS participants. C) 31 hypoinflammatory ARDS participants vs. five control participants.
For each comparison: (i) volcano plot of differential gene expression, where the log2 fold difference is on the x-axis and the −log10 adjusted p-value is on the y-axis; (ii-iv) IPA upstream regulator z-scores for (ii) cytokines, (iii) transmembrane and nuclear receptors, and (iv) transcription regulators in the IPA database. A maximum of 20 significant upstream regulators are shown for each panel. Redundant upstream regulators (e.g. inteferons or interleukins in the same family) were omitted from the figure. For a complete list of upstream regulator scores, see Supplementary Data 2.
D) Gene set variation analysis for experimental models of lung injury. We identified 21 models of acute lung injury in the Gene Expression Omnibus and used GEO2Enrichr to identify up to 200 genes differentially expressed (FDR < 0.05) in the experimental model compared to controls. GSVA scores were calculated for each sample, and the difference between hyperinflammatory ARDS and controls (orange) and hypoinflammatory ARDS and controls (blue) was estimated with limma. Experimental gene sets that are significantly different from controls are shown with solid triangles, while gene sets that are not significant are shown with transparent circles. For each model, the GEO Accession Number, organism, and lung injury model are listed on the x-axis.
E) IPA Upstream Regulator Analysis scores for selected drugs in the IPA database for (i) hyperinflammatory ARDS vs. controls, and (ii) hypoinflammatory ARDS vs. controls. A positive z-score indicates the drug is predicted to shift gene expression from ventilated lungs toward ARDS lungs, while a negative score indicates the drug is predicted to shift gene expression from ARDS towards controls. Upstream regulators that did not meet statistical significance criteria are displayed using a transparent dot.
To further understand how pathways in each phenotype were dysregulated compared to mechanically ventilated lungs, we next performed differential expression and pathway analyses comparing each phenotype to five mechanically ventilated control samples (Figure 1B and 1C, Supplementary Data 1C and 1D). 2,989 genes (15% of protein-coding genes) were differentially expressed between hyperinflammatory ARDS participants and controls, while 2,132 genes (11% of all protein-coding genes) were differentially expressed between hypoinflammatory ARDS and controls. Notably, this analysis identified several cytokines that were activated in both hyperinflammatory ARDS and hypoinflammatory ARDS compared to controls, including IL1B, TNF, and IFNG. While this analysis identified some similarities between phenotypes, we also identified several upstream regulators that were only significantly upregulated in hyperinflammatory ARDS (Supplementary Data 2C and 2D), including IL-17C, a member of the IL-17 family secreted by airway epithelial cells21; several Type I/Type III interferons; FAS, which stimulates apoptosis22; TICAM/MyD88 signaling, which are downstream effectors of Toll-like receptors23,24; and the T-cell receptor, suggesting these pathways play a role in the distinct biology of hyperinflammatory ARDS.
LPS models of acute lung injury replicate gene expression in hyperinflammatory ARDS
Upstream regulator analysis identified LPS, a component of Gram-negative bacteria, as a candidate upstream regulator of genes differentially expressed between ARDS phenotypes (Supplementary Data 2A). LPS was also identified as an upstream regulator of gene expression in comparisons of each ARDS phenotype to controls (Supplementary Data 2B, Supplementary Data 2C). LPS is a potent stimulator of NF-kB signaling via TLR4 and MyD8825 and is frequently used in experimental models of acute lung injury (ALI)26 thus, we hypothesized that genes upregulated in experimental models of lung injury would be enriched in genes that were upregulated in hyperinflammatory ARDS compared to controls but would be relatively less enriched in genes upregulated in hypoinflammatory ARDS compared to controls. Respiratory tract gene expression data was available from four LPS models of ARDS in the Gene Expression Omnibus. We also identified 17 more datasets from other experimental models of ARDS including ventilator-induced lung injury (VILI), ozone, hyperoxia, Pam3Cys (a TLR2 agonist), and hemorrhagic shock (Supplementary Data 3A). We used GEO2Enrichr27 to identify gene sets that were differentially expressed in lung injury compared to controls in experimental models. We then used gsva to calculate a expression score for each of these gene sets in TA samples and used limma to compare expression of these gene sets in each ARDS phenotype to controls (Figure 1D, Supplementary Data 3B and 3C). Gene sets from four models were significantly enriched (FDR < 0.1) in TA from both ARDS phenotypes. As expected, LPS models had a significant overlap with both phenotypes, but LPS experimental gene sets had higher GSVA scores in hyperinflammatory participants. In addition, gene sets from five experimental models (two ozone models, two LPS models, and one VILI model) were enriched in hyperinflammatory ARDS, but were not enriched in hypoinflammatory ARDS, suggesting these models better replicate dysregulated gene expression observed in the hyperinflammatory phenotype.
Transcriptomes identify candidate drugs for hyperinflammatory ARDS
To identify candidate treatments for each ARDS phenotype, we next used IPA’s Upstream Regulator Analysis to identify drugs that were predicted to shift gene expression from each ARDS phenotype toward control subjects. This approach has been used to identify drugs that can be tested in experimental models and clinical systems, and we have previously used this approach to identify candidate treatments for COVID-19 ARDS.16,28 This in silico analysis identified several drugs predicted to shift gene expression in the hyperinflammatory phenotype toward ventilated controls (Figure 1.E.i, Supplementary Data 2B), while fewer drugs were predicted to shift gene expression in hypoinflammatory ARDS toward controls (Figure 1.E.ii, Supplementary Data 2C). Interestingly, our analysis also identified drugs predicted to shift gene expression from control mechanically ventilated patients toward ARDS phenotypes. For example, nitrofurantoin, amiodarone, and cytarabine, all of which cause drug-induced pneumonitis, were predicted to shift gene expression from controls toward the hyperinflammatory phenotype (Figure 1.E.ii).
TA immune cells are distinctly polarized in hyperinflammatory ARDS
To identify the sources of differential gene expression identified in bulk RNA sequencing data, we used a neutrophil-preserving single-cell RNA sequencing (scSeq) pipeline to study TA from eight COVID-negative patients with ARDS enrolled in a separate prospective, observational cohort, the COVID-19 Multiphenotyping for Effective Therapies (COMET) study. TA scSeq was available from six participants with hypoinflammatory ARDS and two participants with hyperinflammatory ARDS. 18,717 cells passed quality control filters (3,782 from hyperinflammatory ARDS, Figure 2A). We determined cell identities using SingleR29 to compare cell transcriptomes to signatures derived from the Human Primary Cell Atlas (Figure 2B). Neutrophils were the most common cell type identified in TA from both phenotypes (48% of hyperinflammatory TA cells and 36% of hypoinflammatory TA cells, Figure 2C), which highlighted the importance of using neutrophil-preserving methods to study ARDS phenotypes.

Single-cell RNA sequencing from TA in the COMET cohort. A) Seurat UMAP projection of 18,717 TA cell transcriptomes from two participants with hyperinflammatory ARDS and six participants with hypoinflammatory ARDS, annotated with cell type as predicted by SingleR. B) UMAP projection of TA cells transcriptomes separated by ARDS phenotype. C) Bar plot of cell proportions in each phenotype.
D-G) Differential expression and pathway analyses for D) Neutrophils, E) Monocytes, F) Monocyte-derived macrophages, and G) T cells. For each cell type: (i) volcano plot of differential gene expression. A positive fold change indicates the gene is more highly expressed in hyperinflammatory ARDS. (ii) IPA upstream regulator scores for cytokines and (iii) IPA upstream regulator scores for the top 40 non-cytokine regulators of gene expression. A positive z-score indicates the cytokine is predicted to be more active in hyperinflammatory ARDS compared to hypoinflammatory ARDS.
To identify cell-specific differences between ARDS phenotypes, we used MAST to fit mixed effects models of differential gene expression (FDR < 0.1)30. To address pseudoreplication bias and account for within-subject correlation in gene expression31, we modeled ARDS phenotype as a fixed effect and each subject as a random effect. 231 genes were differentially expressed between phenotypes in TA neutrophils (Figure 2.D.i, Supplementary Data 4A). CCL2/MCP-1, which synergistically promotes neutrophil migration with IL-8 and is elevated in bronchoalveolar lavage (BAL) fluid from LPS-challenged volunteers and patients with ARDS32, was identified as an upstream regulator of neutrophil gene expression in hyperinflammatory ARDS (Figure 2.D.ii, Supplementary Data 5A). In addition, upstream regulator analysis predicted increased activaton of MYC, a key mediator of granulopoiesis33, and MLXIPL, which promotes glycolysis34, in hyperinflammatory neutrophils (Figure 2.D.iii, Supplementary Data 5A). Notably, increased glycolytic activity has previously been reported in LPS-stimulated neutrophils35. In contrast to our bulk RNASeq analysis, upstream regulator analysis predicted relatively higher activation of several proinflammatory cytokines, including TNF, IL6, and IFNG, in hypoinflammatory neutrophils.
Next, we investigated differences in monocytes and macrophages in ARDS phenotypes. 189 genes were differentially expressed between 690 hyperinflammatory monocytes and 3802 hypoinflammatory monocytes (Figure 2.E.i, Supplementary Data 4B) while 339 genes were differentially expressed in 296 monocyte-derived macrophages (MDM) from hyperinflammatory ARDS and 1,930 MDM from hypoinflammatory ARDS (Figure 2.F.i, Supplementary Data 4C). Only 15 genes were differentially expressed in alveolar macrophages (Supplementary Data 4D), which was insufficient for pathway analysis and suggested these cells played less of a role in differences between ARDS phenotypes. As in the neutrophils, IPA predicted relatively higher activation of several pro-inflammatory cytokines in hypoinflammatory ARDS, including TNF, IL1B, and IFNG, in monoctyes and MDM, while two canonical Type 2 cytokines, IL4 and IL13, were predicted to be activated in hyperinflammatory ARDS for both cell types (Figure 2.E.ii and 2.F.ii, Supplementary Data 5B and 5C). As in the bulk RNASeq data, we observed higher activation of NFE2L2, which protects against oxidative stress and inhibits the NLRP3 inflammasome37 in monoctyes and MDM from hyperinflammatory ARDS (Figure 2.E.iii and Figure 2.F.iii).
We next compared gene expression in T cells and found 281 genes that were differentially expressed between 477 T cells from hyperinflammatory ARDS and 1,665 T cells from hypoinflammatory ARDS (Figure 2.G.i, Supplementary Data 4E). IPA identified activation expression of interferon, TLR4, and NF-KB stimulated genes in T cells from the hyperinflammatory phenotype (Figure 2.G.ii, Supplementary Data 5D), which was consistent with the pattern observed in bulk RNA sequencing and suggested these T cells were Th1 polarized. IPA also predicted increased activation of cell differentiation markers (NONO) and activation of the integrated stress response (XBP1, EIF2AK2) in T cells from the hyperinflammatory phenotype (Figure 2.G.iii, Supplementary Data 5D).
We used connectome38, which compares single-cell gene expression to the FANTOM5 ligand-receptor database39, to identify ligand-receptor pairs in lower respiratory cells that were unique to each ARDS phenotype (Supplementary Data 6A and 6B). Several ligand-receptor pairs were observed in hyperinflammatory ARDS but were not present in hypoinflammatory ARDS (Supplementary Figure 3). For example, IFNG from T and NK cells and IFNGR2 on MDM were identified as a distinct ligand-receptor pair in hyperinflammatory ARDS, suggesting these cells play a key role in the dysregulated pathways identified in bulk and single-cell differential expression analyses. Together, our scSeq analyses confirm that TA immune cells have distinct transcriptomic profiles in each ARDS phenotype.
Plasma proteomic analysis identifies additional cytokines that are upregulated in hyperinflammatory ARDS
To further validate the biologic relevance of the TA findings, we used the O-Link Target 96 Inflammation panel to measure plasma protein biomarker concentrations. 21 participants included in the TA bulk sequencing analysis also had plasma O-link data available. In addition, proteomic data was available for four participants from the same cohort who did not have TA bulk sequencing available for analysis. Of the 25 included participants, five had hyperinflammatory ARDS and 20 had hypoinflammatory ARDS. We also measured plasma protein concentrations in 14 healthy volunteers on the same O-link plate.
Plasma concentrations of 28 proteins were higher in hyperinflammatory ARDS than in hypoinflammatory ARDS (FDR < 0.1, Figure 3A). Some of these biomarkers confirmed known differences between phenotypes, including higher concentrations of IL6 and TNF in hyperinflammatory ARDS. In addition, we identified nine plasma protein biomarkers notably higher in hyperinflammatory ARDS over controls (Figure 3B) but not higher in hypoinflammatory ARDS compared to controls (Figure 3C), suggesting they identify distinctly dysregulated pathways in the hyperinflammatory phenotype. These proteins included IL-8, which is one of the cytokines that defines the hyperinflammatory phenotype; CASP-8, an effector of FAS signaling40; the interferon gamma (IFNγ) induced proteins CXCL9 and CXCL1041; plasma urokinase (uPA); oncostatin M; and adenosine deaminase (ADA). In addition, CCL2/MCP-1 and the T cell activation marker CD542 were higher in hyperinflammatory ARDS and in controls compared to hypoinflammatory ARDS. These observations were consistent with observed differences in TA gene expression at both the bulk RNASeq and scSeq level, particularly increased CCL2 and FAS activity, IFNγ-stimulated gene expression, and T cell activation in hyperinflammatory ARDS.

O-Link proteomics results for plasma biomarkers from 5 hyperinflammatory ARDS, 20 hypoinflammatory ARDS, and 14 control participants. Each heatmap shows plasma protein biomarkers that were significantly different between groups (FDR < 0.1); for a complete list of proteins, see Supplementary Data 7. Each column represents an individual subject and each row shows the z-scaled concentrations. Rows and columns are clustered using the Euclidean distance. Columns are annotated by phenotype (orange is hyperinflammatory, blue is hypoinflammatory, and green is healthy volunteer). Z-score for expression is shown on the color bar on the right, and the scale is the same across all three heatmaps. A) Hyperinflammatory ARDS vs. hypoinflammatory ARDS. B) Hyperinflammatory ARDS vs. healthy volunteers. C) Hypoinflammatory ARDS vs. healthy volunteers.
Phenotypes were associated with differences in the respiratory microbiome
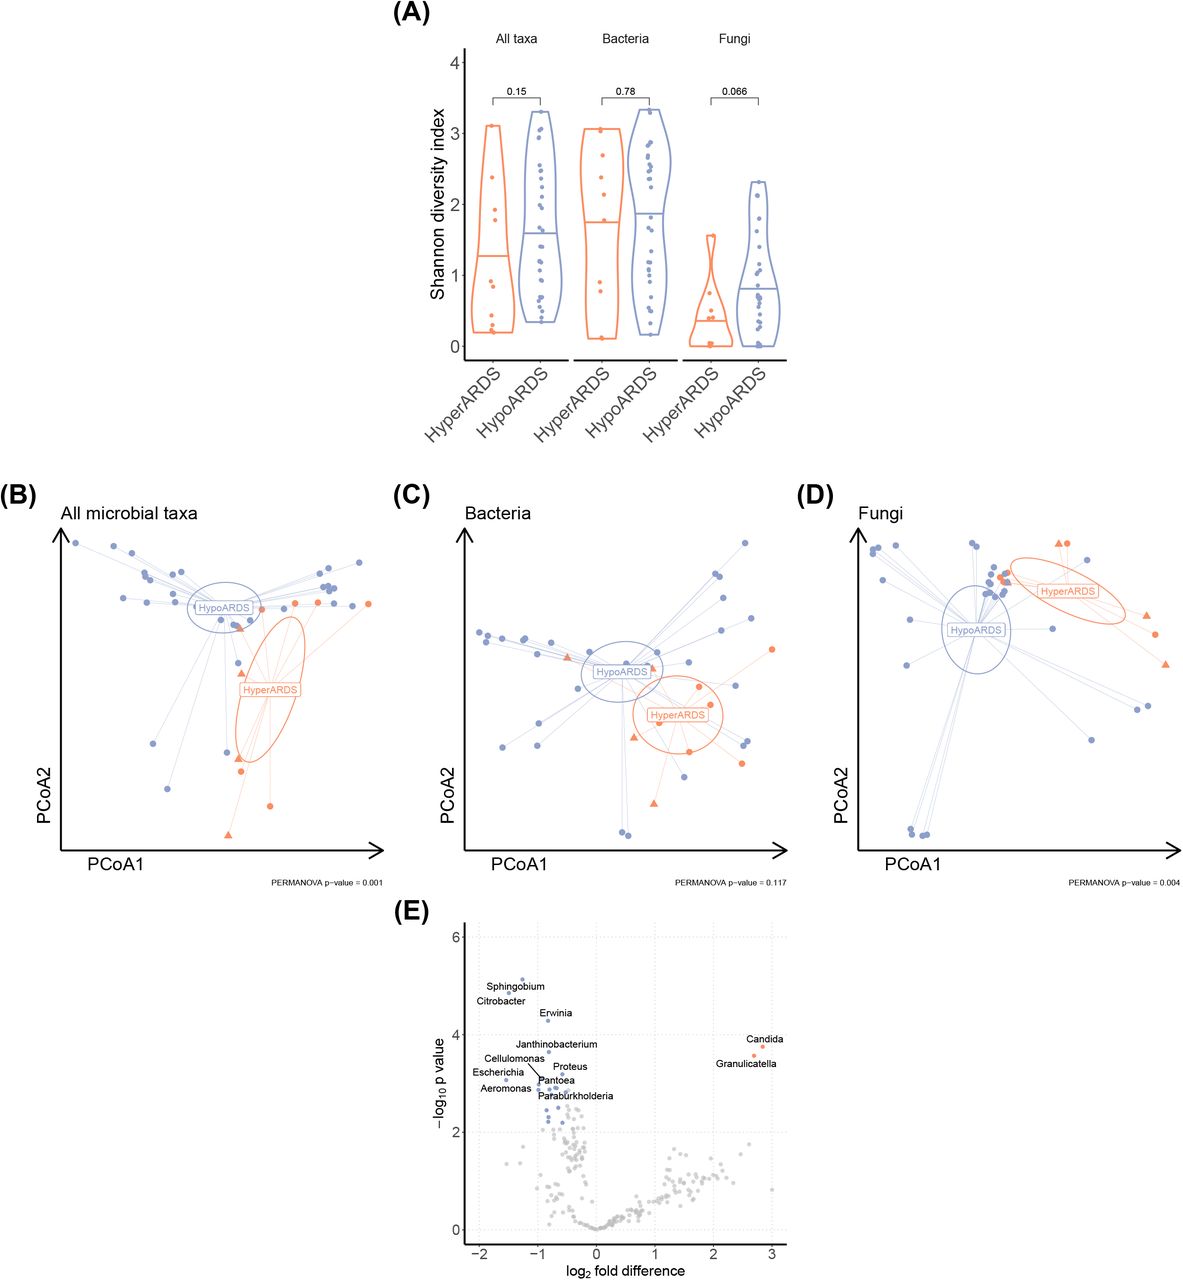
Because our analyses demonstrated significant differences in host respiratory tract biology in each phenotype, we hypothesized that each phenotype would have a distinct respiratory microbiome that could stimulate a dysregulated response. We used a previously described metagenomic sequencing pipeline to align non-human sequences in TA sequencing to microbial genomes43 and used established methods to filter background contamination from samples44. Taxa were aggregated at the genus level for downstream analyses. There was no significant difference in alpha diversity between phenotypes for all microbial taxa, bacteria, or fungi (Figure 4A). There was a significant difference in microbial community composition between phenotypes (Bray-Curtis distance, PERMANOVA p = 0.001, Figure 4B). This difference was not significant when the analysis was restricted to bacterial taxa (p = 0.117, Figure 4C), but was significant when the analysis was restricted to fungal taxa (p = 0.004, Figure 4D). We next compared differential abundance of microbial transcripts using metagenomeSeq45. We found increased abundance of Candida in TA from patients with hyperinflammatory ARDS (Figure 4E). In addition, we observed greater abundance of multiple bacterial taxa in the hypoinflammatory phenotype, including Escherichia, Proteus, and Citrobacter, three taxa in the Enterobactericeae family, which was associated with an increased risk of ARDS in a cohort of trauma patients46. Together, these observations support the hypothesis that there is a significant difference in microbial community composition between ARDS phenotypes.

Results of metatranscriptomic sequencing analyses of TA from 31 subjects with hypoinflammatory ARDS and 10 subjects with hyperinflammatory ARDS from the Acute Lung Injury in Critical Illness cohort. All analyses are performed with metatranscriptomic data aggregated at the genus level. A) Shannon diversity index for each TA sample, shown for all taxa, bacteria, and fungi. Each point represents an individual participant. P-value for Wilcoxon rank-sum test. B-D) Principal components analysis of metatranscriptomic reads mapped to all taxa, bacteria, or fungi in TA. Each point represents an individual subject. Subjects with systemic fungal infections are identified with triangles. Ellipses show the 95% confidence interval around the centroid. PERMANOVA for Bray-Curtis dissimilarity was calculated using adonis2 in vegan. D) Volcano plot showing differential abundance for TA metatranscriptomes. Genera that are significantly higher in hyperinflammatory ARDS are in orange and genera that are significantly higher in hypoinflammatory ARDS are in blue.
Discussion
In this study, we performed an integrated transcriptomic and proteomic analysis of ARDS phenotypes. To our knowledge, this represents the first demonstration of differences in pulmonary biology between molecular phenotypes of ARDS, which have previously been characterized primarily using plasma biomarkers. We identified differences between phenotypes in bulk RNA transcriptomes and used scSeq to identify distinctly polarized immune cells in the TA. In addition, O-Link proteomics identified differences in plasma protein concentrations consistent with these observations. We also found significant differences in the TA microbial community composition between phenotypes. Our findings support the hypothesis that each ARDS phenotype has distinct pulmonary pathobiology and may be more likely to respond to treatments specifically targeting these dysregulated pathways.
Here, we find hyperinflammatory ARDS was associated with markedly higher IFNγ stimulated gene expression and T cell activation in TA. In bulk RNA sequencing, pathway analysis identified markedly higher expression of IFNγ stimulated genes and increased expression of genes stimulated by the T cell receptor. Plasma proteomics identified increased concentrations of the IFNγ-stimulated proteins CXCL9 and CXCL10 and the T cell activation marker CD5 in hyperinflammatory ARDS but not in hypoinflammatory ARDS. Notably, in an alternative molecular phenotyping approach that used k-means clustering of plasma biomarkers to categorize ARDS subjects into two molecular phenotypes (“reactive” and “uninflamed”), plasma IFNγ is one of the defining biomarkers of the higher mortality “reactive” phenotype47. Together, our analyses support a central role of IFNγ and T cell activation in hyperinflammatory ARDS.
We used scSeq to identify cell-specific differences in immune responses. We found evidence of increased neutrophil migration and differentiation in hyperinflammatory ARDS. MDM from the higher-mortality hyperinflammatory phenotype expressed fewer pro-inflammatory genes, which is consistent with a prior analysis showing decreased pro-inflammatory gene expression in BAL macrophages collected on the day of intubation was associated with increased mortality in a cohort of ARDS patients48. In contrast, T cells demonstrated higher interferon-stimulated gene expression in hyperinflammatory ARDS. Interestingly, this pattern of high interferon-stimulated gene expression in T cells but diminished immune responses in macrophages has also been reported in severe COVID-1949. These findings suggest dysregulated responses to immune signaling in specific cell populations may drive inflammation in hyperinflammatory ARDS.
The interplay of the respiratory microbiome, lung injury, and ARDS has long been hypothesized but remains an important knowledge gap in the field. In one experimental study, changes in the respiratory microbiome mediated lung injury50, however, a small prior study using 16S sequencing of mini-BAL specimens found no difference in the microbiome composition between phenotypes51. Because we used metatransciptomic sequencing, we were able to identify non-bacterial taxa present in TA samples. We identified significant differences in microbial community composition between phenotypes and more transcripts from Candida in hyperinflammatory ARDS. Decreased fungal diversity in the respiratory tract has previously been associated with increased organ dysfunction and shock in patients with ARDS52, and an increased burden of BAL Candida is associated with worse outcomes in ventilated patients with COVID53. Prior studies have also shown an association between Enterobacteriaceae and a risk of developing ARDS46,54; in our analysis, three genera in Enterobacteriaceae (Escherichia, Proteus, and Citrobacter) were more abundant in hypoinflammatory ARDS than hyperinflammatory ARDS. While Candida can stimulate the dysregulated pathways observed in hyperinflammatory ARDS55, further research is required to determine if the respiratory microbiome causes (or, alternatively, results from) inflammation in hyperinflammatory ARDS, and, if the association is causal, which taxa are responsible for lung injury.
We compared differentially expressed genes in clinical samples to experimental ALI models. A prior analysis comparing rodent ALI models to human LPS challenge models found a significant overlap in gene expression between animal and human experimental systems56. An experimental model combining intratracheal LPS and mechanical ventilation was the murine model with the strongest overlap in gene expression with ARDS subjects in both phenotypes. This gene signature was from an experiment demonstrating that a combined MV/LPS model generated markedly higher neutrophilic inflammation in the lung than LPS or MV alone57. These observations suggest a two-hit model reproduces important biological changes observed in ARDS. In addition, gene signatures from five models were enriched in hyperinflammatory ARDS but were not enriched in hypoinflammatory ARDS, suggesting these models did not replicate respiratory tract biology of the latter group. These observations may partially explain why therapies that appear promising in pre-clinical models are not effective in more heterogeneous clinical trial populations.
Our results provide further evidence that ARDS molecular phenotypes identify biologically-important differences in immune biology, and have several important implications for developing a precision approach to treating ARDS4. Pathway analyses identified different drugs that were predicted to shift gene expression from ARDS toward ventilated controls in each phenotype. These candidate therapies require further investigation in pre-clinical models, and our results also demonstrate that some experimental models are more effective at reproducing changes in gene expression observed in clinical samples in each phenotype. Future preclinical studies and RCTs must account for this biological heterogeneity.
Strengths of this study include transcriptomic analysis of samples from the focal organ of injury in ARDS, providing a highly detailed picture of the pulmonary biology of both ARDS phenotypes, and validation of these observations with metatranscriptomics, single-cell sequencing, and peripheral blood proteomics. In addition, the inclusion of non-ARDS ventilated controls allowed us to further characterize the physiologic dysregulation in the phenotypes, rather than defining gene expression relative to another pathologic state. This approach also allowed us to compare our clinical samples to experimental models and identify candidate medications that may be suitable for clinical trials in each phenotype.
This analysis also has some limitations. The sample size for each analysis is modest; however, it was adequately powered to detect large changes in gene expression and protein concentrations. We performed CD45+ selection for scSeq samples, which allowed us to isolate hematopoietic immune cells, including neutrophils, but selected against epithelial cells, which generate important signals in our bulk RNASeq and plasma protein analyses and likely play a important role in ARDS phenotype biology. In addition, while TA contains fluid from the distal airspaces58, and we have previously shown that TA and BAL isolate similar immune cells16 and microbiota59, it is possible that more invasive BAL testing may identify additional differences between the phenotypes. Future analyses should include larger cohorts to replicate these findings and determine if TA sequencing or plasma cytokines more accurately predict clinical trajectory and response to treatment.
In conclusion, an integrated, multi-omic analysis of ARDS molecular phenotypes defined by plasma protein biomarkers suggests the hyperinflammatory phenotype is characterized by marked differences in TA gene expression, metagenomics, and plasma proteins. Our findings suggest the respiratory tract biology of these phenotypes is distinct and further supports the use of molecular phenotypes to study acute lung injury biology and develop new treatments for ARDS.
Data Availability
All data produced in the present study are available upon reasonable request to the authors
Captions
Supplementary data 1: Differential gene expression for pairwise comparisons of bulk RNA gene expression for TA in the Acute Lung Injury in Critical Illness cohort. A positive log2 fold difference indicates the gene is more highly expressed in the first group compared to second group for each comparison. A) Hyperinflammatory ARDS vs. hypoinflammatory ARDS; B) Hyperinflammatory ARDS vs. controls; and C) Hypoinflammatory ARDS vs. controls; and D) All ARDS subjects vs. controls.
Supplementary data 2: IPA Upstream Regulator scores for pairwise comparisons of bulk RNA gene expression for TA in the Acute Lung Injury in Critical Illness Cohort. A positive z-score indicates gene expression is consistent with higher activity of the upstream regulator in the first group compared to second group for each comparison. A) Hyperinflammatory ARDS vs. hypoinflammatory ARDS; B) Hyperinflammatory ARDS vs. controls; C) Hypoinflammatory ARDS vs. controls; and D) All ARDS vs. controls.
Supplementary data 3: A) 200 most upregulated genes in experimental models of lung injury compared to controls for 21 experimental systems in the Gene Expression Omnibus. B) Gene set enrichment analysis scores and leading edge genes for experimental model gene sets in TA differential expression for hyperinflammatory ARDS vs. controls. C) Gene set enrichment analysis scores and leading edge genes for experimental model gene sets in TA differential expression for hypoinflammatory ARDS vs. controls.
Supplementary data 4: Differential gene expression for single-cell RNA sequencing for TA for the COMET cohort. A positive log2 fold difference indicates the gene is more highly expressed in hyperinflammatory ARDS. A) Neutrophils, B) Monocytes, C) Monocyte-derived macrophages, D) Alveolar macrophages, E) T cells, F) Dendritic cells
Supplementary data 5: IPA Upstream Regulator scores for pairwise comparisons of bulk RNA gene expression for TA in the COMET. A positive z-score indicates gene expression is consistent with higher activity of the upstream regulator in the hyperinflammatory ARDS samples. A) Neutrophils, B) Monocytes, C) Monocyte-derived macrophages, D) T cells, and E) Dendritic cells
Supplementary Data 6: Connectome results for ligand-receptor pairs in TA single-cell RNA sequencing from the COMET cohort for A) hyperinflammatory ARDS and B) hypoinflammatory ARDS.
Supplementary Data 7: A) Z-scaled O-link protein concentrations for five hyperinflammatory ARDS, 20 hypoinflammatory ARDS, and 14 control subjects. B) Results of Wilcoxon rank-sum tests for pairwise comparisons of hyperinflammatory ARDS, hypoinflammatory ARDS, and control subjects.
Supplementary figure 1: Subjects included in this analysis.
Supplementary figure 2: Sensitivity analysis for differential gene expression between phenotypes after adjusting for fungal infections. (A) volcano plot of differential gene expression, where the log2 fold difference is on the x-axis and the −log10 adjusted p-value is on the y-axis. (B) Scatter plot showing estimated log2-fold difference in gene expression between phenotypes. The log2-fold difference in gene expression without adjusting for systemic fungal infections is on the x-axis, and the log2-fold difference in gene expression after adjusting is shown on the y-axis. (C-E) IPA upstream regulator z-scores for (C) cytokines, (D) transmembrane and nuclear receptors, and (E) transcription regulators in the IPA database. A maximum of 20 significant upstream regulators are shown for each panel. Redundant upstream regulators (e.g. inteferons or interleukins in the same family) were omitted from the figure. For a complete list of upstream regulator scores, see Supplementary Data 2B.
Supplementary figure 3: Circos plots showing ligand-receptor pairs that are only significant in hyperinflammatory ARDS.
Supplementary figure 4: Heatmaps for plasma proteins that are significantly higher in A) Controls vs. hyperinflammatory ARDS and B) Controls vs. hypoinflammatory ARDS
Methods
Patient selection
Subjects were selected from two prospective observational cohorts of critically ill patients. The first, the Acute Lung Injury in Critical Illness study, is a cohort of mechanically ventilated adults (age ≥ 18) admitted to the intensive care unit at the University of California, San Francisco Medical Center (UCSFMC) between from July 2013 until March 2020, when enrollment was paused due to the COVID-19 pandemic. The second, the COVID-19 Multiphenotyping for Effective Therapies (COMET) study, is a multi-omic study of hospitalized patients with COVID-19 and hospitalized controls admitted to UCSFMC or Zuckerberg San Francisco General Hospital (ZSFGH).
These studies were approved by the UCSF Institutional Review Board (17-24056, 20-30497), which granted an initial waiver of informed consent to collect TA and blood samples within 48 hours of ICU admission. Informed consent was then obtained from patients or surrogates, as previously described60.
In this analysis, we included all available subjects in each cohort who were: 1) admitted to the intensive care unit for mechanical ventilation for ARDS or airway protection without radiographic evidence of underlying pulmonary disease and 2) for whom we had TA sequencing with at least 500,000 protein-coding counts. We reviewed PCA plots, hierarchical clustering, and percentage of non-zero reads per samples for quality control and excluded four samples as technical outliers. For our non-ARDS control patients, we excluded control subjects on immunosuppression, including corticosteroids, and those with immunocompromising conditions (HIV, chemotherapy, etc.).
ARDS adjudication and phenotype assignment
Subject charts were reviewed for ARDS adjudication by at least two study authors (AS, PS, ES, FM, CL, ZL, KK, CH, MM, CC) blinded to all biological data. ARDS was diagnosed using the Berlin Definition61. Lower respiratory tract infections were diagnosed using the CDC surveillance definition62. ARDS phenotype was determined using a three-variable classifier model (IL-8, protein C, and bicarbonate) previously developed and validated for this purpose14. This classifier model assigns subjects a probability of assignment to the hyperinflammatory molecular phenotype identified using latent class analyses. Subjects with a probability of class assignment greater than 0.5 were assigned to the hyperinflammatory class. Plasma biomarkers were not available for five subjects with TA bulk RNA sequencing. For these subjects, we used a validated clinical classifier model to assign phenotype.11,15
RNA sequencing
Following enrollment, TA was collected and stored in RNAse free conditions as previously described60. Metagenomic next generation sequencing (mNGS) of RNA was performed on TA specimens using an established sequencing pipeline. Following RNA extraction (Zymo Pathogen Magbead Kit) and DNase treatment, human cytosolic and mitochondrial ribosomal RNA was depleted using FastSelect (Qiagen). To control for background contamination, we included negative controls (water and HeLa cell RNA) as well as positive controls (spike-in RNA standards from the External RNA Controls Consortium (ERCC)). RNA was then fragmented and underwent library preparation using the NEBNext Ultra II RNASeq Kit (New England Biolabs). Libraries underwent 146 nucleotide paired-end Illumina sequencing on an Illumina Novaseq 6000 instrument.
Host differential expression and pathway analysis
Following demultiplexing, sequencing reads were pseudo-aligned with kallisto (v. 0.46.1; including bias correction) to an index consisting of all transcripts associated with human protein coding genes (ENSEMBL v. 99), cytosolic and mitochondrial ribosomal RNA sequences, and the sequences of ERCC RNA standards. Gene-level counts were generated from the transcript-level abundance estimates using the R package tximport, with the scaledTPM method. Samples retained in the dataset had a total of at least 500,000 estimated counts associated with transcripts of protein coding genes, and the median across all samples was 7,528,890 counts.
We used an established bioinformatics pipeline to compare differential gene expression in TA from hyperinflammatory and hypoinflammatory ARDS. Differential expression analysis was performed using DESeq2. Gene expression was fit to a model using the design formula ∼Seqeuncing Batch + Gender + Z-scaled Age + Diagnosis. We performed pairwise comparisons of 1) hyperinflammatory ARDS to hypoinflammatory ARDS, 2) all ARDS subjects to mechanically ventilated controls, 3) hyperinflammatory ARDS to controls, and 4) hypoinflammatory ARDS to controls. Empirical Bayesian shrinkage estimators for log2-fold change were fit using apeglm. Differentially expressed genes with an independent-hypothesis weighted FDR < 0.1 and absolute shrunken log2FoldChange greater than 0.5.
Differentially expressed genes were analyzed using Ingenuity Pathway Analysis (IPA, Qiagen). We ran IPA Core Analyses for each pairwise comparison of differential gene expression. IPA compares differentially expressed genes to a database of gene signatures derived from experimental datasets. In addition to identifying signatures of canonical pathways and cellular function, IPA includes a database of upstream regulators of gene function. These include endogenous signaling molecules, such as cytokines, and exogenous stimuli, such as drugs or toxins. The dataset also includes annotations of the relationship between regulators, which can be used to construct mechanistic networks of regulators that may indirectly affect gene expression. For each of the signatures, IPA calculates a p-value for the overlap of DE genes with genes in the signature (using Fisher’s exact test) and a z-score that tests whether the measured direction of gene expression is consistent the direction in a gene signature. We defined significant pathways, regulators, and networks as those with a Benjamini-Hochberg false detection rate less than 0.1 or an absolute z-score greater than 2.
Single-cell RNA sequencing
TA were collected and stored at room temperature (to preserve neutrophils) and processed within three hours as previously described63. Briefly, TA cells were isolated and selected for expression of CD45, prepared with a V(D)J v1.1 kit according to the manufacturer’s protocol, processed on a 10x Genomics Chip A without multiplexing, and sequenced on an Illumina NovaSeq 6000 platform. Because samples had to be processed shortly after collection, batch processing and multiplexing were not feasible. Transcripts were aligned in Cell Ranger and filtered count matrices were imported into a Seurat object. Cells were filtered to have at least 300 counts, no more than 30,000 counts, and less than 10% mitochondrial genes. Cell types were determined using SingleR, and the Human Primary Cell Atlas was used as the annotation reference. Patients were assigned phenotypes on the basis of plasma IL-8, protein C, and bicarbonate concentrations. Differential gene expression for each cell type was determined using MAST, using a mixed effects model with fixed effects for phenotype and cellular detection rate and a random effect for subject. Differentially expressed genes were identified using Benjamini-Hochberg FDR < 0.1.
Plasma proteomic analysis
Plasma samples were analyzed using the O-link Proteomics Assay. This assay generates a semi-quantitative measure of plasma protein concentrations for 96 plasma biomarkers. We excluded all samples that were flagged with a QC warning from the O-link platform, and excluded any biomarker where protein concentrations could not be measured for at least 90% of samples. Measurements for 73 of the biomarkers on the panel passed the manufacturer’s quality control filter and were included for analysis. Normalized protein expression measurements were compared using a Wilcoxon rank-sum test and p-values were adjusted using the Benajmini-Hochberg method (FDR < 0.1).
Comparison of differentially expressed genes to experimental models of acute lung injury
We selected experimental models of acute lung injury in the Gene Expression Omnibus from a list of previously identified rodent and human models56. Lists of all genes differentially expressed at a Benjamini-Hochberg corrected p-value less than 0.05 were downloaded using GEO2Enrichr27. We then used the genes that were upregulated in the experimental lung injury model as gene signatures in GSVA. If more than 200 genes were differentially expressed in the experimental model, we used the top 200 genes (by p-value) for the experimental gene signature. A complete list of GEO accession numbers, experimental models, and genes used in each signature can be found in Supplemental Table 3A. We used limma to compare GSVA scores in samples from each phenotype to GSVA scores in controls.
Metagenomic sequencing
FASTQ files were analyzed using IDSeq43 to identify microbial reads in TA transcriptomes. Count matrices were downloaded for tracheal samples and water controls for analysis in RStudio. Taxonomic data were downloaded from NCBI using taxize64, and the matrix was filtered to only include viruses, bacteria, and fungi. We fit a negative binomial model of taxon-specific transcript counts against the total number of ERCC spike-in transcript reads in each of the water control samples. We then used this model to predict the background contamination of each taxon in each TA sample based on the number of ERCC reads. We then subtracted the predicted contamination from the measured reads in the sample to estimate the abundance in TA and rounded the estimate to the nearest integer. If the taxon-specific reads in a TA sample were not significantly different from predicted background contamination after adjusting for multiple comparisons using the Benjamini-Hochberg method, we estimated the abundance as zero. This background-corrected count matrix was used to construct a phyloseq65 object. Taxa were agglomerated at the genus level for downstream analysis.
We used estimate_richness to calculate the Shannon diversity index for all microbial taxa, as well as subgroup analyses of bacterial and fungal genera, in TA samples. We then used vegan66 to estimate the Bray-Curtis dissimilarity between samples and used adonis2 to calculate PERMANOVA p-values. We then used metagenomeSeq45 to estimate differential abundance between phenotypes using zero-inflated log-normal mixture models for each genus. Normalization factors were calculated using Wrench normalization and differential abundance was estimated using fitFeatureModel.
Footnotes
Funding: F32HL151117 (AS), R35HL140026 (CSC), 2R24AA019661-06A1 (CSC), NIH/NHLBI K23HL138461-01A1 (CRL), U19 AI1077439 (DJE, CSC), UCSF ImmunoX CoLabs, Chan Zuckerberg Foundation 2019-202665, Genentech TSK-020586
References


