
ABSTRACT
Importance Establishing a universal metric for nutrition security, defined as, “consistent and equitable access to healthy, safe, affordable foods essential to optimal health and well-being,” is a national priority. Understanding how the Healthy Eating Index-2020 (HEI-2020) could be used to measure and monitor nutrition security in the population can assist in surveillance and improve the design of nutrition programs and policies.
Objective To examine the utility of the HEI-2020 as an evidence-based measure of nutrition security.
Design This serial cross-sectional study used data from the 2009-2018 National Health and Nutrition Examination Surveys (NHANES).
Setting Nationally representative, population-based survey
Participants Data for N=22,168 US adults (≥20 years) were analyzed.
Main outcome We derived HEI-2020 scores (0-100), commonly used to capture overall diet quality, from participants’ two 24-hour dietary recalls. Nutrition security categories were established: high nutrition security (>70-100), marginal (>60-70), low (>50-60), and very low (0-50).
Results Only 13% of US adults had high nutrition security while nearly two-thirds had low or very low nutrition security. Nutrition security was higher for adults who were older, female, “Other” race or ethnicity, born outside of the US, have higher education attainment, higher income, and food security. Compared to adults with high nutrition security, adults with very low nutrition security had the lowest intakes of unprocessed or minimally processed foods, fruits, vegetables, whole grains, and seafood and the highest intakes of ultra-processed foods, refined grains, and red and processed meats (all P-trends <0.01). Similarly, adults with very low nutrition security were more likely to have elevated adiposity, lower HDL cholesterol, higher triglycerides, higher fasting glucose, and higher hemoglobin A1c (all P-trends ≤0.01).
Conclusions The HEI is a robust measure of nutrition security that can be directly linked to the construct of nutrition security. Using evidence-based HEI cut-points as nutrition security categories would allow policy makers, public health practitioners and nutrition professionals to set benchmarks and nationwide targets for achieving nutrition security.
KEY POINTS
Question Can the Healthy Eating Index (HEI)-2020 be used as an evidence-based measure of nutrition security?
Findings Using nationally representative data, we created four categories of nutrition security using HEI-2020 scores: high (≥70), marginal (>60-70, low (>50-60), and very low (≤50). Less than 1 in 6 US adults had high nutrition security. High nutrition security was less prevalent among adults with greater socioeconomic disadvantage. High nutrition security was also associated with more favorable cardiometabolic risk profiles.
Meaning The HEI can be directly linked to categories of nutrition security and used for national program and policy setting.
INTRODUCTION
Poor diet quality is a risk factor for chronic diseases including obesity, diabetes, cardiovascular disease, stroke, and some cancers.1–3 Sociodemographic factors, including lower educational attainment, lower household income, minority racial and ethnic identity, and experiencing food insecurity, have been associated with poor diet quality and higher chronic disease prevalence.4–12 Disparities due to these risk factors play a role in the inequitable burden of diet-related chronic diseases.
There is growing interest in the construct of nutrition security, defined by the US Department of Agriculture (USDA) as “consistent and equitable access to healthy, safe, affordable foods essential to optimal health and well-being.” Nutrition security was a core focus of the 2022 White House Conference on Hunger, Nutrition, and Health and is a current priority for programs administered by the USDA.13 However, there remains an ongoing debate on how nutrition security aligns with its complementary construct, food insecurity, an established risk factor for diet-related chronic diseases.14,15 While new questionnaires are being developed and validated to assess nutrition security in the US population, 16,17 it is unclear how these measures of nutrition security relate to food insecurity or overall diet quality.18,19
An alternative approach to measuring nutrition security is leveraging an established diet quality index for population-level surveillance. The US Healthy Eating Index (HEI) is informed by the US Dietary Guidelines for Americans (DGA) and is used to gauge how closely Americans’ diet aligns with its recommendations.20 However, population based analyses of HEI have typically presented score means, and evidence to support the utility of specific thresholds (e.g. high vs. low quality) of risk for nutrition-related disease and mortality is warranted.21–23
Using nationally representative data, we created four nutrition security categories of HEI-2020 scores: high (≥70), marginal (>60-70, low (>50-60), and very low (≤50) that were predictive of sociodemographic disadvantage and cardiometabolic disease risk. Establishing an objective, evidence-based definition of nutrition security using the HEI can generate timely and critical data for policymakers, public health practitioners, and nutrition professionals to tackle the systemic drivers of poor diet quality and can promote nutrition security and long-term health for all Americans.
METHODS
Study Design and Population
We conducted our analyses using data from the 2009-2018 National Health and Nutrition Examination Surveys (NHANES). NHANES is an ongoing multistage, nationally representative survey conducted by the National Center for Health Statistics (NCHS). In this study, the analytic sample included 22,168 adults ≥20 years with two valid 24-hour recalls.
Dietary Assessment and the HEI-2020 scoring
Dietary intake was assessed via two 24-hour dietary recalls administered by trained interviewers using the USDA Automated Multi-Pass Method. One 24-hour recall is collected in-person, and a second recall is completed by telephone 3-10 days later. Methods and validation studies for conducting 24-hour recalls have been previously published.24 Data from the two 24-hour recalls were converted into standard food groups and food pattern components using the Food Patterns Equivalents Database (FPED) to calculate individual HEI-2020 scores. Participants’
HEI-2020 scores were first calculated using the simple HEI scoring algorithm method and averaged across the two days of intake (i.e., observed HEI). We also used the National Cancer Institute (NCI) SAS Macros (version 2.1) in order to account for the within-person variability of dietary intake and to estimate predicted HEI scores (i.e., usual HEI).26
HEI cutpoints
The determination of the cut-points used to define categories of increasing nutrition security was informed on multiple criteria. First, we comprehensively reviewed prior findings from prospective observational studies that examined HEI scores in relation to major chronic disease outcomes (Supplemental Table 1).2 Most studies derived population-specific quintiles of HEI scores as the exposure, 27 and individuals in the highest HEI quintile consistently had lower risks of cardiovascular disease, cancer, type 2 diabetes, and all-cause mortality compared to individuals in the lowest quintile.2,28 Second, we examined the distributions of observed and usual HEI scores in NHANES to understand the extent to which US adults aligned with the cut points in the studies above (Supplemental Figure 1). Finally, we considered NCI’s suggested HEI cut-points and corresponding grade.29 Collectively, these evidence informed the following category definitions: high nutrition security (>70-100), marginal nutrition security (>60-70), low nutrition security (>50-60), and very low nutrition security (0-50). High nutrition security indicates a favorable adherence to the DGA and where the greatest risk reduction of morbidity and mortality from diet-related chronic diseases has been observed.2,30–32. In contrast, very low nutrition security indicates poor adherence to the DGA and is associated with the highest risks of morbidity and mortality from diet-related chronic diseases. Marginal and low nutrition security are intermediate risk levels.
Other Dietary Components
All dietary variables were derived from the average of two days of dietary recalls and standardized to 1,000 kcal. Other dietary factors in the current analysis included total energy intake (kcal/day). whole fruits (cup equivalents/day), vegetables excluding white potatoes (cup equivalents), refined grains (ounce equivalents/day), whole grains (ounce equivalents/day), red and processed meats (ounce equivalents/day), and seafood (ounce equivalents/day). Nutrients of interest included saturated fat (g/day), dietary fiber (g/day), sodium (mg/day), potassium (mg/day), calcium (mg/day), and added sugar (tsp equivalents/day). We also applied the Nova Classification to derive intakes of unprocessed and minimally processed foods and ultra-processed foods (% energy/day).33,34
Adiposity and cardiometabolic markers
Height, weight, and waist circumference (WC) were measured by trained personnel in the Mobile Examination Center.35 Body mass index was calculated as weight (kg) over height squared (m2). Obesity was defined as a BMI ≥30 kg/m2.36 High waist circumference was defined as >88 centimeters for women and >102 centimeters for men.37
Cardiometabolic biomarkers in this analysis include blood levels of high-density lipoprotein cholesterol (HDL-c; mg/dL), low-density lipoprotein cholesterol (LDL-c; mg/dL), triglycerides (mg/dL), and glucose (mg/dL). Low HDL cholesterol was defined as <40 mg/dL and elevated LDL cholesterol was defined as ≥100 mg/dL.38 Elevated triglycerides were defined as ≥150 mg/dL.39 Elevated fasting glucose was defined as >100 mg/dL.40
Sociodemographic Characteristics
Self-reported sociodemographic variables were ascertained at patient visits, including age, gender, race and ethnicity, place of birth, educational attainment, employment status, marital status, family income to poverty ratio. Household food security status was derived using the 18-item U.S. Food Security Survey Module.41
Statistical Analysis
Complex two-day dietary sampling weights were recalculated to reflect the 10-year analytic period and applied to all analyses to make nationally representative inferences. We first calculated the proportions US adults for each of our new HEI-based nutrition security categories cumulatively and separately for each NHANES 2-year cycle. We evaluated whether nutrition security categories differed over time and by sociodemographic characteristics using the Rao-Scott Chi-Square test. We generated radar plots to visualize the contribution of HEI-components across nutrition security categories, as a percentage of the maximum possible score for that component. For other individual dietary factors and cardiometabolic biomarkers, we estimated their least squared means across nutrition security categories using multivariable linear regression models adjusted for all sociodemographic characteristics. We estimate the predicted probabilities of the clinically significant cardiometabolic biomarkers in each nutrition security category with logistic regression models, adjusting for all sociodemographic characteristics. In sensitivity analyses, statistical tests were repeated using nutrition security categories derived from usual HEI scores. Statistical analyses were performed with SAS 9.4 (SAS Institute Inc., Cary, NC).
RESULTS
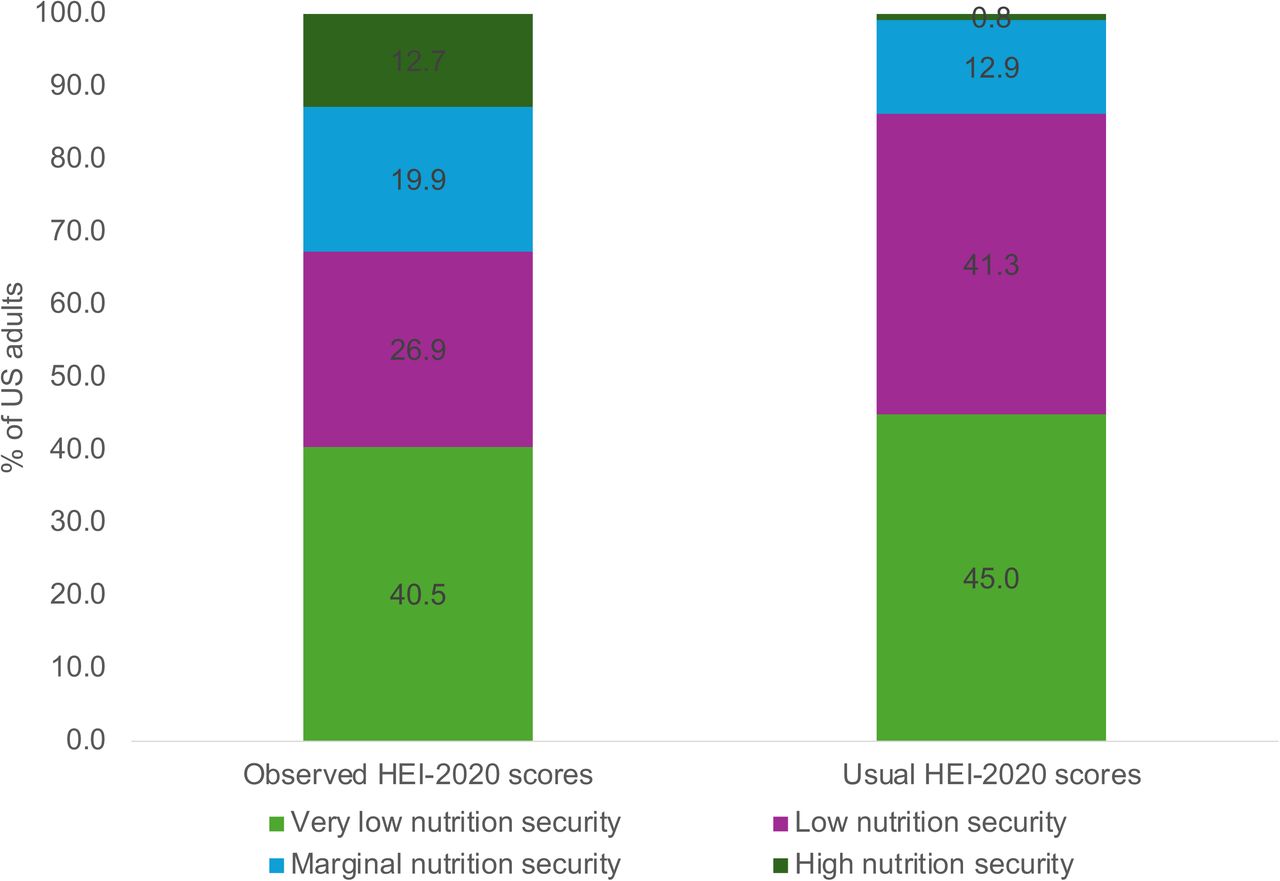
Between 2009 and 2018, 12.7% of US adults had high nutrition security (HEI ≥70), 19.9% had marginal nutrition security (HEI 60-<70), 26.9% had low nutrition security (HEI 50-<60), and 40.5% had very low nutrition security (HEI ≤50) (Figure 1). When usual dietary intakes were used, only 0.8% of US adults had high nutrition security, 12.9% had marginal nutrition security, 41.3% had low nutrition security, and 45.0% of adults had very low nutrition security. There were no significant differences over the 10-year NHANES cycles in the study period (Supplemental Figure 2, P>0.05)

There were statistically significant differences in nutrition security categories by all sociodemographic characteristics except employment status (Table 1, P-linear trend <0.01). Adults ≥51 years were more likely to have high nutrition security (16.1%) than adults ≤30 years (8.0%). Females were more likely to have high nutrition security than males (14.9% vs. 10.4%, respectively). By race and ethnicity, 8.0% of non-Hispanic Black adults had high nutrition security compared to 11.0% of Hispanic adults, 13.1% of non-Hispanic white adults, and 19.4% of adults in another racial or ethnic group (i.e., “Other”). Adults born outside of the US were more likely to have high nutrition security (19.2%) than adults born in the US (11.5%). Adults with some college education or more were more likely to have high nutrition security (15.5%) than those with a high school education or less (8.0%). Married or partnered adults (13.7%) were more likely to have high nutrition security than single adults (11.1%). Adults with household incomes >200% FPL were more likely to have high nutrition security (14.6%) than adults with household incomes ≤200% FPL (9.0%). Adults with high or marginal food security were more likely to have high nutrition security (13.9%) than adults with low or very low food security (6.3%).
A radar plot showing the proportion of the possible points for each HEI component for each nutrition security category is shown in Figure 2. Adults with high nutrition security scored at least half of possible points for all HEI components. Adults with very low nutrition security scored less than half of possible points for nine components. The greatest differences in HEI-2020 component scores between adults with high versus very low nutrition security were for whole grains (78.4%), whole fruit (72.5%), total fruit (70.9%), greens and beans (69.1%), seafood and plant protein (58.9%) and fatty acids (55.4%).

Multivariate-adjusted mean intakes of foods and nutrients of interest across nutrition security categories are shown in Table 2. Mean total energy intake was lowest among adults with high nutrition security (1976 kcal/day) and increased across nutrition security categories (marginal: 2031 kcal/day, low: 2102 kcal/day; and very low: 2106 kcal/day) (P-linear trend<0.01). Adults with high nutrition security had the highest intakes of unprocessed or minimally processed foods (41.4% energy) and adults with very low nutrition security had the lowest intakes (25.8% energy) – a difference of +15.6% (P-linear trend<0.01). Similarly, adults with high nutrition security had the lowest intakes of ultra-processed foods (42.5% energy) while adults with very low nutrition security had the highest intakes (61.7% energy)-a difference of -19.2% (P-linear trend<0.01).
Adults with high nutrition security consumed significantly more fruits, vegetables, whole grains, and seafood, and less refined grains and red and processed meats when compared to adults with marginal, low, and very low nutrition security (all P-linear trends<0.01) (Table 2).
Adults with high nutrition security also consumed lower amounts of saturated fat, sodium, and added sugars and higher amounts of dietary fiber, potassium, and calcium than adults with marginal, low, and very low nutrition security (all P-linear trends<0.01). Nearly all comparisons between the high nutrition security group with marginal, low, and very low nutrition security were statistically significant, except for seafood consumption between high and marginal nutrition security groups. Sensitivity analyses examining multivariate-adjusted means of usual intakes relative to usual HEI categories showed identical patterns (Supplemental Table 2).
There were differences in BMI and obesity prevalence across nutrition security categories (Table 3). After adjusting for sociodemographic factors, the mean BMI for adults with high nutrition security was lower (27.4 kg/m2) compared to adults with marginal (28.2 kg/m2 ), low (29.2 kg/m2), and very low nutrition security (29.8 kg/m2) (P-linear trend<0.01). Relatedly, 27.3% of adults with high nutrition security had obesity compared to 45.7% of adults with very low nutrition security – a difference of -18.4% (P-trend<0.01). Adults with high nutrition security had a mean waist circumference of 94.0 cm (49.3% with elevated waist circumference), compared to a mean waist circumference of 100.4 cm for adults with very low nutrition security (61.5% elevated waist circumference) (P-linear trends<0.01).
Cardiometabolic biomarkers predictive of diet-related disease also differed across nutrition security categories (Table 3). Mean HDL cholesterol was higher among adults with high nutrition security (56.6 mg/dL) and decreased across nutrition security categories (marginal: 54.1 mg/dL; low: 52.9 mg/dL; very low: 50.7 mg/dL) (P-trend<0.01). Clinically low HDL cholesterol was observed in 13.5% of adults with high nutrition security compared to 24.1% of adults with very low nutrition security – a difference of 10.6% (P-linear trend<0.01). Similarly, adults with high nutrition security had lower mean LDL cholesterol levels (107.8 mg/dL) compared to adults with marginal (111.9 mg/dL), low (111.6 mg/dL), and very low nutrition security (112.6 mg/dL) (P-linear trend=0.01). There was no difference in the proportion of adults with elevated LDL cholesterol by nutrition security category (P-linear trend=0.14). Adults with high nutrition security had a mean triglyceride level of 103.6 mg/dL and 18.6% had clinically elevated triglycerides; adults with very low nutrition security had a mean triglyceride level of 123.7 mg/dL and 25.7% had clinically elevated triglycerides (P-linear trends<0.01). Adults with high nutrition security had lower fasting glucose (101.7 mg/dL) compared to adults with very low nutrition security (mean fasting glucose 107.1 mg/dL) (P-linear trends<0.01). Approximately 43% of adults with high nutrition security had clinically elevated fasting glucose compared to 44.6% of adults with marginal, 48.6% with low, and 47.7% with very low nutrition security (P-linear trend=<0.01). In sensitivity analyses, multivariate-adjusted differences in adiposity and cardiometabolic biomarkers by usual HEI categories revealed consistent patterns (Supplemental Table 3)
DISCUSSION
In this nationally representative ten-year study, only 13% of adults had high nutrition security, and most (67%) had low or very low nutrition security. These proportions were more magnified when considering usual HEI scores. This indicates that few Americans consume a diet aligned with the Dietary Guidelines for Americans at levels that protect against diet-related chronic disease morbidity and mortality, with notable disparities across sociodemographic factors. There were also no observable improvements in the proportion of adults achieving high nutrition security over time.42
We noted disparities in nutrition security categories by key sociodemographic characteristics. Non-Hispanic Black race/ethnicity, having a high school education or less, low household income, and food insecurity were all significantly associated with higher prevalence of very low nutrition security. Although these are cross-sectional data, prior evidence indicates structural factors contribute to disparities in diet quality such as racism, limited educational opportunities, inequitable food access, a lack of proper training, resources, or enough time to prepare healthy meals.10,43–45
In this study, more healthful nutrition security categories were associated with a healthy weight status, lipid profile, and glycemic control in a dose-response manner. This is consistent with meta-analyses of prospective observational studies which found that individuals who score at the top quintile of diet quality for their population have lower risks of all-cause mortality, cardiovascular disease, cancer, and type 2 diabetes compared to individuals who score in the bottom quintile.2,32 This indicates that the proposed HEI cut-points reflect the underlying cardiometabolic risk profile of US adults.
Significant differences in all foods, food groups, and nutrients of interest were observed across nutrition security categories. Shifting to a higher nutrition security category can be achieved through incremental dietary improvements. For example, the difference between high and marginal nutrition security categories could be translated to a daily 6% kcal reduction from ultra-processed foods, 0.5 cups more fruits, 0.3 cups more vegetables, 0.8 oz equivalents more whole grains, and 0.3 oz equivalents more seafood. Similarly, the difference between marginal and low nutrition security categories was, on average, a daily 5.5% kcal reduction from ultra-processed foods, 0.4 cups more fruits, 0.1 cups more vegetables 0.4 oz equivalents more whole grains and 0.7 oz equivalents more seafood. Finally, the difference between low and very low nutrition security was on average an 8.7% reduction of energy/day from ultra-processed foods, 0.4 cups/day more fruit, 0.1 cups/day more vegetables, 0.5 oz equivalents/day more whole grains, and 0.3-ounce equivalents/day more seafood.
There have been calls to supplement food security surveillance measures with diet quality or nutrition security measures.14,15 USDA Secretary Tom Vilsack and leading members of Congress have called for making diet quality and nutrition security priorities alongside food security.46,47 This study shows that defining cut-points of HEI-2020 scores adequately and comprehensively captures underlying differences in key dietary and social risk factors implicated in diet-related diseases and could be used to efficiently assess nutrition security of the population. Nutrition interventions that work with individuals who have risk factors for very low diet quality often monitor food insecurity status of participants, and using evidence-based diet quality targets may enhance efforts to monitor and improve nutrition security. This can reduce disparities in diet-related chronic diseases by raising participants into higher nutrition security categories, in combination with other program evaluations and benchmarks.
Strengths of this study include our use of data from a large nationally representative sample of US adults spanning recent years. Second, we informed the cut points for HEI categories through multiple sources of health outcome evidence. Third, we leveraged the rich phenotyping available from NHANES questionnaire data, validated dietary recalls, physical measurements, and available biomarker data, to examine concurrent implications of the nutrition security categories at the individual level. However, this study is limited by its cross-sectional nature; prospective follow-up is needed to capture clinical outcomes. The 24-hour recall is a validated approach but is subject to measurement error and recall bias. Furthermore, we did not account for presence of chronic diseases or use of medications, as the goal was not to show causal effects of nutrition security categories and biomarker outcomes, but to characterize population-level differences across nutrition security categories.
Conclusion
Given that the HEI is already used to monitor the nutritional status of the US, using HEI cut-points to establish nutrition security categories would be an efficient, evidence-based, and practical approach allow policy makers, public health practitioners and nutrition professionals to set benchmarks and targets for nutrition policies and interventions. Disaggregating continuous HEI scores into meaningful categories can better identify disparities in diet-related health outcomes and help tailor existing nutrition programs and policies to improve healthful food access, increase diet quality, and promote health for all Americans.
Data Availability
All data produced in the present study are available upon reasonable request to the authors
Footnotes
Conflicts of interest: None
Financial disclosures: None
REFERENCES


