
Abstract
Vascular properties of the retina are not only indicative of ocular but also systemic cardio– and cerebrovascular health. Yet, the extent to which retinal vascular morphology reflects that in other organs is not well understood. We used morphological vascular phenotypes derived from the brain, the carotid artery, the aorta, and the retina from the UK Biobank, with sample sizes between 33,000 and 68,000 subjects per phenotype. We examined the cross-organ phenotypic and genetic correlations, as well as common associated genes and pathways. White matter hyperintensities positively correlated with carotid intima-media thickness and aortic cross-sectional areas but negatively correlated with aortic distensibility. Retinal vascular density showed negative correlations with white matter hyperintensities, intima-media thickness, and aortic areas, while positively correlating with aortic distensibility. Significant correlations were also observed between other retinal phenotypes and white matter hyperintensities, as well as with aortic phenotypes. Correcting for hypertension reduced the magnitude of these correlations, but the overall correlation structure largely persisted. Genetic correlations and gene enrichment analyses identified potential regulators of these phenotypes, with some shared genetic influence between retinal and non-retinal phenotypes. Our study sheds light on the complex interplay between vascular morphology across different organs, revealing both shared and distinct genetic underpinnings. This highlights the potential of retinal imaging as a non-invasive prognostic tool for systemic vascular health.
1 Introduction
The vascular system is a complex network of blood vessels, including arteries, veins, and capillaries, essential for circulating blood throughout the body. This system plays a crucial role in delivering oxygen and nutrients to various tissues, removing waste products, and maintaining overall health. Blood flows from the heart through arteries, arterioles, and capillaries, then returns through venules and veins. Smaller arterioles branch out from the arteries and lead to the capillaries. Venules and veins return blood to the heart, acting as volume reservoirs and maintaining a pressure gradient crucial for blood circulation.
Simple physiological measures such as arterial blood pressure and blood oxygen saturation provide valuable insights into the functionality of the vascular system. However, medical imaging offers more detailed information specific to different vascular structures. Angiography, for example, provides high-resolution images of blood vessels, detecting occlusions or poorly perfused regions, but is typically used only when disease risk is suspected due to its invasive nature [1]. Non-invasive techniques like non-contrast magnetic resonance angiography (MRA) offer lower spatial resolution but are suitable for studies involving healthy subjects. Despite their non-invasive nature, these imaging modalities remain expensive [2]. In contrast, imaging of the retina vasculature is an inexpensive, non-invasive routine examination that can provide valuable insights into systemic vascular health [3].
Various studies have explored the associations between altered vascular morphology and vascular problems across different parts of the body. Increased arterial stiffness and greater carotid intima-media thickness (IMT) are known to elevate the risk of future hypertension and cardiovascular diseases [4]. Higher carotid IMT also correlates with atherosclerosis [4]. Abdominal aortic aneurysms, intracranial aneurysms, and coronary artery ectasia or aneurysms share similar pathophysiological mechanisms involving vascular dilation and remodeling [5]. The presence of arterial aneurysms across different vascular territories suggests a common underlying vascular wall pathology [5]. Aortic dimensions and distensibilities are critical risk factors for aortic aneurysms, and other cardio– and cerebrovascular diseases [6]. Also, changes in the retinal vasculature have been linked to vascular issues in distant organs, including stroke [7–9], coronary heart disease [10, 11], or hypertension [12, 13], indicating systemic associations.
Despite ample evidence for systemic vascular disease associations with single-organ vasculature morphology, the relationship between similar vascular morphological properties across different organs remains poorly understood. While some studies have analyzed the phenotypic and genetic correlations between image-derived phenotypes (IDPs) from different organs like the heart, brain, retina, and liver [14–17], they have not focused on the morphology of the vasculature itself. This study aims to shed light on these associations using data from the UK Biobank (UKBB) [18, 19], which includes multiple vascular IDPs from the brain, carotid, heart [20–25], and retina [26, 27]. We investigate both phenotypic and genetic correlations among these IDPs, highlighting shared associated genes and pathways. Our approach reveals several relationships between vascular morphology across different organs, including the retina, emphasizing its potential as a prognostic proxy for non-retinal vascular diseases.
2 Results
The UKBB includes nearly 186,000 retinal color fundus images (CFIs) collected from approximately 90,000 subjects. We recently measured 17 different IDPs for 71,000 subjects whose CFIs passed quality control (QC) [27], utilizing some of these within this investigation. We searched for reliable non-retinal vascular IDPs available for a substantial number of subjects (at least 1,000) and identified the following IDPs: white matter hyperintensities (WMH) from T2-weighted brain magnetic resonance imaging (MRI), measurements of carotid IMT from ultrasound images, and assessments of the cross-sectional area and distensibility of the ascending and descending aorta from cardiac MRI. After filtering, these measurements were available for approximately 40,000, 49,000, and 36,000 subjects, respectively (see Figure 1).

Visualization of the human vascular system and the imaging modalities available in the UKBB. The modalities include CFIs for examining the retina’s vasculature, ultrasound for assessing the common carotid arteries (in particular, the IMT), transverse cardiac MRI for evaluating the aorta, and structural brain MRI for detecting WMH.
For the retinal IDPs, we selected tortuosity, vascular density, and vessel diameter, which are relatable to the non-retinal IDPs used. While retinal IDPs include both arteriolar and venular measurements, the non-retinal IDPs primarily focus on arterial characteristics (see Supplementary Data ‘IDPs information’ for details).
2.2 Phenotypic and genetic correlations between vascular IDPs
We first adjusted all vascular IDPs by regressing out common covariates, including sex, age, age-squared, assessment center, standing height, and the first 20 genetic principal components (PCs). We then computed pairwise correlations between the corrected IDPs. The left panel of Figure 2a shows the phenotypic correlations among vascular IDPs from the brain, carotid, and aorta. The total volume of WMH positively correlated with the carotid IMT and the aortic areas, but negatively correlated with the aortic distensibilities. IDPs related to aortic areas and distensibilities showed strong positive correlations between the ascending and descending aorta, respectively, but were negatively correlated with each other, and at most weakly correlated to the carotid IMT.

a) Phenotypic correlation of non-retinal IDPs with non-retinal IDPs (left) and retinal IDPs (right). b) Phenotypic correlation of non-retinal IDPs with non-retinal IDPs (left) and retinal IDPs (right) adjusted for hypertension in addition to the previous covariates. Hypertension was defined as having a systolic blood pressure (SBP) ≥ 140 mmHg or diastolic blood pressure (DBP) ≥ 90 mmHg. c) Genetic correlation of non-retinal IDPs with non-retinal IDPs (left) and retinal IDPs (right), computed using LDSR [30]. The diagonal of the left figure shows the heritability values of the non-retinal IDPs (values can be found in Supplementary Data ‘Heritabilities‘). GWAS summary statistics from previous studies were used to conduct this analysis (see section 4), for the brain IDPs, the GWAS sample size used was around ∼33,000 participants, for IMT around ∼44,000, for aortic IDPs ∈ (33,000-38,000), and retinal IDPs ∈ (54,000-69,000). For all the images, the x-axis shows non-retinal IDPs (left) and retinal IDPs (right) and the y-axis shows nonretinal IDPs. Colors indicate standardized effect sizes for linear regressions (a, b) or the genetic correlation coefficient (c), while asterisks indicate the level of statistical significance (except for the diagonal of figure c). These p-values were corrected for multiple testing (*: p < 0.05/Ntest, **: p < 0.001/Ntest, where Ntest(= 84) = NIDP s×(NIDP s/2+Nretina)). All IDPs were adjusted for covariates (see section 4). For more details, see Supplementary Data ‘Main IDPs information‘.
The right panel of Figure 2a displays correlations between these IDPs and selected retinal vascular IDPs. The strongest positive correlations were found between the distensibility of both the ascending and descending aorta and the arteriolar retinal vessel diameter measurements (both the median across all segments and the retinal equivalent, which is specific to the largest retinal blood vessels). In contrast, the aortic areas were negatively correlated with these retinal IDPs and, to a lesser extent, with retinal arteriolar vascular density. Notably, retinal arteriolar vascular density was the only retinal IDP significantly correlated with the carotid IMT. We also observed significant correlations between WMH and several retinal IDPs, with the strongest negative correlation seen with arteriolar median diameter and, somewhat weaker but still significant, with arteriolar retinal equivalent and vascular density. Additionally, arteriolar tortuosity was negatively correlated with the area of the descending aorta. For more details, see Supplementary Text “Main vascular IDPs selection”, and Supplementary Figure 3, which shows the number of subjects available for each IDP pair. Since blood pressure is a critical factor influencing vascular properties globally [28, 29], we recomputed the pairwise correlations after also adjusting for hypertension (see Figure 2b). This additional adjustment reduced the magnitude of inter-IDP correlations overall, but did not affect the sign of any sizable correlation. Despite this reduction, the retinal arteriolar vessel diameter measures remained significantly positively correlated with the aortic distensibility and negatively with the area of the ascending aorta. Similarly, the negative correlation between the area of the descending aorta and arteriolar tortuosity persisted. However, the small but highly significant correlation between carotid IMT and aortic IDPs became nonsignificant. For further details, see Supplementary Data ‘Phenotypic correlation‘.
We next computed cross-IDP genetic correlations and SNP-heritabilities (h2) using Linkage Disequilibrium Score Regression (LDSR) [30, 31], leveraging GWAS summary statistics from previous studies (see section 4). We observed significant genetic correlations exclusively between IDPs of the same organ (see left panel of Figure 2c, where h2 are displayed on the diagonal). Specifically, the cross-sectional areas of the ascending and descending aorta were positively and negatively correlated with their respective distensibilities. Correcting for multiple hypotheses testing, no significant genetic correlation was found between these IDPs and retinal vascular IDPs (see right panel of Figure 2c). For more details on summary statistics, refer to the methods section 4.4, and Supplementary Data ‘Main IDPs information‘, ‘Genetic correlation‘, ‘Heritabilities’ for the values.
2.2 Genes and pathways associated with vascular IDPs
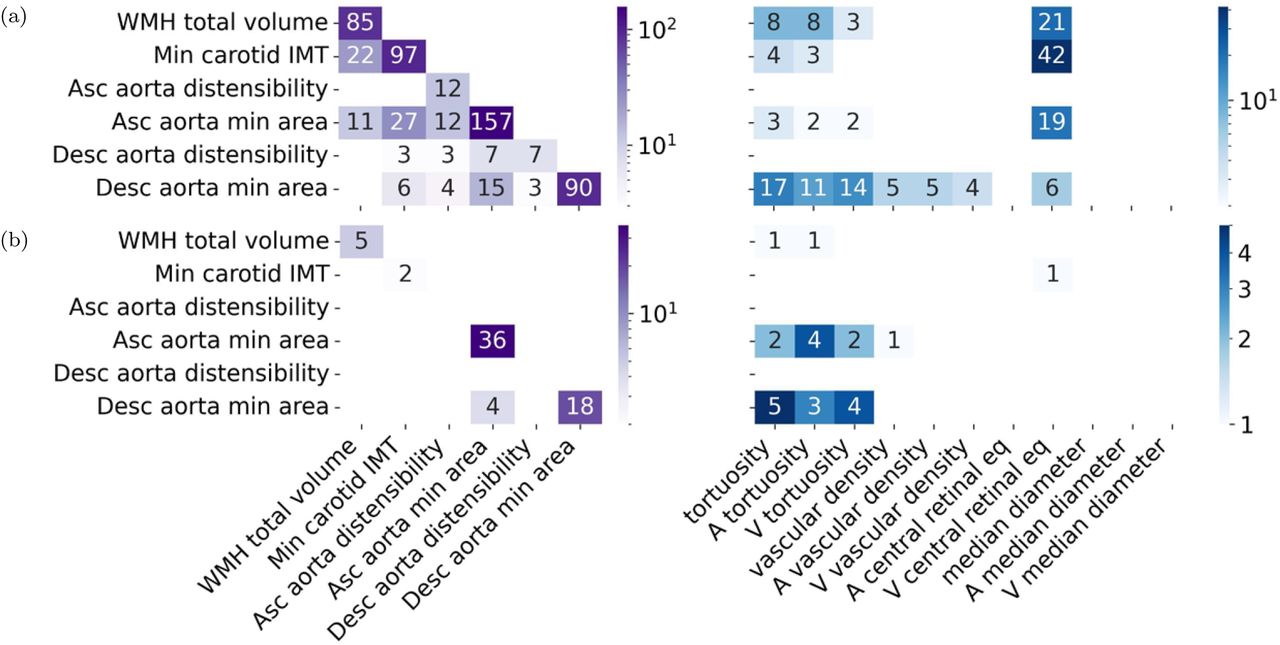
To identify genes associated with the IDPs, we used the PascalX analysis tool [32, 33]. The number of genes associated with non-retinal IDPs tended to be larger for IDPs with higher h2 (see Figure 3a, left, diagonal). The IDPs with the most associated genes were the area of the ascending aorta (h2 = 0.36, 157 genes) and the carotid IMT (h2 = 0.21, 97 genes). The descending aorta (h2 = 0.28, 90 genes) had fewer associated genes than its ascending counterpart. Distensibilities had much less associated genes, yet again more for the ascending (h2 = 0.09, 12 genes) than the descending aorta (h2 = 0.08, 7 genes). We also observed a large number of associated genes for WMH (h2 = 0.26, 85 genes). The off-diagonal elements show the number of common genes for each pair of non-retinal IDPs. No single gene was shared among all non-retinal IDPs. WMH shared 22 genes with IMT and 11 with the ascending aorta area. IMT shared 27 genes with the area of the ascending and 6 with the area of the descending aorta. Additionally, the respective genes associated with identical IDPs for the descending and ascending aorta displayed some overlap. The venular central retinal equivalent shared genes with WMH, IMT, and the areas of the ascending and descending aorta (Figure 3a, right), including genes like FBN1, CAPN12, EIF3K and SH2B3. Retinal vascular densities shared genes with the descending aorta area, while tortuosities shared genes with WMH, IMT, and the areas of the ascending and descending aorta, including genes like SMAD3, COL4A1, and COL4A2. For more details, see Supplementary Data ‘Shared genes‘, and ‘Heritabilities‘.

a) Gene-scoring intersection showing genes in common between non-retinal IDPs and non-retinal IDPs (left), and between non-retinal IDPs and retinal-IDPs (right). The diagonal (left) shows the number of genes significantly associated with each IDP. While the other cells show the number of intersected genes in IDP pairs. b) Pathway-scoring intersection showing pathways in common between non-retinal IDPs and non-retinal IDPs (left), and between non-retinal IDPs and retinal-IDPs (right). The diagonal (left) shows the number of pathways significantly associated with each IDP. While the other cells show the number of pathways in the intersection between pairs of IDPs. Genes and pathways results were obtained using PascalX [33].
We also used PascalX to identify annotated gene-sets (aka “pathways”) enriched with high-scoring genes [32, 33]. The number of pathways associated with each IDP is shown in Figure 3b, left, diagonal. Specifically, ascending (36) and descending aorta minimum area (18) had the most associated pathways, and were the only IDPs with shared pathways (4), including the GO HEART DEVELOPMENT pathway. These IDPs also had the largest pathway overlap with retinal IDPs (Figure 3b, right), primarily with the tortuosity-related IDPs. The venular central retinal equivalent shared one gene set with IMT, specifically a gene cluster on chr8p23. Vascular density shared one pathway with the ascending aorta minimum area, while tortuosities shared pathways with WMH and the areas of the aorta, including pathways like MANNO MIDBRAIN NEUROTYPES HENDO, HP ABNORMAL VASCULAR MORPHOLOGY, and actin-related ones, like GO ACTIN FILAMENT BUNDLE, and GO ACTIN BINDING. For more details, see Supplementary Data ‘Shared pathways‘.
3 Discussion and conclusions
In this study, we aimed to explore the associations between morphological vascular phenotypes within and across different organs. By leveraging the extensive imaging data from the UKBB, we conducted an analysis that included IDPs from the brain, carotid and aortic arteries, and the retina. This comprehensive approach enabled us to discover numerous significant correlations both at the phenotypic and genotypic level.
From our previous work with IDPs measured from retinal CFIs [27], we observed that morphological IDPs in the retina were often correlated. In this study, we found that the same IDPs, i.e., distensibility, cross-sectional area, measured in the ascending and descending aorta were strongly positively correlated. Conversely, these IDPs were negatively correlated with each other between– and across organs. This can be attributed to the definition of distensibility, which is defined as the difference between the maximum and minimum cross-sectional areas divided by the product of the minimum area and the difference between the maximum and minimum pressures [20]. So, this observed anti-correlation between distensibility and cross-sectional area is likely because, for a saturated difference, distensibility scales inversely to the area.
We observed multiple significant cross-organ correlations between vascular IDPs. For instance, the positive association between WMH and IMT, which aligns with previous studies that found an association between increased carotid IMT and a greater burden of cerebral WM lesions [34, 35]. Additionally, the negative correlations between carotid IMT and lower aortic distensibilities are consistent with prior research, as both IDPs have been associated with a higher risk of heart failure [36, 37]. Our findings also confirmed previous observations that a greater WMH volume is associated with larger aortas (both descending and ascending) [38] and reduced aortic distensibility [14]. Conversely, WMH is associated with smaller diameters and reduced vascular density in the retinal arterioles. It is important to note that in the UKBB, carotid ultrasound and brain and heart MRIs were typically conducted much later than retinal CFIs (median delay is about 9 years), suggesting that increased WMH volume arose subsequently to a reduction in the retinal microvasculature. However, to establish causality, longitudinal data from both imaging modalities would be necessary.
The associations of retinal vascular IDPs with those of the carotid, aorta, and WMH, highlight the potential of the retina as a non-invasive window into systemic vascular health. The negative association between retinal arteriolar vascular density and both IMT and aortic areas, along with positive associations with aortic distensibility, emphasizes the complex interplay between retinal and other systemic vascular properties. This suggests that lower vascular density in the retina might reflect systemic vascular changes, such as increased IMT and larger aortic areas, which are indicative of vascular aging or pathology [39–42]. Conversely, higher aortic distensibility, which reflects healthier and more elastic arteries [43, 44], is associated with higher retinal vascular density. The retina, being a microvascular bed, might thus mirror microvascular health throughout the body, which is impacted by changes in large vessels like the aorta, or responds to microvascular disease. The fact that many significant cross-organ phenotypic correlations were either absent or much weaker at the genetic level suggests that they are likely driven by environmental factors, including lifestyle. In contrast, within a single organ, there was mostly a strong alignment between phenotypic and genotypic correlations, indicating that the environmental impact is less pronounced in this case. Nevertheless, the shared associated genes between WMH, IMT, the aorta, and the retinal vascular IDPs indicate some common genetic under-pinnings, with genes like EIF3K, COL4A2, and SMAD3 [Gene Card] making them interesting candidates for modulators of systemic vascular health. Furthermore, the identification of shared pathways among retinal and aortic IDPs underscores the interconnected genetic mechanisms influencing vascular conditions across different organs.
The generalisability of our findings is limited by the specificity of the IDPs studied and the population characteristics of the UKBB cohort. While compelling, these results may not fully translate to diverse populations or those with different health profiles. Practical limitations also include the resolution constraints of non-invasive imaging modalities and the potential for selection bias in the UKBB cohort. Our study primarily focused on genetic and phenotypic correlations, which can only serve as a starting point to elucidate the mechanistic pathways driving them. Future research should aim to validate our findings in more diverse populations and explore the mechanistic pathways underlying the observed associations.
Our study provides initial insight into the relationships between vascular morphology at different scales, from the microvasculature (as reflected in retinal IDPs and WMH as a marker of small vessel health) to the macrovasculature (properties of the aorta and carotid). This understanding can enhance our knowledge of systemic connections between various vasculatures and aid in the development of better prognostic tools for non-retinal vascular diseases using non-invasive, cost-effective retinal imaging.
4 Methods
4.1 The UKBB Imaging Study
The UKBB is a large-scale biomedical database and research resource containing anonymized genetic, lifestyle, and health information from half a million UK participants. The UKBB’s database, which includes blood samples, heart and brain scans, and genetic data of the volunteer participants, is globally accessible to approved researchers who are undertaking health-related research that’s in the public interest. UKBB recruited 500,000 people aged between 40-69 years in 2006-2010 from across the UK. With their consent, they provided detailed information about their lifestyle, physical measures and had blood, urine, and saliva samples collected and stored for future analysis. It includes multi-organ imaging for many participants, such as MRI scans of the brain, heart, and liver, carotid ultrasounds, and retinal CFIs [45].
The brain imaging data, covers six modalities: T1-weighted structural MRI, T2 FLAIR (fluid-attenuated inversion recovery), susceptibility-weighted MRI, resting-state functional MRI, task functional MRI, and diffusion MRI. These modalities yield various [46], including: a) Mean cerebral blood flow (CBF) maps, derived from arterial spin labeling (ASL) perfusion MRI, they provide insights into resting cerebral blood flow across the brain. b) Mean arterial transit time (ATT) maps, also from ASL data, and they indicate the time it takes for blood to travel from the neck to a given region of interest, potentially revealing vascular issues. Measures of mean CBF and ATT are available for each brain region. c) WMH volumes, obtained from T2 FLAIR structural MRI scans, they serve as markers for cerebral small vessel disease. The mean intensity and the volume of vessels are obtained from T1-weighted brain MRI using the Freesurfer automatic subcortical segmentation (ASEG) tool, for the right and left hemispheres (‘Brain Imaging Documentation’*). Carotid ultrasound data, available for around 20,000 participants, was collected to measure carotid IMT, a marker for subclinical atherosclerosis and cardiovascular disease risk. Images were acquired from both left and right carotid arteries using standardized protocols across all assessment centers. Measurements were taken at four angles (120°, 150°, 210°, and 240°) around the carotid bulb. For each angle, the maximum, mean, and minimum IMT values were computed (‘Carotid Ultrasound Documentation’†). It is important to note that IMT values were available for more subjects than the carotid images themselves.
Cardiovascular MRIs were acquired on 1.5T Siemens MAGNETOM Aera scanners. The imaging protocol included several sequences: Bright blood anatomical imaging in sagittal, coronal, and transverse planes; cine imaging of the left and right ventricles in both long-axis and short-axis views; myocardial tagging for strain analysis; native T1 mapping; aortic flow quantification; and imaging of the thoracic aorta [47]. This comprehensive protocol allows for detailed evaluation of aortic structure and function, providing (among others) IDPs related to aortic distensibility and dimensions. Aortic distensibility, which reflects aortic stiffness, was measured directly by the relative change in aortic cross-sectional area per unit change in pressure (lower distensibility signifies increased stiffness). Additionally, a variety of aortic dimension measures, including maximum and minimum areas, mean and standard deviation areas during diastole and systole, and mean absolute deviation, capture the dynamic changes in the cross-sectional areas of the ascending and descending aorta throughout the cardiac cycle [20–23].
Retinal CFIs, available for around 90,000 participants, were acquired from both eyes using a Topcon 3D OCT 1000 Mark II camera, with images centered to include both the optic disc and macula within a 45° field-of-view.
4.2 Main IDPs selection
We identified imaging modalities capable of capturing vascular morphology and determining relevant vascular IDPs. This process involved a thorough search across the UKBB database, Google Scholar, and the GWAS catalog, using general vasculature-related keywords (e.g., ‘vessel’, ‘vascular’, ‘vasculature’, ‘blood’, ‘artery’, ‘arterial’, ‘arterioral’, ‘vein’, ‘venular’) and specific vessel names (e.g., ‘carotid’, ‘aorta’). While our search aimed to capture all morphological vascular IDPs within the UKBB dataset, we also found additional vascular IDPs in external sources that, despite being measured on the UKBB dataset, were not yet available in the dataset (see Supplementary Data ‘IDPs information’ for details).
In the initial selection, we focused on organ-specific geometric and functional images without simplification. For the brain, IDPs such as CBF and ATT were available for all brain parts. To manage the high correlation among these measures, we calculated the average of CBF and ATT across the brain. We also considered total/deep/and peri-ventricular WMH volumes, as well as the mean intensity and volume of vessels in the brain, for both hemispheres (see Supplementary Figures 1 and 2). As explained before, carotid IMT IDPs were measured at four different angles, and for each, the main, minimum, and maximum values were available. These values were averaged across angles for consistency with previous studies. For heart vascular IDPs, we included various measures of ascending and descending areas, systolic and diastolic parameters, standard deviation, mean absolute deviation, stroke, and ejection fraction (see Supplementary Figure 2).
Further simplification was applied while ensuring the comprehensive representation of all organ images vascular morphology. For the brain, although CBF and ATT are valuable for understanding associations among brain IDPs, they were not used as main IDPs due to their limited sample size and their potentially functional nature. Among the three WMH IDPs, only the total WMH was selected because of its strong correlations with other IDPs. We only considered WMH as a main vascular IDP for the brain, although data for total volume and intensity of a brain region annotated as ‘vessels’ (from FreeSurfer automatic segmentation of T1 images) were available. However, the number of voxels typically attributed to these regions was extremely small, and the corresponding IDPs did not correlate significantly with any of the other IDPs we studied (see Supplementary Figure 2). This suggests they may, at best, be very noisy representations of vascular entities. In contrast, WMH is a well-established marker of vascular lesions associated with small vessel disease [48].
For the carotid artery, only the minimum IMT was chosen due to its strong correlation with other measures. For the heart, we selected the minimum areas and distensibilities of the ascending and descending aorta because of their relevance and high correlations with other IDPs.
Finally, for retinal vascular IDPs, we aimed to ensure consistency with other morphological vascular IDPs, selecting only vascular density, tortuosity, and vessel diameters to comprehensively represent vascular morphology across different organs and systems.
4.3 Phenotypic correlation
For retinal IDPs, we used data from instance 0, which corresponds to the initial assessment visit (2006-2010) when participants were recruited and consent given, and instance 1, which corresponds to the first repeat assessment visit (2012-13). These IDPs were z-scored and adjusted for various covariates, including sex, age, age-squared, sex-by-age, sex-by-age-squared, spherical power, spherical power-squared, cylindrical power, cylindrical power-squared, instance, assessment center, genotype measurement batch, and genetic PCs 1-20 [27].
For the non-retinal vascular IDPs, only instances 2 (imaging visit, 2014+) and 3 (first repeat imaging visit, 2019+) were available. We used instance 2 due to its larger sample size, as fewer than 300 individuals per IDP were added if we included instance 3. Outliers in the retinal IDPs were already removed using a threshold of 10std [27]. The same criterion was applied to the non-retinal IDPs. These IDPs were also z-scored and adjusted for covariates, including age attended (‘21003-2’), age attended squared, sex (‘31’), UKBB assessment center (‘54’), standing height (‘50-2’), and genetic PCs 1-20 (‘22009-0.1’ to ‘22009-0.20’). We then reduced the selected non-retinal IDPs as detailed in section 4.2. After obtaining the residuals for all IDPs, we performed phenotypic correlation analysis using Pearson’s correlation coefficient. Multiple testing correction was applied using the formulas: *: p < 0.05/Ntest, **: p < 0.001/Ntest, where Ntest = NIDPs×(NIDPs/2+Nretina).
For the main non-retinal IDPs, the sample sizes and demographics were as follows:
4.4 Genetic correlation
To analyze genetic correlations for the main vascular IDPs, we accessed published GWAS summary statistics from the UKBB. For the brain, we used summary statistics for the total volume of WMH, adjusted for covariates such as age, age-squared, sex, sex-by-age, sex-by-age-squared, 10 genetic PCs, head size, head position in the scanner, scanner table position, assessment center location, and date of attending assessment center. The sample size for these statistics was approximately 33,000 participants [49], ‘Brain summary statistics‘.
For the carotid minimum IMT, summary statistics were adjusted for the covariates: age at the time of the imaging visit, sex, genotyping array, and 30 genetic PCs, with a sample size of around 44,000 participants [50]. Summary statistics for the ascending and descending aorta distensibility and minimum areas were available in [20], ‘Aorta summary statistics‘, using bolt_P_BOLT_LMM_INF. Retina summary statistics used the same covariates as those applied in the phenotypic analysis [27], ‘Retina summary statistics‘. More information about the main IDPs can be found in Supplementary Data ‘Main IDPs information‘.
Genetic correlations and h2 were computed using LDSR. Detailed results for h2 can be found in Supplementary Data ‘Heritabilities‘). LDSR was also used to derive the genetic correlations between IDPs [30, 31].
4.5 Genes and pathways
Gene and pathway scores were computed using PascalX [33, 51]. Both protein-coding genes and lincRNAs were scored using the novel, approximate “saddle” method, taking into account all SNPs within a 50kb window around each gene. All pathways available in MSigDB v7.2 were scored using PascalX’ ranking mode, fusing and rescoring any co-occurring genes less than 100kb apart. PascalX requires LD structure to accurately compute gene scores, which in our analyses was provided with the UK10K (hg19) reference panel. Correction for bias due to sample overlap was done using the intercept from pairwise LDSR genetic correlation. The significance threshold was set at 0.05 divided by the number of tested genes (RANKING).
Data Availability
All data produced in the present work are contained in the manuscript or available upon reasonable request to the authors
Data and code availability
Phenotypic data from the UKBB are available upon application through the UKBB website: https://www.ukbiobank.ac.uk. GWAS summary statistics can be accessed via the links provided in the document. The code for this study is available on the public GitHub repository: https://github.com/BergmannLab/multiorgan_vascular_IDPs.
Funding
Supported by the Swiss National Science Foundation grant no. CRSII5 209510 for the “VascX” Sinergia project. The authors declare no conflicts of interest.
Acknowledgements
The authors thank Leah Böttger, Olga Trofimova, David Presby, and Dennis Bontempi for their insightful comments on the manuscript. We also extend our gratitude to the study participants and the staff of the UKBB, as well as the researchers who measured the IDPs and made the GWAS summary statistics publicly available.
Footnotes
↵* E-mails: sofia.ortinvela{at}unil.ch, and sven.bergmann{at}unil.ch
↵* chrome-extension://efaidnbmnnnibpcajpcglclefindmkaj/https://biobank.ctsu.ox.ac.uk/crystal/crystal/docs/brain_mri.pdf
↵† chrome-extension://efaidnbmnnnibpcajpcglclefindmkaj/https://biobank.ctsu.ox.ac.uk/crystal/ukb/docs/carult_explan_doc.pdf
Nonstandard Abbreviations and Acronyms
- ASEG
- Automatic subcortical segmentation
- ASL
- Arterial spin labeling
- ATT
- Arterial transit time
- CBF
- Cerebral blood flow
- CFIs
- Color fundus images
- DBP
- Diastolic blood pressure
- FLAIR
- Fluid-attenuated inversion recovery
- IDP
- Image-derived phenotype
- IMT
- Intima-media thickness
- LDSR
- Linkage disequilibrium score regression
- MRA
- Magnetic resonance angiography
- MRI
- Magnetic resonance imaging
- PC
- Principal component
- SBP
- Systolic blood pressure
- UKBB
- UK Biobank
- WMH
- White matter hyperintensities
References


