
Abstract
With the growing amount of COVID-19 cases, especially in developing countries with limited medical resources, it’s essential to accurately diagnose COVID-19 with high specificity. Due to characteristic ground-glass opacities (GGOs), present in both COVID-19 and other acute lung diseases, misdiagnosis occurs often — 26.6% of the time in manual interpretations of CT scans. Current deep learning models can identify COVID-19 but cannot distinguish it from other common lung diseases like bacterial pneumonia. COVision is a multi-classification convolutional neural network (CNN) that can differentiate COVID-19 from other common lung diseases, with a low false-positivity rate. This CNN achieved an accuracy of 95.8%, AUROC of 0.970, and specificity of 98%. We found statistical significance that our CNN performs better than three independent radiologists with at least 10 years of experience. especially at differentiating COVID-19 from pneumonia. After training our CNN with 105,000 CT slices, we analyzed our CNN’s activation maps and found that lesions in COVID-19 presented peripherally, closer to the pleura, whereas pneumonia lesions presented centrally. Finally, using a federated averaging, we ensemble our CNN with a pretrained clinical factors neural network (CFNN) to create a comprehensive diagnostic tool.
1. Introduction
1.1 Background
The outbreak of severe acute respiratory syndrome coronavirus-2 (SARS-CoV-2) and its associated disease COVID-19 has led to a global pandemic. As of March 31st, 2022, there have been over 486 million COVID-19 cases worldwide, claiming an estimated 6.14 million lives according to the World Health Organization (WHO)1. COVID-19 infects the lungs, specifically the alveolar type II cells, resulting in complications like pneumonia2. Currently, RT-PCR remains the gold standard for COVID-19 diagnosis; however, due to limited sensitivity of 89.9%3, and a wait time of at least 48 hours for results, the need for quicker, and more accurate diagnosis is imperative. This is especially the case when patients present to the hospital with severe respiratory disease that could be COVID-19, but also a condition with similar presentations such as bacterial pneumonia, pulmonary edema, or sepsis. Because of the similarity in presentation of these pulmonary conditions, it is often difficult to form an accurate diagnosis with CT scans alone, leading to a high rate of misdiagnosis.. To this end, a high specificity deep learning model that can quickly and accurately diagnose and differentiate COVID-19 CT Scans from other lung conditions like pneumonia has yet to be developed.
1.2 Disproportionate Effect of COVID-19
The disparity in the COVID-19 healthcare response between developing and developed countries is staggering. According to the World Bank, high and high-intermediate countries have a higher physicians per capita and nurses per capita when compared to low and low-intermediate income countries4. Factors such as slow economic growth in developing countries and the migration of healthcare workers from developing to developed countries are the primary reasons attributed to the lack of healthcare professionals in developing nations4.
The shortage of healthcare workers in the low and low-intermediate countries has led to greater work hours per week and higher rates of burnout5. These issues have only been exacerbated due to the COVID-19 pandemic leading to overburdened medical systems. Using digital technology and automation in healthcare, particularly in low income nations, has great potential to ease the burden on these nations’ already crumbling medical infrastructure.
1.3 Deep Learning
New developments in deep learning have led to innovative potential diagnostic applications. Deep learning allows for the extraction of subtle quantitative features in datasets allowing for analysis of complex patterns in the training data, leading to the possibility of creating automated high-accuracy diagnosis models using medical scans in radionomics6. The convolutional neural network’s (CNN) ability to use historical recall of data, and the use of nonlinear systems (as opposed to commonly used linear systems) allows for more accurate classification. In the past, CNNs have shown general usability in diagnosing retinal conditions using optical coherence tomography7.
1.4 Existing Works
SARS-Net8 is one of many deep learning models developed to aid with COVID-19 diagnosis. While this model is able to achieve an accuracy of 97.6% in identifying COVID-19 from Chest X-Rays (CXRs), this model fails to differentiate COVID-19 from other common pulmonary conditions such as bacterial pneumonia leading to a low specificity. Specificity is a measure of how well a model can identify individuals who do not have a disease and can correctly identify what condition(s) an individual might have instead. For effective use in a clinical setting, and for triaging of patients, models that detect COVID-19 from medical images CT Scans need a high specificity.
2. Methods
2.1 Data Augmentation & Preprocessing
194,922 isolated CT slices for 3475 patients were obtained from the CC-CCII dataset9. The slices were split into 80:20 ratio of training images to testing images. To standardize the images, all the images were resized into a size of {512, 512, 1} through Lanczos3 interpolation. Lanczos resampling rescales the images by passing the pixels in the image through an algorithm based on sinc functions. This type of interpolation minimizes the aliasing, which is crucial for the model to develop accurate patterns. Layers of augmentation were then applied othe training images to increase the diversity of the data. By altering the brightness, saturation, rotation of the images, the model prevents overfitting of the training data.
2.2 Proposed Convolutional Neural Network
The augmented images are passed into the first layer with size 512 × 512 × 1. The first 2 dimensional convolutional layer contains 64 3×3 kernels (Figure 3, left) with a stride of 1×1 because of its edge detection ability.
We used this kernel size (3×3) because it is symmetric around the center, and extracts a large amount of details from the image. While this does increase the computational expense, the difference in computation from a 3×3 filter to filters of greater sizes is marginal. These filters extract features from the images by applying convolution operations to create a feature map. The feature maps are transformed by the Rectified Linear Unit (ReLU) activation function which prevents exponential growth in the computation by assigning 0 to negative input values, thereby activating less neurons in the feature map by zeroing values that do not contain any information. Spacial dimensions are then reduced using a 2×2 max-pooling filter which significantly reduces the computational cost by reducing the number of parameters to learn. Lesions such as GGOs, crazy-paving patterns, and consolidation in the lungs all show up on a CT Scan as brighter pixels. Brighter pixels have grayscale values closer to 1 while darker pixels have grayscale values closer to 0. This is why maximum pooling was used instead of minimum pooling because on CT Scans: the maximum values (i.e. the brightest pixels) contain the most relevant information about the image needed for classification of lung diseases. The resulting feature maps contain high-level features which are then classified by a multilayer perceptron network after being flattened. A Softmax activation is used to normalize the output from the last fully connected layer into a multinomial probability distribution over K classes. Here, K = 3 for COVID-19, bacterial pneumonia, and healthy slices. Our CNN has 6,542,531 trainable parameters.
2.2.1 Minimizing Complexity
Between the input and output layers of a neural network, a series of hidden layers are used to identify various patterns within the training data. The training accuracy of a CNN will generally increase with more hidden layers, along with the computation and complexity of the model. An overly complex model will often overfit because it learns the patterns in the training data so well that it isn’t able to extrapolate to testing data. This means there is a tradeoff between the complexity and the accuracy the model achieves on testing data. Current state-of-the-art models VGG19, InceptionV3, and ResNet152 have 19, 48, and 152 layers respectively. These large numbers of layers significantly increase how much the model overfits because the model is too complex. This complexity also increases the time to train the model because of the substantial amount of computation that comes along with additional increased layers. On computing systems with lower computation power, these models may be untrainable in certain scenarios due to the immense amount of computation required. With this in mind, our CNN was designed to classify image features with just 6 hidden layers. Together with the input and output layers, our CNN minimizes unnecessary computation and complexity.
2.3 Training Convolutional Neural Network
Our CNN was trained using a stratified random sample of 105,000 isolated CT slices taken from our training set (Section 2.1). We used 35,000 slices for COVID-19, pneumonia, and healthy (control). We trained our CNN on a NVIDIA GeForce 3090 GPU for 250 epochs by using CUDA, which enabled the GPU to be used for general purpose computing. The Tensorflow operations performed on the NVIDIA GPU were accelerated with the cuDNN library. All Python scripts were run using Ubuntu.
2.2.2 Dropout Layers
After choosing the number of hidden layers in our novel architecture, we further increased accuracy and prevented overfitting by implementing regularization through dropout layers. Dropout layers randomly set some of the outputs of a certain layer to 0. The proportion of outputs that are dropped out is based on the dropout factor p such that the probability an output in a certain layer is dropped is 1 − p. We placed dropout layers after the 1st and 2nd max-pool layers and after the 1st and 2nd dense layers (Figure 2). Standard convention is to set dropout p = 0. 5 for fully connected (dense) layers and p = 0. 8 or 0. 9 for convolutional layers, however this technique is arbitrary and is not generalizable to every CNN. Using GridSearchCV from sklearn library, we use grid searching to test dropout factors between 0.1 and 0.9 (increment = 0.1) in combination for all four dropout layers. The following set of dropout factors achieved the highest accuracy on a training set:: 0.6 for between the convolutional layers and 0.7 for between the dense layers.

Example of an original vs augmented CT slice. In this case, the rotation filter was applied to the input image.

Visualization of the CNN’s Architecture

Accuracy of the CNN in classifying the training data across 250 epochs (left) and value of categorical cross-entropy loss function for each epoch (right).

Architecture of Clincal Factors Neural Network

Accuracy of the CFNN in classifying the training data across 50 epochs (left) and value of categorical cross-entropy loss function for each epoch (right).
2.3.1 Initializing Weights
Our CNN uses random initialization is used to set the initial weights for the model before training. Our CNN initializes its weights using a Glorot (Xavier) Uniform Initializer because of its ability to maintain variance across layers, which prevents the gradients from exploding or vanishing. The weights for each layer are chosen by selecting samples from the range on a uniform distribution.
2.3.2 Loss Function
The CNN used the Categorical Cross Entropy loss function10. This loss function takes the model’s predictions and applies a Softmax activation to form a probability distribution (pi). The distance between this predicted probability distribution and the ground truth values (ti) is calculated by cross-entropy and is penalized logarithmically so that large differences output a value of 1 while small differences output a value of 0. Specifically, the logarithm (base 2) of this distribution is multiplied with the distribution of the ground truth label for all classes (n). The categorical cross entropy (Formula 2) is calculated by summing all of these products across all the classes to form a quantitative measurement of the uncertainty, or lack of order, in the system, A categorical cross entropy closer to 0 indicates the current set of weights are able to classify the training CT Scans with a high accuracy. A categorical cross entropy closer to 1 indicates the current set of weight classifies the training CT Scans with a low accuracy.

2.3.3 Adam’s Optimizer
Our CNN uses Adam’s Optimizer11 to minimize its categorical cross-entropy loss. Adam’s optimizer was chosen because of its use of momentum and a non constant learning rate. Momentum allows the optimizer to overcome valleys caused by noise in the loss gradient when converging to the minima. Adam’s uses an adaptive learning rate based on adaptive moment estimation. The optimizer computes the moving averages of gradient (Gt) and gradient squared (Gt 2) to estimate the moments mean (mt and uncentered variance (νt) respectively. mt and νt are calculated using Forumula 3 and Formula 4 respectively. Formula 5 uses information from the current interaction of weights as well as the hyperparameters to adjust the weights for the iteration in order to minimize the value of the categorical cross entropy loss function. In Formulas 3-5, t is a certain iteration of weights at a specific epoch. The hyperparameters for these computations were tuned using a grid-search method for COVison. Using GridSearchCV from the sklearn library in Python, a cross validation process is performed where a metric for different portions of the data are averaged to estimate the performance. This process was used to tune the initial learning rate (η), beta 1 (β1), beta 2 (β2) for the CNNwith root mean squared error as the metric. The hyperparameters were tuned by a factor of 10 from a range of 0.1 to 0.0001 for η and 0.9 to 0.9999 for β1 and β2. The combination of hyperparameters that achieved the lowest root mean squared error are summarized in Table 1.
CNN and CFNN Adam’s optimizer hyperparameter choices that achieved lowest RMSE after grid-searching
Breakdown of how many CT scans and clinical factors used for the testing and training of COVision.


2.4 Clinical Factors Dataset Oversampling
We used the Khorshid COVID Cohort (KCC)12, and the Israeli Ministry of Health public health database13 to construct a custom dataset of 7 clinical factors (shortness of breath, cough, headache, fever, sore throat, age, and gender). Combined, we compiled clinical factors for 30 patients with COVID-19, 30 patients with pneumonia, and 125,882 healthy patients. Training a model on this dataset results in an imbalance classification problem because of the skewness in distribution over the three classes. To address this, the data was resampled using the Imbalanced Learn library in Python. The majority class of healthy patients was undersampled so that 12,000 sets of clinical factors were randomly selected. Both minority classes of patients with COVID-19 and patients with pneumonia were oversampled through random duplication so that 11,970 sets of clinical factors were added to the original 30 sets for both classes. We applied oversampling and undersampling to the three classes. The complete dataset had 36,000 sets of clinical factors equally distributed among the three classes. This was split 80:20 into a training/testing set.
2.5 Clinical Factors Neural Network (CFNN)
In addition to CT Scans, a patient’s clinical factors can serve as a means of differentiating whether a patient has COVID-19 or pneumonia. We designed this secondary neural network called the clinical factors neural network (CFNN) to work in conjunction with our CNN (for CT Scans) designed and trained in Sections 2.2 and 2.3 respectively. Adding another neural network to the CNN framework increases the variation during training, which consequently decreases the spread of predictions and the overall bias. The ensembling process to combining the CFNN and CNN is described in Section 4.
Our CFNN is a fully connected neural network (FCNN), or multilayer perceptron neural network, with 6 fully connected (dense) layers. This means that every neuron in a specific layer is connected to every neuron in the following layer. The output layer has a size of 3 neurons in our model, which are the 3 classes the images are categorized into. The large amount of connections increases the complexity and computation time, so we added a dropout layer for regularization after the first 3 dense layers to reduce overfitting. The dropout factor was tuned to p = 0.5 using the same grid-searching method in Section 2.2.2. ReLU was used as the activation function in all the hidden layers to prevent exponential growth in computation, and Softmax was used in the final layer to create the probability distribution over the 3 classes: COVID-19, pneumonia, and healthy (control). In total, there are 60,099 trainable parameters in our CFNN.
2.6 Training CFNN
In total we trained our model for 7 clinical factors: shortness of breath, cough, headache, fever, sore throat, age, and gender. After processing our training data, we trained our CFNN on a NVIDIA GeForce 3090 GPU using CUDA and cuDNN. We utilized early stopping in our training, which is a regularization method in which the amount of epochs is decreased to minimize overfitting. Both the accuracy and loss of the model began to stabilize by 40 epochs so we did not continue training our model past 50 epochs. The weights in our CFNN were initialized using a Glorot Uniform Initializer (Section 2.3.1) and the Categorical Cross Entropy loss function (Section 2.3.2). Adam’s Optimizer was used to optimize the weights to minimize the Categorical Cross Entropy loss function, thereby achieving maximum accuracy. We used grid searching to choose the best hyperparameters for Adam’s Optimizer (methodin Section 2.3.3). The optimal hyperparameters are summarized in Table 1. The network reached a maximum accuracy of 92% and a loss of 0.12.
3. Results
3.1 CNN Testing
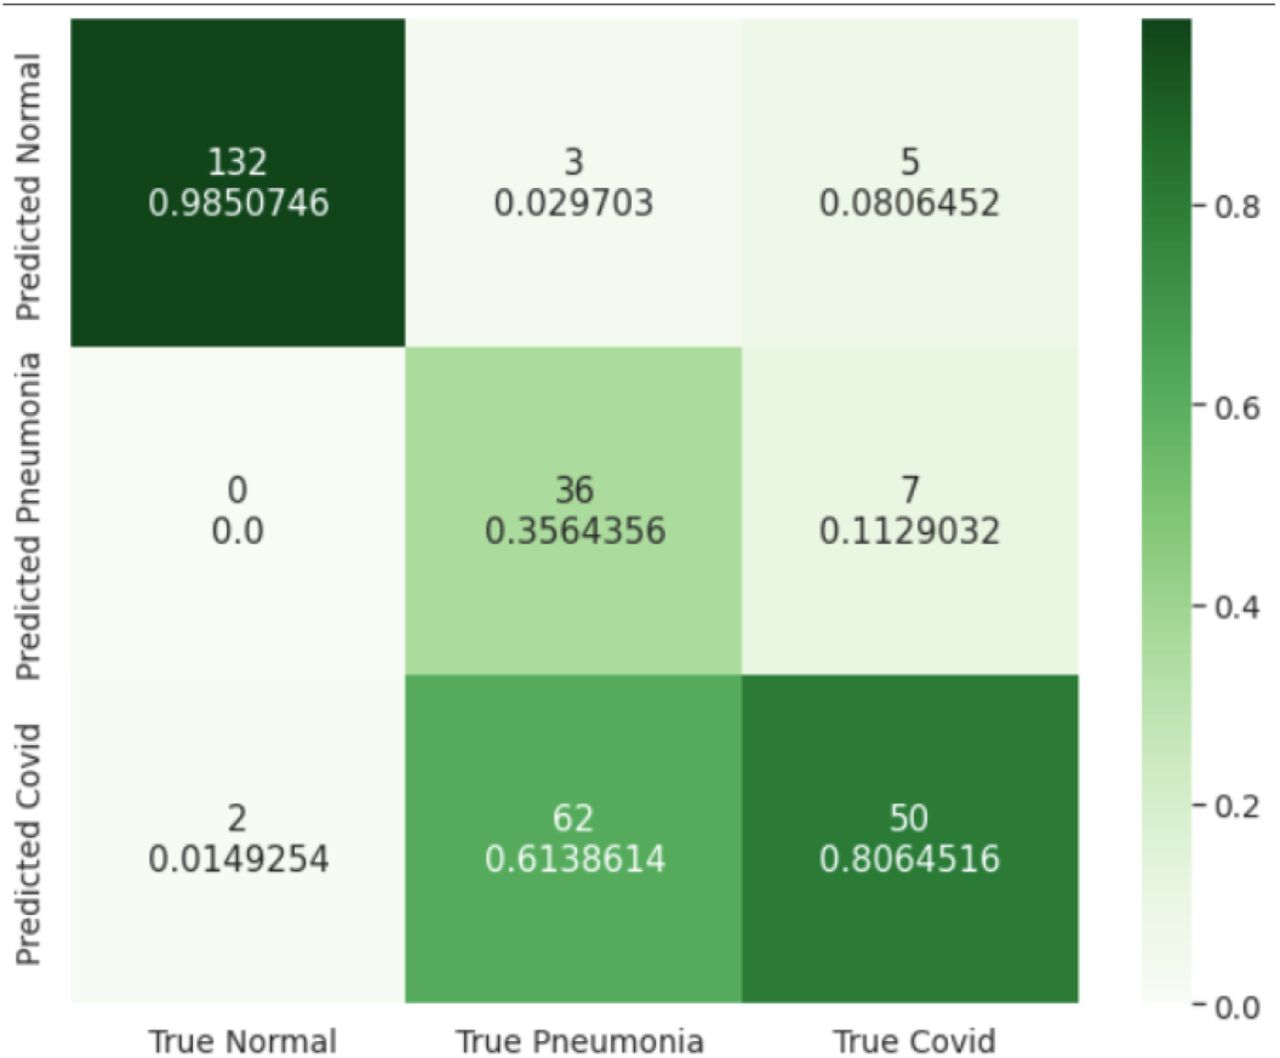
To test our CNN, we took an simple random sample of 25,658 isolated CT slices from ourtesting set created in Section 2.1. The breakdown of the testing data are as follows: 12766 healthy (control), 7254 pneumonia, and 5638 COVID-19. None of the slices used for testing were a part of the training set to prevent overfitting to the training data. Results after classifying the testing images are summarized in Figure 6 (confusion matrix).

Confusion matrix comparing the true labels for the 25,658 CT scans and the predicted labels by our CNN.

Visualization of the CNN’s AUROC versus a random classifier (dashed lines). AUROCs closer to 1 indicate a greater ability to seperater the 3 different classes.
For this multi-classification problem, we use multiple metrics to determine the accuracy of our CNN in differentiating between healthy lungs, lungs with pneumonia, and lungs with COVID-19. One such metric is the AUROC (area under receiver operating characteristic) which is a graphical plot that illustrates the diagnostic ability of a classifier system based on how well the CNN differentiates between different classes. To graph AUROC, we calculated the true positive rate (TPR), false positive rate (FPR), true negative rate (TNR), and the false negative rate (FNR) after we testing our CNN on the testing data.
We calculate true positive, true negative, false positive, and false negative rates by using the “one vs all” method. For example, to calculate the cumulative false positive value, we calculate the FP (6) for all three classes-COVID, pneumonia, and healthy - and then average of all three values to determine the final combined FP. Specifically we take one class, for example, COVID, and treat the combine pneumonia and healthy and treat it as the “rest”. Thus we reduce the 3×3 confusion matrix (Figure 6) to a 2×2 matrix and then we use Formulas 6 and 9 to calculate the TPR and the FPR respectively. After repeating this process for all three classes, we calculate the sensitivity (cumulative FPR) using Formula 11, and specificity (cumulative TPR) using Formula 12. For these formulas, n = number of classes = 3. Finally we graph the sensistivty and specificity to create the AUROC.


3.2 Comparison Against Radiologists
We performed a two sample z-test to determine if our CNN outperforms 3 independent board-certified radiologists with at least 10 years of clinical experience with statistical significance. We took an simple random sample of 297 images from our testing set and asked three radiologists to blindly classify CT scans as either COVID-19, bacterial pneumonia, or healthy. Radiologist 1 classified 97 images, Radiologist 2 classified 150 images, and Radiologist 3 classified 88 images. The radioloigsts’ results are summarized in Figure 8.

Confusion matrix comparing the true labels for 297 CT scans and the predicted labels by 3 independent radiologists. The radiologists’ accuracy was 73.4%.

Grad-CAMs for bacterial pneumonia (left), and a COVID-19 CT scans (right). Yellow pixels have a higher weightage. Blue pixels have a lower weightage.
We performed the two sample z-test at a significance level of α = 0. 05. Our CNN had an accuracy of p1 = 0.958 on a testing sample size of n1 = 25658, and the radiologists had an accuracy of p2 = 0.734 on a testing sample size of n2 = 297. Our null hypothesis was that the accuracy of our CNN is equal to accuracy of the three radiologists (p1 = p2). Our alternate hypothesis was the accuracy of our CNN is greater than accuracy of three radiologists (p1 > p2). All conditions were met for performing the test as both samples were random (used the sample function from the random library in Python). All calculations were computed using the statsmodels library in Python.
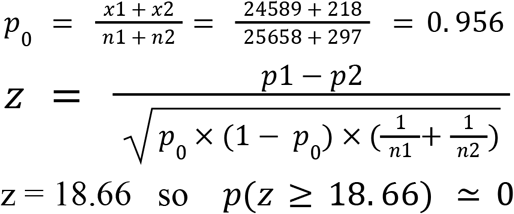 Since the p-value of approximately 0 is less than the significance level of 0.05, there is significant evidence to reject the null hypothesis. Specifically, there is significant evidence that our CNN is more accurate than the three radiologists in classifying chest CT scans as COVID-19, bacterial pneumonia, or healthy. When analyzing the confusion matrices (Figures 6 and 8), we find that our CNN can differentiate COVID-19 from pneumonia with 97.8% accuracy while the three trained radiologists can differentiate with a 55.5% accuracy.
3.3 Grad-CAMs for CNN
To visualize the weights of the trained CNN we created Gradient-Weighted Class Activation Mapping (Grad-CAMs) for a stratified simple random sample of 3000 CT slices from our CT scan testing set without any data augmentation (i.e. flips, rotations, etc.) because we wanted to generalize our Grad-CAMs to a standard view of Chest CT Scans. This resulted in 1000 healthy scans, 1000 pnuemonia scans, and 1000 COVID-19 scans. Heat-maps of the activation map from the CNN’s last convolutional layer were created with a CT scan as input. This quantitative heat-map was then normalized to a range of [0, 1] and transformed into a visualization with a jet color scale from Matplotlib library in Python. Superimposing these colored heat-maps onto the original CT scan highlights regions of the CT scan that the model perceives as significant for accurate classification. The Grad-CAMS show that lesions are generally present in the center of the lungs in bacterial pneumonia. Lesions for COVID-19 typically present peripherally, closer to the pleura. COVID-19 lesions are also shown to be much more scattered while lesions from bacterial pneumonia are more localized. These human-interpretable image features can be used by radiologists to improve the accuracy of manual diagnosis of pulmonary conditions.
3.4 CFNN Testing
The clinical factors neural network (CFNN) was blindly tested on the a testing set of 7200 clinical factor sets (2400 for healthy, pneumonia, and COVID-19). The CFNN achieved an accuracy of 88.75%, correctly classifying 6390 sets of clinical factors. The highest categorical accuracy of 97.58% came from the Healthy class, followed by 85.46% for COVID-19 and 83.20% for pneumonia. Therefore, our CFNN should be used in conjugation with other models to produce the most accurate diagnosis. To this end, we propose an ensemble model combining our CNN and CFNN in Section 4.
3.5 CFNN Weights
The weights from the trained CFNN were extracted from the model to determine the importance of each clinical factor in making a prediction. These weights for the neurons mathematically transform the input into the output for the neuron and determine the impact of the neuron on the next layer. Using the get_weights function from the layers module in tensorflow.keras, the weights across the first layer were averaged for each of the 7 input neurons. After normalizing the weights to a [0, 1] range, we found that the most influential factor was “Shortness of Breath”.
4. Ensembling
To combine our CNN and CFNN which can both independently differentiate between healthy, pneumonia, and COVID-19 patients, we create an ensemble model. Specifically, the predictions of each network are combined using federated weight averaging which determines a weight (w) based off of the ratio of training data used for the Kthmodel (n k) to total training data used for all models (n). For our ensemble model, K = 2 for the two trained models and F(k) are the weights for the kth trained model. nCNN = 105000 for the CNN and nCFNN= 36000 for the CFNN which forms a ratio of0.745 to 0.255 between the two models for the weighted average. This formula for w is shown in Formula 1314.

5. Discussion
Through our research, we developed a deep learning framework to differentiate COVID-19 from other common pulmonary conditions. Our framework has two parts: a convolutional neural network (CNN) that uses CT scans, and a clincal factors neural network (CFNN) that uses clinical factors such as age, weight, and symptoms to help differerntiate between healthy, pneumonia, and COVID-19 patients. Together we call this framework COVision. In the future, this framework can be trained to differentiate other lung conditions apart from bacterial pneumonia such as different types of lung cancer. The CNN achieved an accuracy of 95.8%, an AUROC of 0.970, and a specificit of 98% on 25658 CT scans from our testing set. When compared to three board certified radiologists with at least 10 years of experience, our CNN has a statistically significant higher accuracy (95.8% vs. 73.4%), especially in differentiating COVID-19 from pneumonia and healthy CT Scans. After analyzing our CNN’s activation maps, we found evidence that COVID-19 lesions presented peripherally, closer to the pleura while pneumonia lesions presented centrally on a chest CT scan of the lungs (coronal plane). When analyzing the weights of our CFNN (clinical factor neural network), “shortness of breath” was the best indicator of diease. COVision has the potential to save countless lives, particularly in developing nations with a shortage of doctors and huge volume of patients due to the coronavirus pandemic by assisting medical professionals in the diagnosis process for these patients.
Data Availability
All data produced are available online at: 1) Consortium of Chest CT Image Investigation (CC-CCII) Dataset: http://ncov-ai.big.ac.cn/download?lang=en 2) Khorshid COVID Cohort (KCC): https://doi.org/10.6084/m9.figshare.16682422.v1 3) Israeli Ministry of Health: https://data.gov.il/dataset/covid-19/resource/74216e15-f740-4709-adb7-a6fb0955a048
http://ncov-ai.big.ac.cn/download?lang=en
https://doi.org/10.6084/m9.figshare.16682422.v1
https://data.gov.il/dataset/covid-19/resource/74216e15-f740-4709-adb7-a6fb0955a048
6. Data Availability
The CT Scans of COVID-19, pneumonia, and healthy patients were obtained from the China Consortium of Chest CT Image Investigation (CC-CCII) dataset9. Ground truth for the CC-CCII dataset was established via serology tests and confirmed by laboratory findings. Clinical factors for COVID-19, and pneumonia patients were obtained from the Khorshid COVID Cohort (KCC)12. Clinical factors for healthy patients were obtained from Israeli Ministry of Health public dataset13. We compiled all the clinical factors data into a CSV file using the pandas and numpy libraries in Python. We removed the clinical factors from the dataset that were not one of the following: shortness of breath, cough, headache, fever, sore throat, age, and gender. We binarized the ages of the patients by having a threshold age of 60 years (1 assigned to age if age is greater than 60 years, 0 assigned if the age is less than 60 years).


