
ABSTRACT
Causal estimands of infectious disease interventions—direct, indirect, overall, and total effects— are conventionally defined as differences in individual risk under hypothetical treatment conditions. During the coronavirus disease (COVID-19) pandemic, researchers implicitly targeted analogous estimands at the population level by comparing count outcomes (e.g., vaccine-averted deaths) to quantify public health impact of non-pharmaceutical interventions or vaccination campaigns. However, these population-level analogs of conventional estimands have not been rigorously defined. Using potential outcome notation, we introduce a population-level analog of the overall effect and partitioned it into components involving individual-level direct and indirect effects. We further identify conditions under which a population-level analog of direct effect (frequently estimated with empirical data in cases-averted or avertible analyses), can be a useful lower bound of overall effect (arguably the most relevant effect for policy-making and retrospective policy evaluation) at the population level. To illustrate, we describe a susceptible-infected-recovered-death model stratified by vaccination status. When transmission and fatality parameters do not vary and vaccine efficacies do not wane over time, cases averted via direct effect among vaccinated individuals (or cases avertible via direct effect among unvaccinated individuals) is shown to be a lower bound of population-level overall effect—that is, vaccine-averted (or avertible) cases. However, when vaccine efficacies wane, this relation may not hold for avertible cases; when transmission or fatality parameters increase over time, it may not hold for either analysis. By classifying population-level estimands and establishing their relations, this study improves conduct and interpretation of research evaluating impact of infectious disease interventions.
1. INTRODUCTION
The effects of an infectious disease intervention, such as vaccination, are quantified in terms of direct, indirect, overall, and total effects—each defined as a contrast between potential outcomes at the individual level.1 These estimands consider the individual risk of developing an infectious disease outcome as a function of the individual treatment status and the treatment status of the rest of the group to which the individual belongs.2 Throughout the coronavirus disease (COVID-19) pandemic, researchers have often targeted the analogs of these estimands at the population level (i.e., estimands defined for count outcomes such as the number of infections, hospitalizations, and deaths in a group of individuals, instead of risk in each individual) to investigate the public health impact of interventions such as vaccination. For example, researchers have estimated the COVID-19 deaths (or infections) averted by vaccination campaigns in the United States,3,4 Israel,5,6 Chile,7 Brazil,8 and Japan.9 Similarly, other studies including ours10 have attempted to estimate vaccine-avertible—that is, how many deaths could have been averted by vaccination, but were not because of a failure to vaccinate a proportion of the population.10,11 (Note that in our study,10 large uncertainties exist regarding the exact number of preventable deaths). However, to the best of our knowledge, these population-level estimands have not been rigorously defined in a causal inference framework. Consequently, different studies have measured different kinds of vaccine-averted deaths. Some studies estimated the total deaths averted in a whole country by simulating the epidemic trajectory of an entire country under the counterfactual of no vaccination and compared it with the estimated deaths under the observed vaccination campaign;3,12 other studies estimated vaccine-averted deaths via the direct effect among the vaccinated individuals by taking the difference in death rates between the vaccinated and unvaccinated groups and multiplying the difference with the number of vaccinated individuals with no previous documented infections.6–8 Although both types of studies aimed to quantify “vaccine-averted deaths,” they targeted different estimands, but the existing conceptual framework was not designed to distinguish between these different population-level estimands.
This study defines and classifies the population-level analogs of causal estimands for infectious disease interventions using potential outcome notation, such that researchers can use and distinguish the estimands to evaluate public health impact of infectious disease interventions. Based on an infectious disease transmission model, we identify the conditions under which direct effect (easiest and most frequently estimated among all types of effects) is a lower bound of overall effect (arguably the most relevant effect for policy-making and retrospective policy evaluation) at the population level.13,14
2. INDIVIDUAL-LEVEL DIRECT, INDIRECT, OVERALL, AND TOTAL EFFECTS
Hudgens and Halloran2 previously defined causal estimands for individual-level direct, indirect, overall, and total effects. We follow their setup and notation but add an additional index t to outcomes to represent cumulative incidence up to time t. Consider a two-stage randomized experiment in which there are m groups indexed by i = 1, …, m, such that each group consists of N individuals indexed by j = 1, …, N. Partial interference is assumed: Individuals make contacts (leading to interference) within the same group, but individuals in different groups make no contacts. For ease of exposition, assume interest lies in quantifying the effect of vaccination which is a one-time event before the start of an outbreak. Let Aij = 1 if individual j in each group i is vaccinated and Aij = 0 otherwise. Let Ai = (Ai1, Ai2, …, AiN) and Ai,−j = (Ai1, Ai2, …, Aij−1, Aij+1, …, AiN), hereafter referred to as allocation programs.14 Let ai and ai,−j denote possible realizations of Ai and Ai,−j, respectively. Let 𝒜(N) denote the set of all possible 2N vaccine allocations for a group of size N, for which ai ∈ 𝒜(N). Let Yij(t, ai) denote the potential binary outcome for individual j in group i at time t with allocation program ai and let Yij(t, ai,−j,a) denote the potential binary outcome at time t when individual j has vaccination status a and the rest of group i has vaccination status ai,−j. Hudgens and Halloran2 define the marginal individual average potential outcome as
 and the individual average potential outcome2 as:
 where
where  is the probability distribution of vaccine allocation program Ai with parameter α ∈ [0,1] representing the proportion vaccinated within group i (Note here we use type A parameterization, which gives same effect definitions as type B parameterization suggested by VanderWeele and Tchetgen Tchetgen14 when N is large). Hudgens and Halloran2 further define group average potential outcomes
  and
and  by averaging over individuals within groups. Assume that the m groups are independently drawn from an infinite superpopulation of groups and let
  denote the probability of having developed the outcome by time t under the counterfactual setting where the proportion vaccinated is α in the superpopulation of groups.15 Similarly, let
  denote the probability of having developed the outcome by time t when an individual has vaccination status a and the group has a fixed proportion α of vaccinated individuals. We now define population average individual direct, indirect, total, and overall effects2 in the superpopulation (Note despite “population average” nomenclature, which is retain from Hudgens and Halloran2, in our setup these are still individual level effects because they are risks for typical individuals in the superpopulation rather than counts).
Individual-level Direct Effect (IDE)
 The individual-level direct effect2 compares the probability of having developed the outcome by time t when an individual is unvaccinated versus when vaccinated, holding fixed the proportion vaccinated (α).
Individual-level Indirect Effects (IIEs)
 The individual-level indirect effect2 compares the probability of having developed the outcome by time t for an unvaccinated individual in a group with α0 proportion vaccinated versus with α1 proportion vaccinated. This effect, defined by Hudgens and Halloran2, is hereafter referred to as the individual-level indirect effect for the unvaccinated. Indirect effect can be analogously defined when an individual is vaccinated as follows:15
 which is hereafter referred to as the individual-level indirect effect for the vaccinated.
Individual-level Overall Effect (IOE)
 The individual-level overall effect2 compares the probability of having developed the outcome by time t for a typical individual in a group with α0 proportion vaccinated versus with α1 proportion vaccinated.
Individual-level Total Effect (ITE)
 The individual-level total effect2 compares the probability of having developed the outcome by time t when an individual is unvaccinated in a group with α0 proportion vaccinated versus when the individual is vaccinated in a group with α1 proportion vaccinated. ITE(t, α0, α1) can be decomposed into IDE(t, α1) and IIEUnvax(t, α0, α1) by adding and subtracting the term
  :
:
 Alternatively, ITE(t, α0, α1) can also be decomposed into IDE(t, α0) and IIEVax(t, α0, α1) by adding and subtracting the term
  :
:

Individual-level Overall Effect Partitioning
Theorem 1 (individual-level overall effect partitioning).
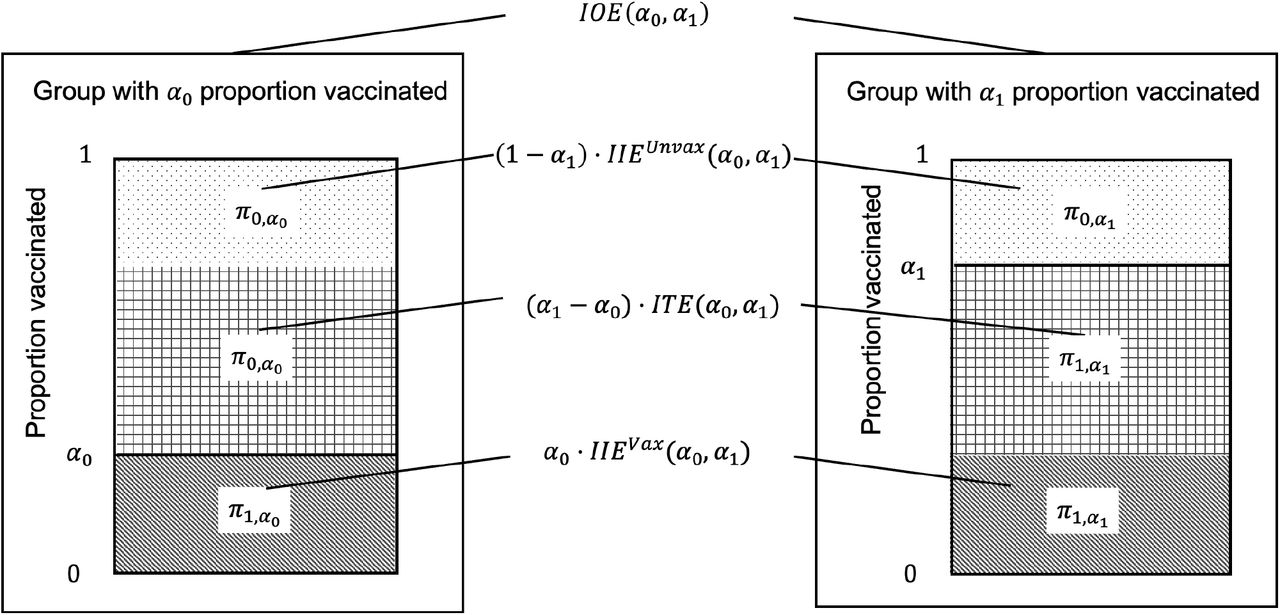
 Theorem 1 is proved in eAppendix 1 and graphically illustrated in Figure 1. Theorem 1 expresses IOE(α0, α1) as a weighted average of three effects: 1) IIEVax(t, α0, α1), 2) ITE(t, α0, α1), and 3) IIEUnvax(t, α0, α1). Intuitively, if individuals are classified by their vaccination status under a pair of counterfactuals wherein the group has α0 or α1 proportion vaccinated (α1 > α0), then IIEUnvax (t, α0, α1) is in operation for proportion α0 of individuals who are vaccinated under both counterfactuals; ITE (t, α0, α1) is in operation for proportion α0 − α1 of individuals who are vaccinated under α1 but unvaccinated under α0; and IIEUnvax (t, α0, α1) is in operation for proportion 1 − α1 of individuals who are unvaccinated under both counterfactuals. Previously, Hudgens and Halloran2 showed that when α0 = 0, IOE (t, α0, α1) is the weighted sum α1 · ITE(t, α0, α1) + (1 − α1) · IIEUnvax (t, α0, α1). In this study, the partitioning of IOE(t, α0, α1) has been generalized to any α0 and α1 as in Theorem 1.

Time notation (t) is suppressed for the ease of exposition. The two rectangles represent a pair of counterfactuals wherein the group has α0 or α1 proportion vaccinated (α1 > α0). Individuals fall into three categories based on their vaccination status under the counterfactuals: 1) the dotted region represents those who are unvaccinated under both counterfactuals (hereafter referred to as “never-vaccinated”) and for whom IIEUnvax (α0, α1) is in operation; 2) the gridded region represents those who are unvaccinated under α0 but vaccinated under α1 and for whom ITE(α0, α1) is in operation (hereafter referred to as “additionally-vaccinated”); and 3) the stripped region represents those who are vaccinated under both counterfactuals (hereafter referred to as “always-vaccinated”) and for whom IIEVax(α0, α1) is in operation. Theorem 1 shows that IOE(α0, α1) is a weighted average of three effects: 1) IIEUnvax(α0, α1), 2) ITE(α0, α1), and 3) IIEvax(α0, α1), each weighted by the proportion of individuals for whom the effect is in operation respectively: 1) 1 − α1 for the never-vaccinated, 2) α1 − α0 for the additionally-vaccinated, and 3) α0 for the always-vaccinated.
3. POPULATION-LEVEL DIRECT AND OVERALL EFFECTS
Motivating Examples and Causal Questions
During the COVID-19 pandemic, determining the total number of infections (or deaths) averted by vaccination has been of great public health interest.3–9,12,16,17 Vaccine-averted infections (or deaths) is a population-level estimand based on the causal question: How many infections (or deaths) have been averted under the current proportion vaccinated (α1) compared to the counterfactual in the absence of vaccination (α0 = 0)?
Alternatively, researchers have also shown interests in estimating the vaccine-avertible deaths, that is those that could have been averted by vaccination but were not because of a failure to vaccinate.10,11 The causal question in this case is: How many infections (or deaths) could have been averted under full vaccination (α2 = 1), but were not averted given the current proportion vaccinated (α1)?
In general, population-level estimands can be defined by comparing the number of infections (or deaths) in a typical group under the observed proportion vaccinated (α1) versus when the group has a lower (denoted as α0, where α0 < α1) or higher proportion (denoted as α2, where α1 < α2) vaccinated.11 We term these as “population-level” estimands because previous literature has referred to vaccine-averted infections (or deaths) as a population(-level) impact9,16 or an estimand with population-level implications.5 Note that these estimands compare count outcomes that could be observed at the group (or cluster) level of a two-stage randomized experiment.2
Population-level Overall Effects
The population-level overall effect (POE) directly answers the two aforementioned causal questions on vaccine-averted and vaccine-avertible cases. Therefore, effects of counterfactual vaccination programs such as the vaccine averted and avertible cases above, are best captured by POE.
For α1 > α0, POE is defined as:
 For α2 > α1, POE is defined as:
 Note that mathematical modelling studies implicitly refer to POE when estimating vaccine-averted deaths by simulating the epidemic trajectory under the counterfactual with a hypothetical proportion vaccinated (e.g., α0 = 0) and comparing it with the estimated number under the current vaccination campaign (α1).3,4
Moreover, by Theorem 1 and substituting equation (6.1) into ITE(t, α0, α1), equation (7.1) can be decomposed into:
 for α1 > α0. The first term on the right-hand side of the last line of equation (8.1) scales
IIEVax(t, α0, α1) by number vaccinated under α0. The second term scales IDE(t, α1) by the additional number vaccinated under α1 compared to α0. The third term scales IIEUnvax(t, α0, α1) by number unvaccinated under α0. Similarly, by decomposing equation (7.2) based on Theorem 1 and then substituting equation (6.2) into ITE(t, α1, α2), we have:
 for α2 > α1. The first term on the right-hand side of equation (8.2) scales IIEVax(t, α0, α1) by number vaccinated under α2. The second term scales IDE(t, α1) by the additional number vaccinated under α2 compared to α1. The third term scales IIEUnvax(t, α0, α1) by number unvaccinated under α2.
Population-level Direct Effects
Most empirical studies only have data to estimate IDE(t, α1) based on a single group of individuals under the current proportion vaccinated (α1), but no data from other group(s) under a lower (α0) or higher proportion vaccinated (α2); therefore, most empirical studies cannot estimate POE(t, α0, α1) or POE(t, α1, α2), which are of interest to policy-making and retrospective policy evaluation.13
To generalize the individual-level direct effect for count outcomes, we look for a quantity that can be estimated using commonly available data and that is informative on population-level overall effect. A good candidate is IDE(t, α1) that most empirical studies can estimate. Some studies have estimated deaths averted via direct effect among vaccinated individuals6–9 based on formulas similar to N · (α1 − α0) · IDE(t, α1) by setting α0 = 0, while other studies have estimated deaths avertible via direct effect among unvaccinated individuals10,11 based on formulas similar to N · (α2 − α1) · IDE(t, α1) by setting α2 to be greater than α1 (Note these studies have also considered increases in proportion vaccinated over time, such as occurred during a vaccination campaign, which here we ignore for simplicity).
Following the literature,6–11,16 let the population-level direct effect (PDE) for any α, α’ ∈ [0,1] be:
 In particular, for α1 > α0, we have
 and for α2 > α1,
 Note that PDE(t, α0, α1) or PDE(t, α2, α1) is not a meaningful causal effect by itself because IDE(t, α1) is conditional on α1 only and does not account for the change in individual-level direct effect under the counterfactual when the proportion vaccinated is α0 or α2 instead of α1. However, PDE can be a useful lower bound of POE because now equations (8.1) and (8.2) can be written as:
 for α1 > α0, and
 for α2 > α1.
Consider Claim 1:
 and
and
 In words, Claim 1 asserts that PDE is a lower bound of POE. If Claim 1 is true, PDE, which can be estimated using commonly available data,6–11,16 is a useful lower bound of POE that is relevant for policy-making and retrospective policy evaluation requiring samples from a population of groups as in group-randomized studies.2 Also consider two special cases of Claim 1.
Claim 1a (vaccine-averted cases):
 In words, Claim 1a asserts that for α1 > α0 = 0, cases averted via direct effect of current vaccination among the vaccinated individuals PDE(t, 0, α1) is a lower bound of total vaccine-averted cases among both vaccinated and unvaccinated individuals POE(t, 0, α1).
Claim 1b (vaccine-avertible cases):
 In words, Claim 1b asserts that for α1 < α2 = 0.9, cases avertible via direct effect of current vaccination among some unvaccinated individuals PDE(t, 0.9, α1) is a lower bound of vaccine-avertible cases among both vaccinated and unvaccinated individuals POE(t, α1, 0.9) comparing current proportion vaccinated (α1) to a proportion of α2 = 0.9. Note that we do not compare to full vaccination (α2 = 1) because full vaccination is not realistic when some individuals cannot be vaccinated due to contraindications. In the following sections, we use a susceptible-infected-recovered-death (SIRD) model to verify the conditions under which the Claims may or may not hold.
Based on the effect partitioning results in 10.1 or 10.2, Claims 1a and 1b would be true if IIEVax and IIEUnvax are non-negative. However, it is not immediately intuitive when we might expect that to be the case. Therefore, in the next two sections we describe a transmission model that we use to check Claims 1a and 1b under various scenarios (Section 4), and then describe conditions under which the population direct effect is and is not a lower bound for the population overall effect, using both analytical and simulation-based approaches (Section 5).
4. TRANSMISSION MODEL
The SIRD Model with Vaccination at Baseline
To model the impact of vaccination on infection and death, a SIRD model is used to represent a well-mixed group in a two-stage randomized experiment assuming partial interference.2 The model consists of four states for a vaccinated or unvaccinated individual—susceptible, infectious, recovered, and death due to infection. We assume that the group has been randomly assigned with a vaccination policy wherein the proportion vaccinated is α, and individuals have been randomly assigned with vaccination status a at baseline (a = 1 for vaccinated and a = 0 for unvaccinated; for equation [11], subscript v denotes vaccinated and u for unvaccinated). The vaccine is “leaky” in protecting against infection and infection-related death—that is, vaccinated individuals have the susceptibility reduced by a factor θ against infection (i.e., vaccine efficacy against infection [VEinfection] is (1 − θ)2) and have the susceptibility reduced by another factor k against death (i.e., vaccine efficacy against death given infection [VEdeath∣infection] is (1 − k)2). Individuals mix homogeneously, such that each vaccinated or unvaccinated susceptible individual is equally likely to be infected by any infectious individual. The transmission dynamics are:
 where γ = recovery rate,
  is the hazard rate of infection, with β the number of effective contacts made by a typical infectious individual per unit time, and μ = probability of death due to infection. In equation (11), Su,α(t) and Sv,α(t) denote, respectively, the number of susceptible individuals who are unvaccinated and vaccinated, Iu,α(t) and Iv,α(t) for the infectious individuals, Ru,α(t) and Rv,α(t) for the recovered individuals who are no longer at risk, and Du,α(t) and Dv,α(t) for those who died due to infection. N(t) denotes the sum of all compartments at time t. eFigure 1 shows the model flowchart, and eTable 1 shows the parameter values used in simulation.
Software
All model simulations and visualization are conducted using R 4.2.2 (R Foundation for Statistical Computing, Vienna, Austria).18 All models are implemented using R package odin.19 Code is available at https://github.com/katjia/population_level_effects.
5. WHEN IS POPULATION-LEVEL DIRECT EFFECT A LOWER BOUND OF POPULATION-LEVEL OVERALL EFFECT?
Scenarios
We check the Claims under 5 scenarios (Table). Scenario 1 refers to the SIRD model in equation (11) with time-invariant parameters. eTable 1 lists the model parameters for which one or two parameter(s) varies under each Scenario separately: Scenario 2 increases the number of effective contacts made by a typical infectious individual per day (β) from 0.15 to 0.6 from Day 300 onwards; Scenario 3 increases probability of death due to infection (μ) from 0.01 to 0.1 from Day 300 onwards; Scenario 4 allows both VEinfection and VEdeath∣infection to wane linearly after Day 100 reaching 0% at Day 300; and Scenario 5 combines Scenarios 2 (increasing β) and 4 (waning VEs).
Proof of Claim 1 at the end of outbreak under Scenario 1
For Scenario 1 (i.e., time-invariant parameters), we prove Claim 1 in eAppendix 3—that is, population-level direct effects are lower bounds of overall effects for any two proportions vaccinated—holds in the SIRD model at the end of outbreak (i.e., at t → ∞).
Simulations
For t < ∞, we first verify Claims 1a and 1b (special cases of Claim 1) through simulation based on parameters specified in eTable 1 and initial conditions in eTable 2. We specify α0 = 0 versus α1 = 0.7 in the pair of trajectories to verify Claim 1a and α1 = 0.7 versus α2 = 0.9 to verify Claim 1b. If Claims 1a and 1b both hold for the specified parameters, Latin hypercube sampling is conducted to generate alternative sets of proportions vaccinated and model parameters to verify the full Claim 1. If only one of Claim 1a or 1b holds, Latin hypercube sampling is conducted to verify that the Claim holds under alternative proportion vaccinated and model parameters (e.g., trying alternative values for α1 while fixing α0 = 0 for Claim 1a).
Briefly, Claim 1 only holds under Scenario 1 (i.e., time-invariant parameters), but it does not hold under any other Scenarios. The Table summarizes the results. Figures 2 and 3 show trajectories of population-level effects throughout the epidemic to verify Claims 1a and 1b, respectively. Figures 2 and 3 show that Claims 1a and 1b hold under Scenario 1. Moreover, given alternative sets of proportions vaccinated and model parameters, Latin hypercube sampling verifies that Claim 1 holds under Scenario 1 (eAppendix 4). Under Scenario 2 where β increases, Claims 1a and 1b do not hold: population-level direct effects are not lower bounds of overall effects (Figures 2 and 3) due to negative indirect effects (eFigures 3 to 5). Under Scenario 3 where μ increases, Claims 1a and 1b hold for infections but not deaths due to negative indirect effects for death (eFigures 3 to 5). Under Scenario 4 where VEs wane, only Claim 1a (vaccine-averted cases) holds (Figure 2). Given different values for α1 (while holding constant α0 = 0) and alternative sets of model parameters, Latin hypercube sampling verifies that Claim 1a holds under Scenario 4 (eAppendix 4). However, Claim 1b (vaccine-avertible cases) does not hold (Figure 3) due to negative indirect effects (eFigures 4 and 5). Finally, under Scenario 5 where β increases and VEs wane, Claims 1a and 1b do not hold.

Scenario 1, all parameters are time-invariant; Scenario 2, the number of effective contacts made by a typical infectious individual per day (β) increases from 0.15 to 0.6 at Day 300; Scenario 3, probability of infection-related death (μ) increases from 0.01 to 0.1 at Day 300; Scenario 4, vaccine efficacies against infection and death start to wane linearly after Day 100 reaching 0% at Day 300; and Scenario 5, the combination of Scenarios 2 and 4.

Scenario 1, all parameters are time-invariant; Scenario 2, the number of effective contacts made by a typical infectious individual per day (β) increases from 0.15 to 0.6 at Day 300; Scenario 3, probability of infection-related death (μ) increases from 0.01 to 0.1 at Day 300; Scenario 4, vaccine efficacies against infection and death start to wane linearly after Day 100 reaching 0% at Day 300; and Scenario 5, the combination of Scenarios 2 and 4.
6. DISCUSSION
Motivated by recent research on estimating deaths averted by COVID-19 vaccination, this study defines population-level analogs of direct and overall effect estimands for infectious disease interventions, thereby enabling researchers to distinguish these estimands when conducting and interpreting related studies. Like their well-known individual-level counterparts, the population-level estimands in this study correspond to outcomes that could be observed in a two-stage randomized trial. However, the individual-level estimands correspond to differences in individual risk, whereas population-level estimands correspond to differences in counts for groups. We show the population-level direct effect can be a lower bound for population-level overall effect in a susceptible-infected-recovered-death model wherein transmission and fatality parameters do not vary and vaccine efficacies do not wane over time.
When indirect effects for the vaccinated and unvaccinated are both positive, the population-level direct effect is a lower bound of population-level overall effect (equations 10.1 and 10.2). In general, the indirect effects may be positive because vaccination reduces the infectious individuals at a given time, such that infection-naïve individuals are less likely to be infected.20 However, as we have shown in the current study, there are conditions under which population-level direct effect is not guaranteed to be a lower bound of overall effect due to negative indirect effects (Scenarios 2–5).
First, when the number of effective contacts made by a typical infectious individual per day (β) increases over time (Scenario 2), overall effect on infection decreases (and can be negative) because at the early stage of outbreak, the less-vaccinated group has many infected and recovered with sterilizing immunity; while the more-vaccinated group has more susceptible (i.e., infection-naïve) individuals who have escaped the earlier infections and will experience a higher force of infection at the later time (eFigure 6). β is affected by probability of transmission per contact and number of contacts per day. Transmission probability depends on meteorological factors such as absolute humidity for the influenza A virus,21 behavioral factors such as usage of personal protective equipment,22 and biological factors such as changes in host immunity, and evolution of strains (a proper examination of the impact of co-circulating strains on the indirect effect requires modeling the cross immunity).23 The number of contacts can be affected by non-pharmaceutical interventions and seasonal variation in social contacts.
Second, when the probability of infection-related death (μ) increases over time (Scenario 3), overall effect on death decreases because the extensively vaccinated group(s) has more who escape the earlier infections and then experience the high fatality at the later stage of outbreak (eFigure 6). It is plausible for lethality of pathogens to increase over time: Disease severity was found to increase in the autumn wave of the 1918 flu pandemic compared to the spring-summer wave of the same pathogen in that year. Some evidence from the A/H1N1 pandemic in 2009 also suggests that lethality of a subtype may increase in the second wave compared to the first wave.24 Increasing lethality implies that vaccination at the beginning of outbreak can lead to a negative overall effect by postponing cases. On the other hand, if the fatality rate increases with the infection peak due to the sudden shortage of healthcare resources, the overall effect on death will be more positive because vaccines delay infection and flatten the epidemic curve. Likewise, if infection-fatality rates decline progressively due to improvements in care,25,26 then vaccination that delays the epidemic can have amplified positive overall effects.
Third, the overall effect of increased vaccination coverage decreases and may become negative when vaccine efficacies wane (Scenario 4). In particular, the vaccination proportion of α2 = 0.9 may result in more infections and deaths than the proportion of α1 = 0.7. eFigure 7 shows the epidemic curves given α1 = 0.7 and α2 = 0.9 proportions vaccinated. When α1 = 0.7, the epidemic peaks earlier and slows down due to the build-up of recovered individuals with sterilizing immunity; consequently, return of full susceptibility (i.e., loss of protection) among vaccinated individuals is too late to rescue the epidemic. However, when α2 = 0.9, epidemic is delayed and a pool of individuals who are at risk of infection is built up, such that return of susceptibility among vaccinated individuals can rescue the epidemic.
The current study has some limitations. First, vaccination is assumed to be a one-time event at baseline before the start of outbreak, but in reality, vaccine rollout is continuous over time and may occur during outbreak. A formalization of the causal effects under a time-varying regime (e.g., by specifying a sequence of proportions vaccinated  over time) will be left to future work. Second, to illustrate the counterexamples to the Claims, the current study uses a stylized model with multiple simplifications. For example, this model does not consider multiple risk groups, which may have had heterogenous susceptibility to adverse outcomes and heterogeneous mixing patterns, leading to a negative indirect effect for the unvaccinated such that the Claims do not hold. Vaccination for a subgroup could cause negative indirect effect in other subgroups by increasing risk for more severe complications. For example, empirical evidence showed that low rubella vaccination coverage in children increased rubella incidence in the 15 years or over and incidence of congenital rubella in newborns.27 Mathematical modelling suggested that infant vaccination against varicella could increase the rate of reactivation (i.e., zoster) in the entire population.28,29 The examples suggest that the potential for negative indirect effects may be greater when population subgroups differ in important properties, such as (in the rubella and varicella examples) risk for adverse outcomes.
Another limitation of our model is that in the scenarios considered, changes in lethality and transmission were assumed to occur at a fixed time, whereas in reality they might well occur either in response to pathogen evolution30 or to behavioral changes that are affected by the epidemic trajectory. However, our goal was not to describe the details of a particular epidemic but to define qualitatively the requirements for which direct effects are lower bound on overall effects at the population level. Finally, we did not consider possible adverse events after vaccination, although adverse events have important policy implications. Our focus here is on defining estimands for the protective effect of interventions on averting disease outcomes. Future studies can extend the estimands to investigate adverse events due to interventions.
In conclusion, causal estimands for effects of infectious disease interventions are originally defined at the individual level in terms of differences in individual risk under different treatment conditions, but we defined analogs of these effects at the population level. The aforementioned classification of estimands improves the conduct and interpretation of studies in evaluating the public health impact of any infectious disease intervention including vaccination. We showed— by proof for the full epidemic and by simulation for time points in the midst of the epidemic—that when transmission and fatality parameters do not vary and vaccine efficacies do not wane over time, population-level direct effect among the vaccinated (or unvaccinated) individuals can be interpreted as a lower bound of population-level overall effect quantifying vaccine-averted (or avertible) deaths among both vaccinated and unvaccinated individuals.
Data Availability
This is a simulation study with code available at https://github.com/katjia/population_level_effects.
REFERENCES


